The evaluation of cardiac function by echocardiography is an important tool in the assessment and follow-up of acquired and CHD. Traditional parameters, such as shortening fraction by motion-mode, ejection fraction by two-dimensional brightness-mode imaging, and myocardial velocities by pulsed-wave tissue Doppler imaging, provide valuable data on global cardiac function but have important limitations.Reference Marwick 1 , Reference Colan, Shirali and Margossian 2 These limitations include relatively high inter- and intra-observer variability, load dependency, and angle of insonation dependency. Myocardial deformation by two-dimensional speckle tracking echocardiography partly overcomes these limitations. Speckle tracking echocardiography is based on frame-by-frame tracking of natural acoustic markers (speckles) generated by brightness-mode imaging and provides data on myocardial systolic strain and systolic and diastolic strain rate.Reference Bohs and Trahey 3 Speckle tracking echocardiography is a relatively reproducible technique which is independent of the angle of insonation and enables quantification of both global and regional myocardial systolic and diastolic function in various relevant directions.Reference Koopman, Slorach and Hui 4 In addition, experimental and human studies have shown that strain rate is relatively independent of loading conditions, while strain is influenced by afterload and to a lesser extent by preload.Reference Ferferieva, Van den Bergh and Claus 5 , Reference James, Corcoran, Breatnach, Franklin, Mertens and El-Khuffash 6
Normative speckle tracking echocardiography data have been published for adults and children,Reference Yingchoncharoen, Agarwal, Popovic and Marwick 7 but data for circumferential strain remain scarce in pediatrics.Reference Bussadori, Moreo and Di Donato 8 – Reference Levy, Machefsky and Sanchez 13 Majority of the studies have used the General Electric ultrasound systems and EchoPac software.Reference Yingchoncharoen, Agarwal, Popovic and Marwick 7 Initially, large differences existed for strain and strain rate when using software packages of different vendors.Reference Koopman, Slorach and Hui 4 , Reference Nagata, Takeuchi and Mizukoshi 14 The recent work of the joint standardisation taskforce has considerably improved the comparability of myocardial strain values between vendors.Reference Yang, Marwick and Fukuda 15 However, only concordance data of myocardial strain in the longitudinal direction of the left ventricle have been reported by the taskforce.Reference Yang, Marwick and Fukuda 15 Reference values of speckle tracking echocardiography-derived longitudinal strain are scarce using QLAB software (Philips Medical Systems, Best, The Netherlands), especially strain values established with the software versions after the standardisation initiative.Reference Cantinotti, Scalese and Giordano 16 Many centres routinely use the Philips iE33 and EPIQ7 ultrasound systems (Philips Medical Systems, Best, The Netherlands), and QLAB software for analysing datasets, and reference values for peak systolic longitudinal strain and strain rate in adults have been recently published by our group.Reference Menting, McGhie and Koopman 17
The aims of the present study were to develop normal values for two-dimensional longitudinal and circumferential strain and strain rate of the left ventricle using a Philips platform and dedicated software and to evaluate the association with anthropometric and standard echocardiographic parameters.
Methods
Study population
This prospective study was performed between February 2013 and November 2015 at the Erasmus Medical Center/Sophia Children’s Hospital Rotterdam, The Netherlands. Healthy children aged 1–18 years were recruited in two ways – via local schools and children who were evaluated at the outpatient clinic for an innocent heart murmur. Children with systemic hypertension, acquired or CHD, obesity with body mass index ⩾2 SD, developmental delay, or a genetic syndrome were excluded from participation. No children were excluded because of expected poor echo window. Data on sex, body weight, height, blood pressure at supine position calculated as mean of three recordings, and resting heart rate from all participants were collected.
Echocardiographic image acquisition
All patients underwent a detailed transthoracic echocardiographic examination following the recommendations of the American Society of Echocardiography in childrenReference Lai, Geva and Shirali 18 using the iE33 ultrasound system and S5 transducer (adult probe). Each echocardiographic study was performed by an experienced sonographer (D.G.) or by a paediatric cardiologist (L.P.K.) and supervised by a member of the research team (L.P.K.). Standard apical four-chamber, apical two-chamber, apical three-chamber, and short-axis views at the level of the mitral valve, papillary muscle, and apex 1 or 2 intercostal lower level were acquired with a frame rate of 60–90 frames/second and stored as raw data. In addition, motion-mode images of the left ventricle and pulsed-wave Doppler images of the mitral valve and pulsed-wave Tissue Doppler images of the left ventricle using frame rate >150 frames/second were acquired and stored for off-line analysis.
Conventional echocardiographic parameters
For chamber measurements, the recommendations of the American Society of Echocardiography were used.Reference Lopez, Colan and Frommelt 19 Z-scores were calculated for left ventricle dimensions and wall thickness.Reference Colan 20 All measurements were performed in three different cardiac cycles using Xcelera software (Philips Medical Systems) and the values were averaged. Pulsed-wave Doppler flow measurements were obtained at the mitral valve level. Pulsed-wave tissue Doppler measurements were obtained at the basal segment of the lateral wall of the left ventricle. Ejection fraction was calculated using the biplane Simpson’s method provided by Xcelera. Left ventricular mass was calculated using the Devereux method and normalised to height2.7 and body surface area.Reference Devereux and Reichek 21
Speckle tracking echocardiography
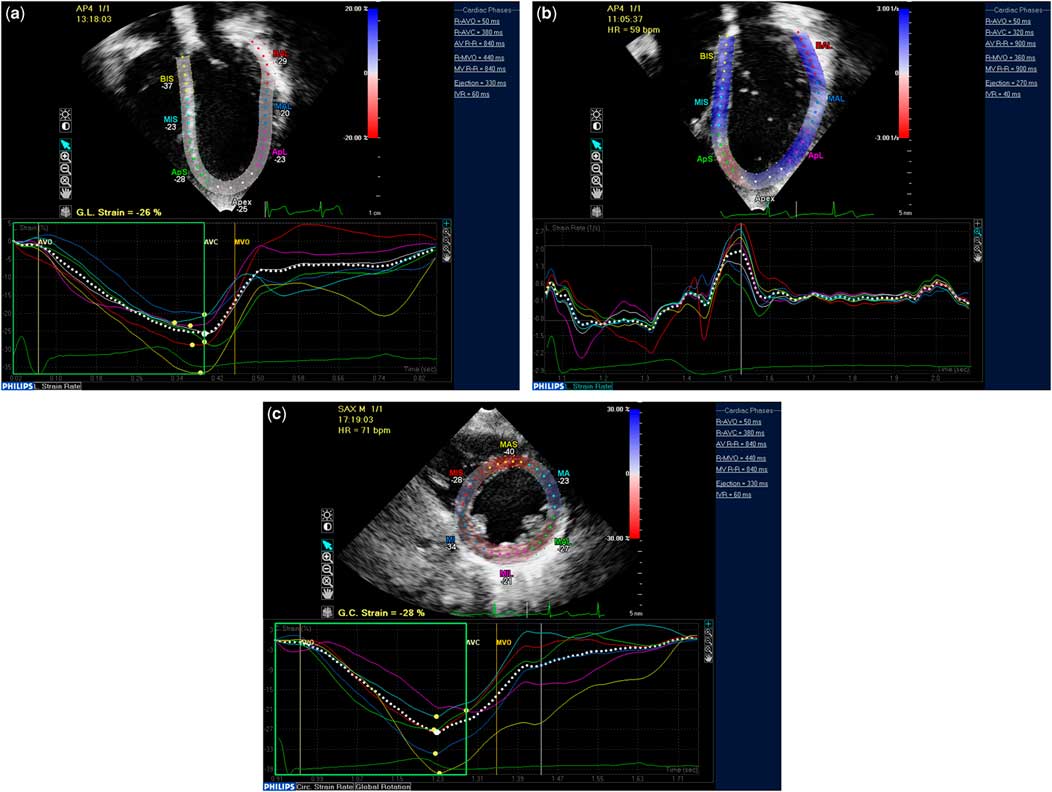
Timing of aortic valve closure and atrio-ventricular valve opening was based on pulsed-wave Doppler tracings of the systemic ventricular outflow tract and atrio-ventricular valve inflow. The grey scale images were analysed by a single investigator (L.P.K.) using QLAB version 9.0 according to the vendor’s instructions and described previously by our group.Reference Koopman, Slorach and Hui 4 , Reference Menting, McGhie and Koopman 17 After automated tracking analysis, visual inspection of the tracking was performed. If the tracking was not satisfactory, manual adjustments were made to the tracking points throughout the cardiac cycle. If satisfactory tracking was not accomplished within 5 minutes, the non-tracking segments were excluded from analysis. For the assessment of longitudinal deformation parameters of the left ventricle, the software automatically divided the apical chamber views into seven segments as three septal, three lateral, and one apical (Figs 1a and b). For the assessment of circumferential strain of the left ventricle, the short-axis images were used in six segments for mitral valve and papillary muscle levels and four segments for apical level (Fig 1c). Lagrangian peak systolic longitudinal and circumferential strain and longitudinal systolic and early diastolic strain rate values in apical four-chamber view were determined. Before speckle tracking analysis, the images were subjectively graded by one observer (L.P.K.) into three categories as good quality, moderate quality, and poor quality. Global strain was calculated if at least four out of six segments at circumferential basal and papillary muscle level, three out of four segments at circumferential apical, or five out of seven in longitudinal apical four-chamber, apical two-chamber and apical three-chamber views could be measured. If less segments could be measured, speckle tracking was considered not feasible.
Example of measurement of longitudinal strain (a) and strain rate (b) from apical 4-chamber view and circumferential strain at the papillary muscle level of the short axis view (c).

Reproducibility
Inter- and intra-observer variabilities of myocardial deformation parameters were assessed in 20 randomly selected studies. To assess intra-observer variability, the same observer who performed all the measurements, that is L.P.K., re-measured the same segments at least 2 weeks later to avoid recall bias. To assess inter-observer variability, deformation parameters were measured by one independent and blinded observer (B.R). Reproducibility was expressed as bias, that is limits of agreement, and the coefficient of variation calculated as the SD of the difference of paired samples divided by the average of the paired samples and multiplied by 100.
Statistical analysis
The study population was divided into four different age groups of approximately the same size and in accordance to a previously published meta-analysis.Reference Levy, Machefsky and Sanchez 13 Normal distribution of the data was tested using Shapiro–Wilk test. Data are expressed as frequencies, mean (SD) in case of normal distribution, or median (interquartile range) in case of non-normal distribution. Comparison within groups was performed using paired sample t-test or analysis of variance. Categorical data are presented as counts and percentages. Pearson’s correlations and their statistical significance were calculated as measures of raw associations between measurements. Linear regression analysis was used to evaluate the association between myocardial deformation parameters, which are dependent variables, and baseline characteristics such as anthropometric parameters and other echocardiographic parameters. Variables that reached p<0.05 and did not show collinearity with other variables were included in the multi-variate model. Body surface area was raised to various powers, for example,0.2, 0.5, 0.25, to compensate for its logical distribution and included in the model. Collinearity was tested using linear regression modelling. A variance inflation factor >5 was defined as significant collinearity. In case of collinearity the variable with the highest correlation was included in the model. Statistical analysis was performed using Statistical Package for the Social Sciences version 21.0 (International Business Machines Corporation Armonk, NY, USA). Two-sided p-values ⩽0.05 were considered to be statistically significant.
Results
Study population, general characteristics, and basic echocardiography
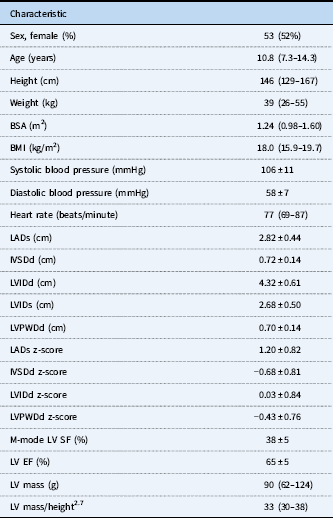
A total of 105 children were recruited and gave informed consent, of which 103 were included in the study. All children had the Dutch nationality and ethnicity was Western-European (84), Turkish (n=14), North-African (n=4), and Indian (n=1). Two children were excluded, one child had systemic hypertension and one child had a body mass index z-score >2. In Table 1 the general characteristics, left ventricular dimensions, and function of the study population are shown.
General characteristics, ventricular dimensions, and function in 103 participants.
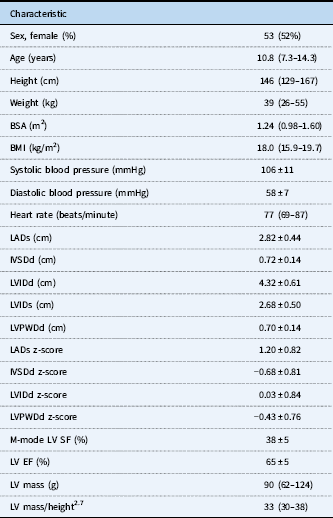
BSA=body surface area; BMI=body mass index; EF=ejection fraction; IVSDd=intraventricular septum dimension in diastole; LADs=left atrium dimension in systole; LVIDd=left ventricle internal dimension in diastole; LVIDs=left ventricle internal dimension in systole; LVPWDd=left ventricle posterior wall dimension in diastole; LV=left ventricle; SF=shortening fraction
Normal values for myocardial deformation parameters of the left ventricle
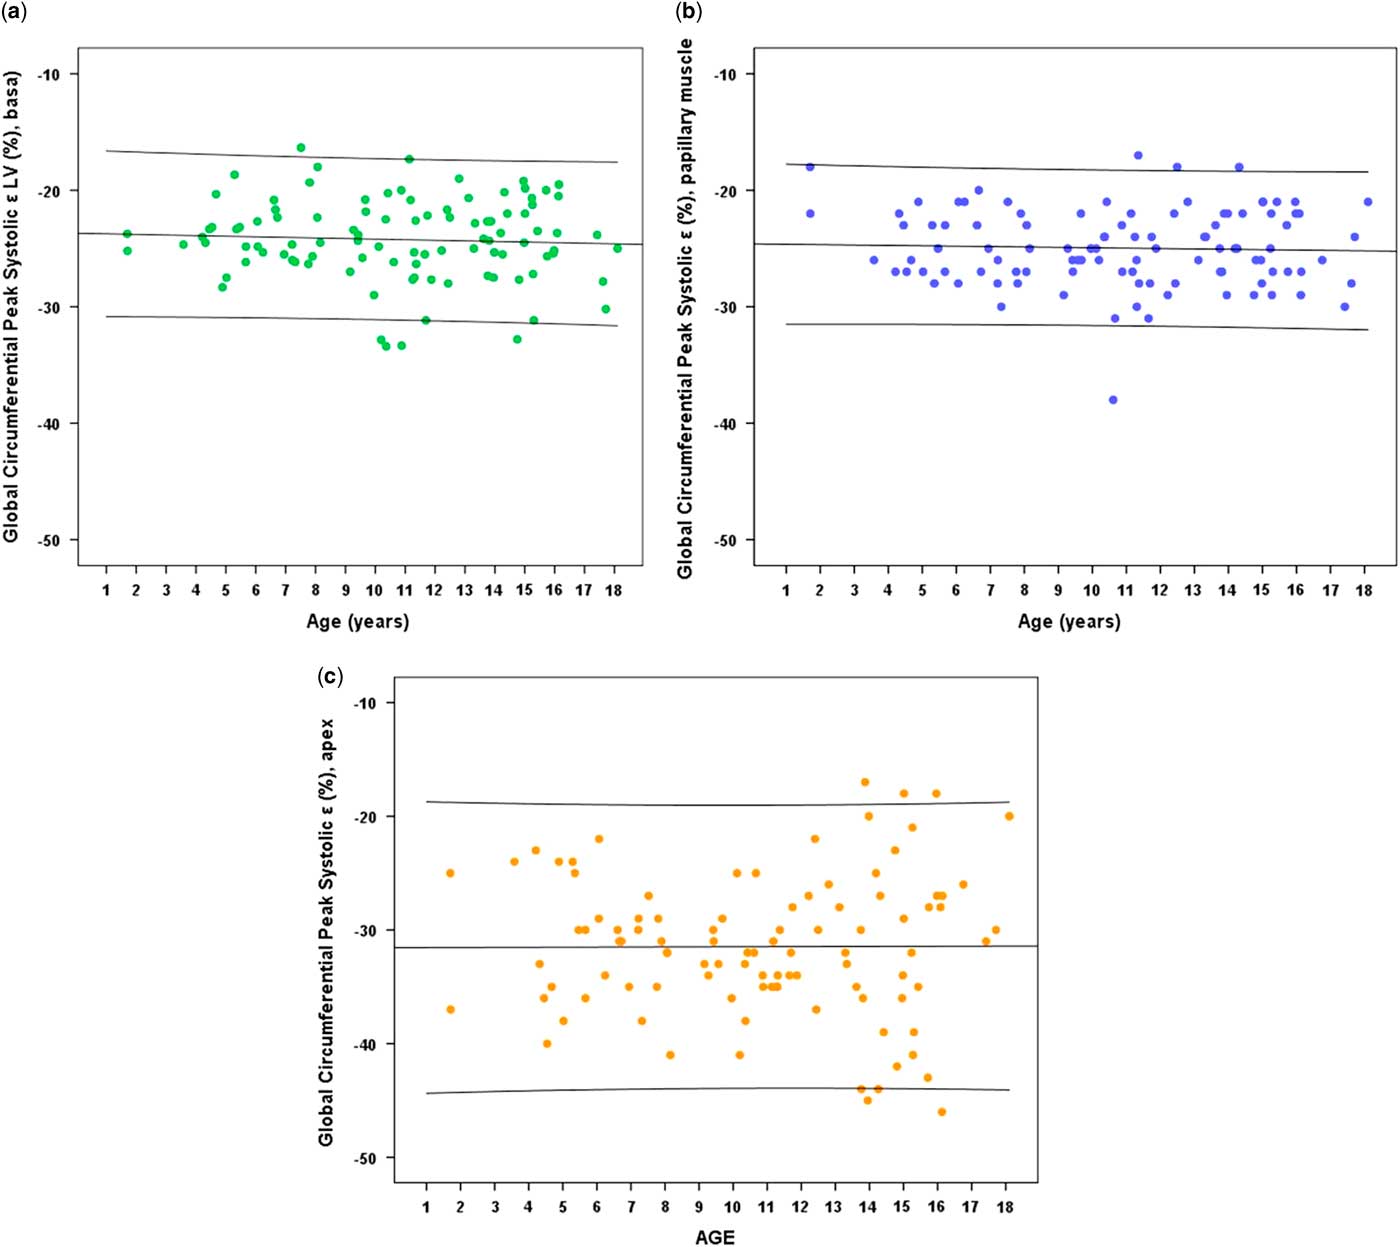
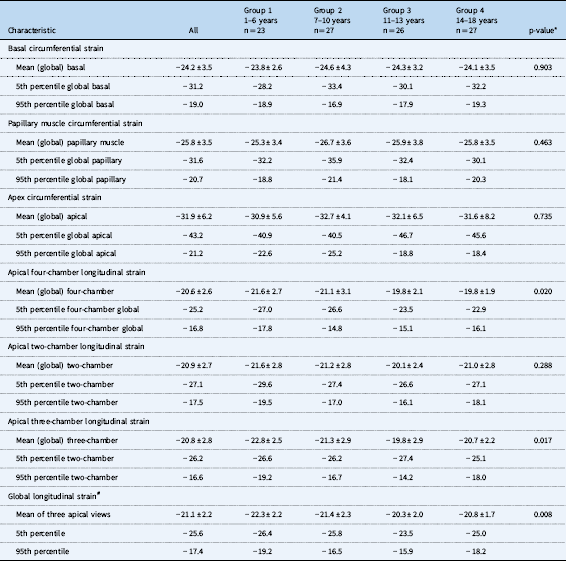
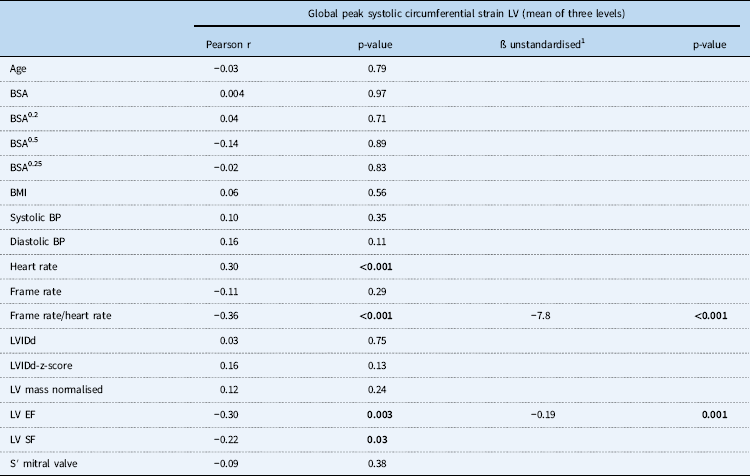
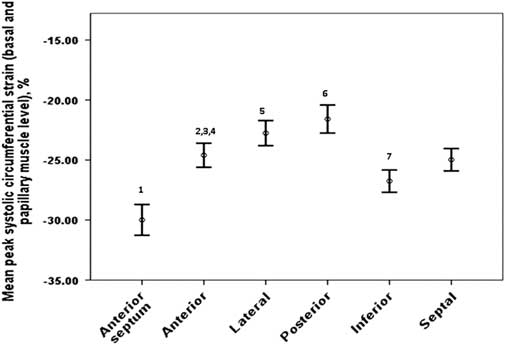
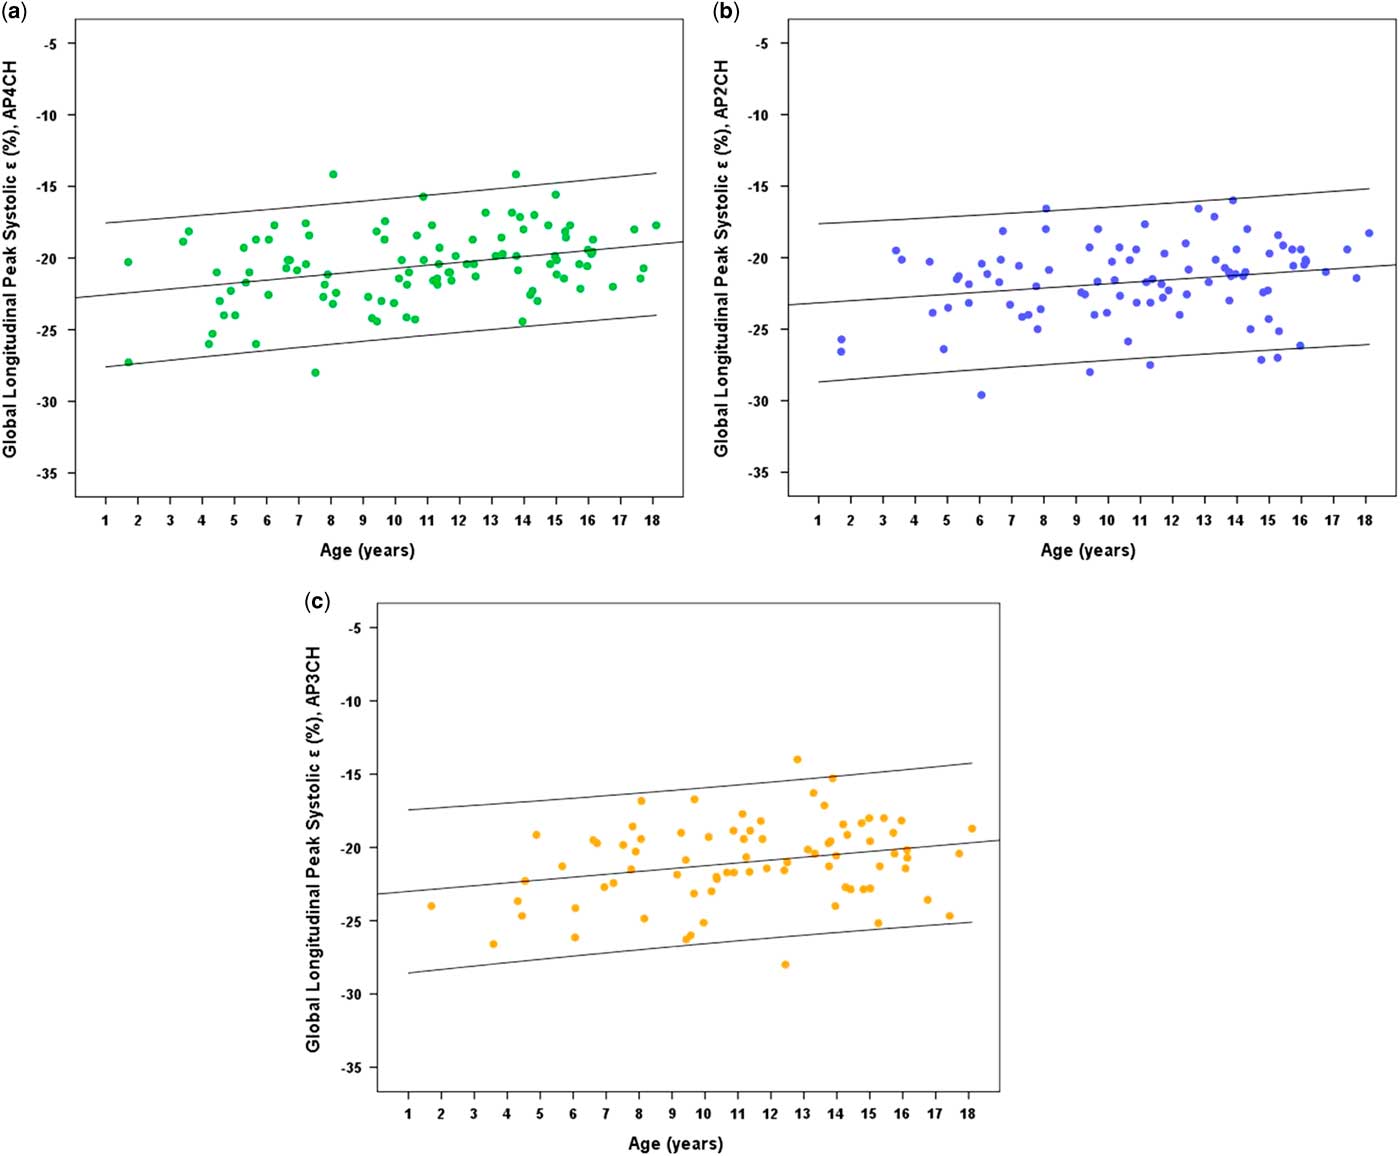
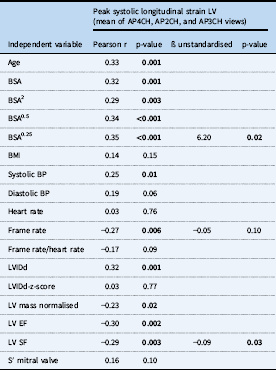
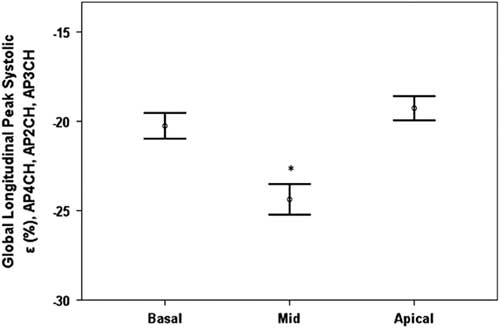
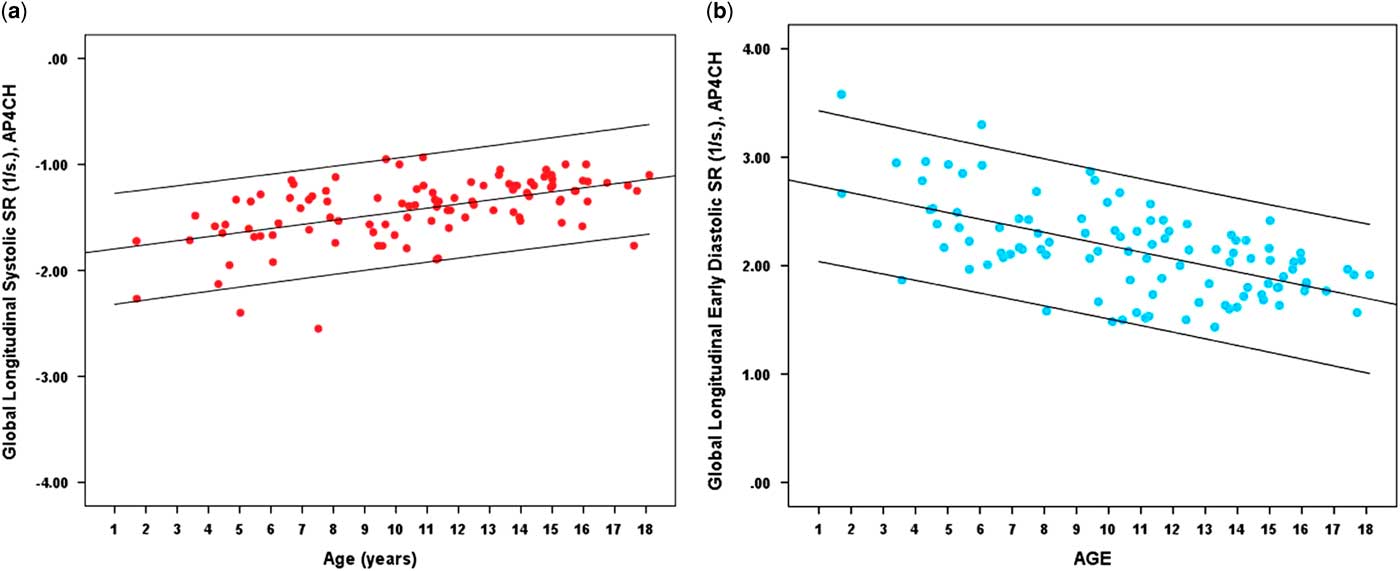
Figure 2 and Table 2 show the results for global circumferential peak systolic strain at the mitral valve – basal, papillary muscle, and apical levels. No association was found between age and circumferential strain in the univariate analysis (Table 3). In the multi-variate regression model only heart rate/frame rate ratio and left ventricular ejection fraction were associated with global circumferential strain (Table 3). Figure 3 shows the results for peak systolic strain stratified for the segment mitral valve and papillary muscle level combined. In Figure 4 and Table 2 the results for global longitudinal peak systolic strain of the left ventricle in apical four-chamber, two-chamber, and three-chamber views are summarised. Age and left ventricular ejection fraction were associated with longitudinal strain in the multi-variate regression model (Table 4). Figure 5 shows that longitudinal peak systolic strain is highest at the mid-ventricular level (p<0.001). For each level of the left ventricle, for example basal, mid, or apical, longitudinal peak systolic strain values of the six different segments were comparable, but data not shown. Results for global systolic strain rate and early diastolic strain rate of the left ventricle are shown in Figure 6. Both systolic and diastolic strain rate decreases with increasing age (Fig 6 and Table 5).
Global peak systolic circumferential strain at the basal level (a), papillary muscle level (b) and apical level (c) by age. Lines represent mean and 95% confidence interval.

Peak systolic strain left ventricle, normal values, categorised for four age groups.

*p-value based on ANOVA. #Average of longitudinal strain of four-chamber, two-chamber, and three-chamber views
Univariate and multivariate regression models for global peak systolic circumferential strain LV (mean of three levels).

BSA=body surface area; BMI=body mass index; BP=blood pressure; LVIDd=left ventricle internal dimension in diastole; LV=left ventricle; EF=ejection fraction; SF=shortening fraction; S=systolic.
Variables that reached p-values <0.01 in the univariate model and did not show collinearity with other variables (VIF < 5) were included in the multi-variate model. In case of collinearity, the variable with the highest correlation coefficient was included in the multi-variable model. If a variable included in the multi-variate model did not reach statistical significance, it was stepwise excluded. Reference Marwick 1 r=0.468, r2=0.219 for multivariate regression model, p<0.001
Bold value indicates p-values <0.05.
Mean peak systolic circumferential strain depending on the segment analyzed. 1p < 0.001 for comparison with all other segment, paired sample t-test; 21 < 0.01 versus lateral; 3p < 0.001 versus posterior, 4p = 0.001 versusinferior; 5p < 0.001 versus inferior and septal; 6p < 0.001 versus inferior and septal; 7p = 0.01 versus septal.

Global peak systolic longitudinal strain of the apical 4-chamber view (a), apical 2-chamber view (b) and apical 3-chamber view (c) by age. Lines represent mean and 95% confidence interval.

Univariate and multivariate regression models LV global longitudinal strain.

AP2CH=apical two-chamber; AP3CH=apical three-chamber; AP4CH=apical four-chamber, BSA=body surface area; BMI=body mass index; BP=blood pressure; EF=ejection fraction; LVIDd=left ventricle internal dimension in diastole; LV=left ventricle; SF=shortening fraction; S=systolic.
Variables that reached p-values <0.01 in the univariate model and did not show collinearity with other variables (VIF < 5) were included in the multi-variate model. In case of collinearity, the variable with the highest correlation coefficient was included in the multi-variable model. If a variable included in the multi-variate model did not reach statistical significance, it was stepwise excluded. r=0.43, r2=0.19 for multi-variate regression model, p<0.001
Bold value indicates p-values <0.05.
Mean peak systolic longitudinal strain depending on the level (basal, mid, apical) analyzed. ∗p-value < 0.001 for difference between mid and basal and difference between mid and apical, paired sample-test.

Global longitudinal systolic strain rate (a) and early diastolic strain rate (b) by age. Lines represent mean and 95% confidence interval.

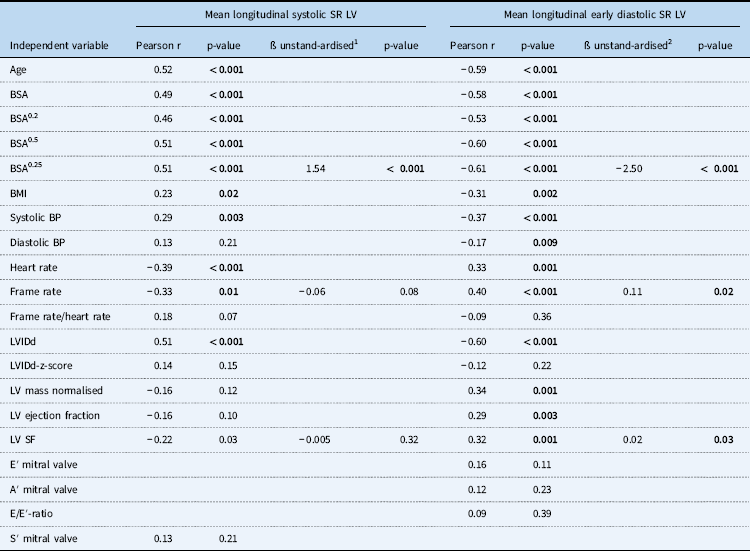
Univariate and multivariate regression models of LV systolic and early diastolic longitudinal strain rate.

A=late diastolic; BMI=body mass index; BSA=body surface area; E=early diastolic; EF = ejection fraction; LV=left ventricle; LVIDd=left ventricle internal dimension in diastole; S=systolic; SF=shortening fraction; TDI=tissue Doppler imaging
Variables that reached p-values <0.01 in the univariate model and did not show collinearity with other variables (VIF < 5) were included in the multi-variate model. In case of collinearity, the variable with the highest correlation coefficient was included in the multi-variable model. If a variable included in the multi-variate model did not reach statistical significance, it was stepwise excluded. 1r=0.54, r2=0.29 for multi-variate regression model, p<0.001. 2r=0.66, r2=0.44 for multi-variate regression model, p<0.001.
In the multi-variate regression models (Tables 3–5), no association was found between systemic blood pressure and indices of cardiac size with any of the deformation parameters. All myocardial deformation parameters were similar in boys and girls, but data not shown.
Feasibility and reproducibility of speckle tracking echocardiography and the influence of image quality
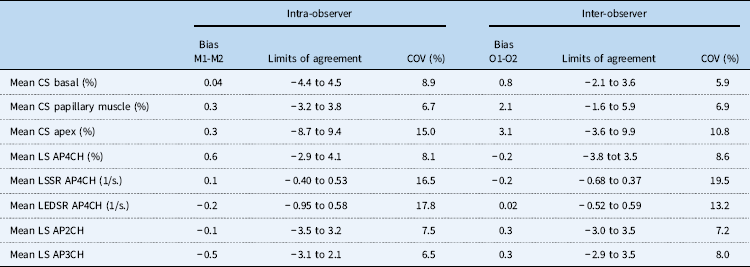
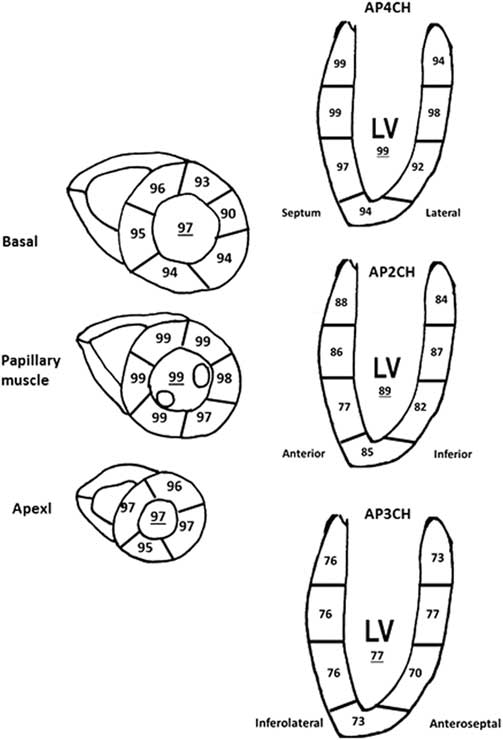
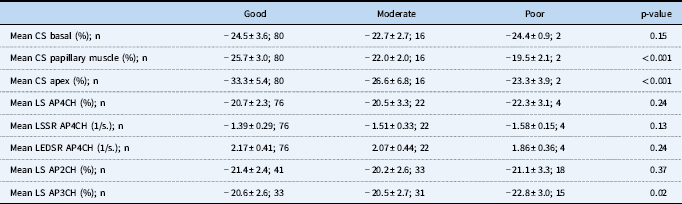
Reproducibility data are provided in Table 6, which shows intra- and inter-observer coefficient of variation of deformation parameters to be between 6 and 19%. Figure 7 shows that feasibility of two-dimensional speckle tracking echocardiography using the Philips platform is >90% for the majority of segments for both circumferential and longitudinal deformation. Feasibility of longitudinal strain measurement was highest for the apical four-chamber view and lowest for apical three-chamber view. In Table 7, the influence of subjectively determined image quality on strain and strain rate values is shown. For circumferential strain at the papillary muscle and apical level, values are lower when image quality is lower, and for longitudinal strain from apical three-chamber images, values are higher when image quality is lower. All other parameters are not affected by image quality.
Intra- and inter-observer variability by two-dimensional strain measurements of the LV.
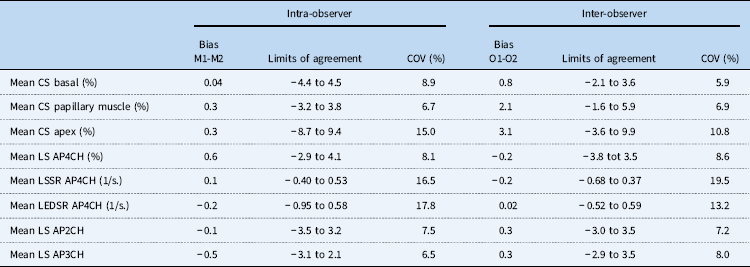
AP4CH=apical four-chamber; COV=coefficient of variation; CS=peak systolic circumferential strain; LEDSR=longitudinal early diastolic strain rate; LS=peak systolic longitudinal strain; LSSR=longitudinal systolic strain rate; M=measurement; O=observer
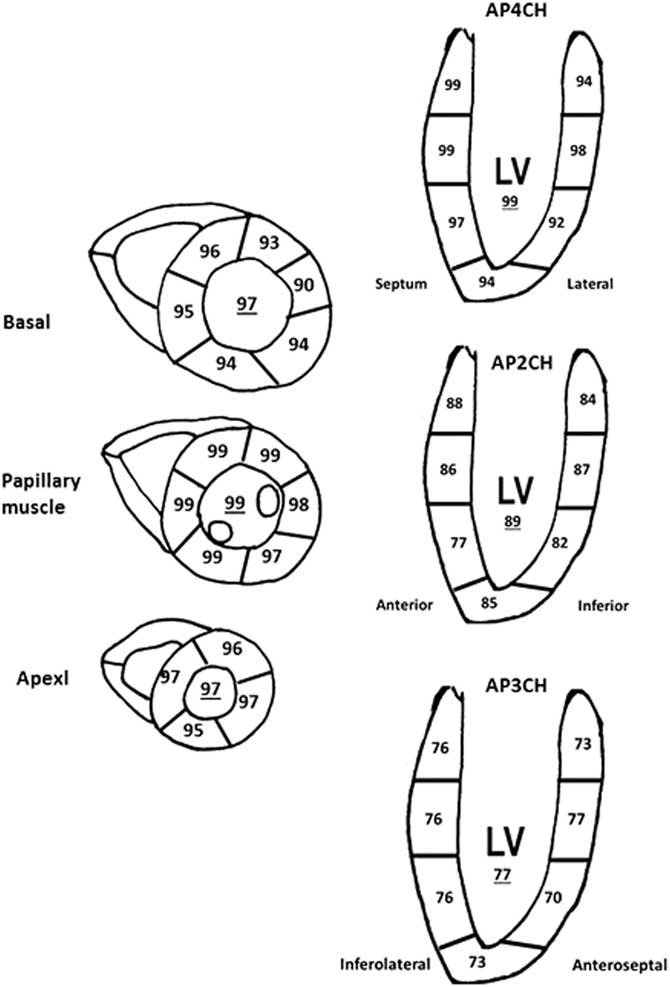
Feasibility of segmental and global peak systolic circumferential and longitudinal strain.
Influence of subjective image quality on myocardial strain and SR parameters.

AP4CH=apical four-chamber; CS=peak systolic circumferential strain; LEDSR=longitudinal early diastolic strain rate; LS=peak systolic longitudinal strain; LSSR=longitudinal systolic strain rate
Discussion
In this paper we provide comprehensive reference values of myocardial deformation parameters of the left ventricle in healthy children between 1 and 18 years using the Philips platform. We found that circumferential systolic strain of the left ventricle is independent of age. Longitudinal strain of the left ventricle, and to a greater extent, longitudinal systolic strain rate and early diastolic strain rate of the left ventricle decrease with increasing age. In addition, left ventricular ejection fraction was an independent predictor of left ventricular circumferential strain and longitudinal diastolic strain rate, and left ventricular shortening fraction was an independent predictor of longitudinal strain.
Reference value studies on myocardial deformation
Reference value studies for myocardial deformation parameters in children are relatively scarce. Reference values on segmental and global values of two-dimensional longitudinal, radial, and circumferential strain of the left ventricle have been published using the General Electric platform,Reference Marcus, Mavinkurve-Groothuis and Barends 10 , Reference Dallaire, Slorach and Bradley 11 , Reference Klitsie, Roest, van der Hulst, Stijnen, Blom and Ten Harkel 22 , Reference Sato, Maruyama and Ichihashi 23 Siemens platform (Vector Velocity Imaging, Mountain View, United States of America),Reference Lorch, Ludomirsky and Singh 24 and Esaote platform (XStrain, Florence, Italy).Reference Bussadori, Moreo and Di Donato 8 Meta-analyses on myocardial deformation parameters of the left ventricle and right ventricle in normal children have been published, combining data of the previously mentioned normal value studies, intervention studies, and case–control studies.Reference Jashari, Rydberg and Ibrahimi 12 , Reference Levy, Machefsky and Sanchez 13 , Reference Cantinotti, Kutty and Giordano 25 , Reference Levy, Sanchez Mejia, Machefsky, Fowler, Holland and Singh 26 This work complements the small, yet growing literature that has used the Philips platform to report normal values for myocardial deformation parameters in children. Previous studies include a large multicentre Japanese study in children and adults using three different ultrasound platformsReference Takigiku, Takeuchi and Izumi 27 and a recently published study in healthy Italian children using the Philips iE33 ultrasound machine and QLAB 9 software.Reference Cantinotti, Scalese and Giordano 16 In the study by Takigiku et al, no data are provided on the number of children included and only separate paediatric data are reported on global longitudinal strain using the 18-segment model.Reference Takigiku, Takeuchi and Izumi 27 The study by Cantinotti et al reports normal values for global circumferential strain in the left ventricle and global longitudinal strain in the left and right ventricle in children.Reference Cantinotti, Scalese and Franchi 28 The present study also reports on regional circumferential and longitudinal strain and longitudinal strain rate and therefore adds to the current literature in our opinion.
Left ventricular strain and strain rate
Circumferential strain
We found that mean global circumferential peak systolic strain values in children were between −31.9±6.2% at apex, −25.8±3.5% at papillary muscle, and −24.2±3.5% at mitral valve using the Philips platform. Cantinotti et al found mean global end-systolic circumferential strain values between −24.5 and −28.7% at apex, −24.8 and −26.1% at papillary muscle, and −22.0 and −23.0% at mitral valve levels when comparing similar age groups.Reference Cantinotti, Scalese and Franchi 28 The circumferential strain values in our study seem slightly higher compared to the values reported by Cantinotti. This is probably explained by the fact that we have used peak systolic strain and Cantinotti report on end-systolic strain, which is usually reached at the descending limb of the strain curve (Fig 1c). The values reported by Cantinotti et al and the values reported by us are higher, that is more negative, compared with published data using the General Electric platform or Esaote platform.Reference Bussadori, Moreo and Di Donato 8 , Reference Marcus, Mavinkurve-Groothuis and Barends 10 , Reference Klitsie, Roest, van der Hulst, Stijnen, Blom and Ten Harkel 22 , Reference Sato, Maruyama and Ichihashi 23 Mean global circumferential strain in children aged 1–18 years is approximately −22.5% at papillary muscle to −21.0% at mitral valveReference Marcus, Mavinkurve-Groothuis and Barends 10 , Reference Klitsie, Roest, van der Hulst, Stijnen, Blom and Ten Harkel 22 , Reference Sato, Maruyama and Ichihashi 23 using the General Electric platform and −32.0% at apex, −24.0% at papillary muscle, and 22.0% at mitral valve using the Esaote platform.Reference Bussadori, Moreo and Di Donato 8 In a meta-analysis of data of 16/19 healthy children using the General Electric platform, circumferential strain at papillary muscle level was found to range between −10.5 and −27.0% with mean 22.1%.Reference Jashari, Rydberg and Ibrahimi 12 These findings of lower circumferential strain values using the General Electric platform compared to the Philips platform are in agreement with an earlier publication by our group and highlights the need for vendor dependent normal values for circumferential strain until standardisation initiatives have been deployed for this particular deformation parameter.Reference Koopman, Slorach and Hui 4 We found highest values of systolic circumferential strain in the anterior septal segments and lowest values in the posterior segments, which is in agreement with other studies.Reference Marcus, Mavinkurve-Groothuis and Barends 10 , Reference Jashari, Rydberg and Ibrahimi 12 , Reference Sato, Maruyama and Ichihashi 23
Longitudinal strain
Global left ventricular longitudinal peak systolic strain values were −20.6±2.6% in apical four-chamber, −20.9±2.7% in apical two-chamber, and −21.0±2.7% in apical three-chamber views, respectively. Takigiku et al found a mean global longitudinal strain of −19.9±2.5% in children aged 0–19 years using the Philips platform and QLAB 7 software, which is comparable to our data.Reference Takigiku, Takeuchi and Izumi 27 These values are also comparable with normal value studies in children performed before the standardisation initiative using the General Electric or Esaote platform. For comparable age groups global left ventricular longitudinal systolic strain was reported to be −21.5, −21.2, and 22.1%, all apical four-chamber view, respectively.Reference Bussadori, Moreo and Di Donato 8 , Reference Marcus, Mavinkurve-Groothuis and Barends 10 , Reference Klitsie, Roest, van der Hulst, Stijnen, Blom and Ten Harkel 22 It should be noted that in the study by Klitsie et al and Bussadori et al, peak strain instead of peak systolic strain is reported.Reference Bussadori, Moreo and Di Donato 8 , Reference Marcus, Mavinkurve-Groothuis and Barends 10 It seems likely, however, that maximum strain in healthy children will be reached during systole, and therefore, this methodological difference between the studies is unlikely to be of great influence. In a meta-analysis study, where 22/25 studies used the General Electric platform, normal global longitudinal strain in apical four-chamber ranged from −12.9 to −26.5% with mean −20.5%.Reference Jashari, Rydberg and Ibrahimi 12 Cantinotti et al found mean end-systolic longitudinal strain values between −24.8 and −25.3% using apical four-chamber view, −24.1 and −25.4% by apical two-chamber and −23.2 and −23.9% by apical three-chamber using a similar platform compared to our study.Reference Cantinotti, Scalese and Franchi 28 It is unclear why they found slightly higher values compared to our study and the study by Takigiku et al, as well as studies using the General Electric or Esoate platforms but might reflect small variations between different populations. Interestingly, recently published reference values by our group for global left ventricular longitudinal peak systolic strain values in adults aged 20–72 years using the Philips platform are very similar compared to our paediatric values of −20.8% for apical four-chamber and 20.4% for apical two-chamber.Reference Menting, McGhie and Koopman 17 A few case–control studies on myocardial deformation using speckle tracking echocardiography in children have been published using the Philips equipment and QLAB software. Labombarda et al published a study on myocardial deformation parameters in 100 diabetic children and 79 healthy controls with mean age of 11.8+3.2 years using the iE33 ultrasound machine and QLAB software by Philips.Reference Labombarda, Leport and Morello 29 In the control group the mean global left ventricular longitudinal strain using apical four-chamber only was −20.5±1.5%. Sainz et al performed a case–control study in 64 HIV-infected children and 58 healthy controls with mean age of 13.3±5.4 years using the Philips CX50 ultrasound machine and QLAB version 7.1.Reference Sainz, Alvarez-Fuente and Fernandez-Jimenez 30 The mean longitudinal strain values, that is the average of apical four-chamber, three-chamber, and two-chamber, was −20.3±4.3% in the control group.Reference Sainz, Alvarez-Fuente and Fernandez-Jimenez 30 Roberson et al performed a case–control study in 34 children with a reduced ejection fraction and 46 healthy controls of age 8.5±6.8 years using the Philips ultrasound machine (iE33) and QLAB software.Reference Roberson and Cui 31 They found slightly higher global longitudinal strain values using the apical four-chamber view, mean 23.4±4.6%, in the healthy control group.Reference Roberson and Cui 31 Sainz et al performed a case–control study in 64 HIV-infected children and 58 healthy controls of mean age 13.3±5.4 years using the Philips CX50 ultrasound machine and QLAB version 7.1. The mean longitudinal strain values, that is the average of apical four-chamber, three-chamber, and two-chamber, was −20.3±4.3% in the control group.
We found the highest magnitude of longitudinal strain values in the mid-ventricular segments (Fig 5). Previous studies that evaluated normal patterns in children and adults found a typical base to apex gradient with lowest magnitude of values at the base and highest magnitude of values at the apex.Reference Marcus, Mavinkurve-Groothuis and Barends 10 , Reference Levy, Machefsky and Sanchez 13 , Reference Menting, McGhie and Koopman 17 In the meta-analysis by Jashari et al, there was no overall significant base to apex gradient for longitudinal strain values in children, but the increasing patterns in the magnitude of longitudinal strain from base-to-apex were significant in two of the three age groups. We suspect that our study was underpowered to properly test this question, but further research is needed to investigate the reliability of segmental strain patterns in children.Reference Jashari, Rydberg and Ibrahimi 12
Longitudinal strain rate
Mean global left ventricular longitudinal systolic strain rate and early diastolic strain rate in our study was −1.42±0.30 1/s. and 2.14±0.42 1/s., respectively. No reference value studies have been published on longitudinal strain rate in children. In a meta-analysis using data from case–control studies only – 10/12 studies using the General Electric platform – normal values for longitudinal systolic strain rate varied from −0.90 to −2.70 1/s. (mean −1.30 1/s.).Reference Jashari, Rydberg and Ibrahimi 12
Association between myocardial deformation, age, and other variables
We did not find a clear relation between age or body surface area and circumferential strain, which is in agreement with the studies by Klitsie et al and Sato et al.Reference Klitsie, Roest, van der Hulst, Stijnen, Blom and Ten Harkel 22 , Reference Sato, Maruyama and Ichihashi 23 Marcus et al found a weak, but statistically significant relation between age and systolic circumferential strain.Reference Marcus, Mavinkurve-Groothuis and Barends 10 However, when analysing their data in more detail, the relation with age is mainly driven by the lower strain values in children aged 0–1 years and adults aged 20–40 years age groups that were not included in the present study. Dallaire et al found a weak but statistically significant relation between body surface area and age with most circumferential strain parameters – lower strain with increasing age or body surface area.Reference Dallaire, Slorach and Bradley 11 In a meta-analysis study no association was found between age and circumferential strain.Reference Jashari, Rydberg and Ibrahimi 12
We found a weak, but statistically significant relation between age and global left ventricular longitudinal peak systolic strain, with slightly decreasing strain values with increasing age. This is also visible when the data are presented in age groups (Table 2), especially for measurements of the apical four-chamber and apical three-chamber views. This finding is in agreement with the studies by Marcus et alReference Marcus, Mavinkurve-Groothuis and Barends 10 and Dallaire et al.Reference Dallaire, Slorach and Bradley 11 However, Klitsie et al did not find a relation between age and global left ventricular longitudinal strain, and also in the meta-analysis study performed by Jashari et al, no independent relation between age and longitudinal strain was found.Reference Jashari, Rydberg and Ibrahimi 12 , Reference Klitsie, Roest, van der Hulst, Stijnen, Blom and Ten Harkel 22
In accordance with our study, Jashari et al found a strong association between age and longitudinal systolic strain rate,Reference Jashari, Rydberg and Ibrahimi 12 highlighting the need for stratifying this deformation parameter for age. The higher strain rate values in younger children compared to older children is probably related to the shorter duration of each cardiac cycle. Strain values are quite comparable among the different age groups; therefore, the rate in which this deformation occurs should be higher when the cardiac cycle is shorter. Since heart rate and age show a very strong collinearity, this hypothesis is difficult to prove. Experimental and human studies suggest that intrinsic myocardial contractility is best represented by systolic strain rate.Reference Ferferieva, Van den Bergh and Claus 5 , Reference James, Corcoran, Breatnach, Franklin, Mertens and El-Khuffash 6 A study in children showed that myocardial contractility assessed by rate-corrected velocity of circumferential fibre shortening – end-systolic wall stress relation decreases with ageReference Rowland and Gutgesell 32 and could therefore also partly explain the decrease in systolic strain rate we observed. The lack of association between myocardial deformation parameters, systolic blood pressure, and left ventricular size in normal children does not imply that there is no association between these parameters in the setting of abnormal loading conditions, such as systemic hypertension, left ventricular outflow tract, obstruction, or congenital or acquired heart disease affecting heart size – cardiomyopathy, aortic regurgitation.Reference Levy, Machefsky and Sanchez 13 , Reference Levy, Sanchez Mejia, Machefsky, Fowler, Holland and Singh 26
Feasibility and reproducibility
The present study demonstrates that two-dimensional strain measurements by speckle tracking in healthy children using the Philips platform is highly feasible and comparable with results we obtained in adults.Reference Menting, McGhie and Koopman 17 We found a lower but still acceptable feasibility for longitudinal strain of the left ventricle using the apical two-chamber and three-chamber images, probably due to difficulties in obtaining adequate echo window. For some parameters the mean values seem to be somewhat influenced by image quality, highlighting that maximal effort should be undertaken to optimise image quality for the assessment of speckle tracking echocardiography. Intra- and inter-observer variability is acceptable especially for circumferential and longitudinal strain of the left ventricle and comparable with studies using the Philips platform published by our groupReference Koopman, Slorach and Hui 4 , Reference Menting, McGhie and Koopman 17 and studies using the General Electric platform.Reference Koopman, Slorach and Hui 4 , Reference Marcus, Mavinkurve-Groothuis and Barends 10 , Reference Dallaire, Slorach and Bradley 11 , Reference Klitsie, Roest, van der Hulst, Stijnen, Blom and Ten Harkel 22 , Reference Sato, Maruyama and Ichihashi 23 Coefficient of variations for left ventricular systolic and diastolic strain rate are higher, which is in accordance with other studies.Reference Menting, McGhie and Koopman 17 , Reference Lorch, Ludomirsky and Singh 24 Unfortunately, in our experience reproducibility of strain rate parameters is even worse using colour tissue Doppler techniques to assess strain rate.Reference Koopman, Slorach and Hui 4
Study limitations
The study was performed in a single centre and results from other centres and different populations are therefore not automatically comparable. This paper presents normal values for two-dimensional myocardial deformation parameters of the left ventricle, while more recently normal values in children using three-dimensions have been published.Reference Zhang, Gao and Xie 33 Three-dimensional strain has the potential benefit such as it is faster, more reproducible, and overcomes the issue of out of plane motion of the myocardium during the cardiac cycle, a phenomenon that can be found using two-dimensional strain. However, two-dimensional strain is much wider available and has superior temporal resolution compared to current three-dimensional strain algorithms and will therefore be of great value in the near and mid-term future. We did not include children below the age of 1 year because QLAB 9 only supports the adult ultrasound probe for myocardial deformation, which could not be used adequately in this young population. QLAB 9 does not allow to measure radial strain. The reason for this is that variability for radial strain measurement is unacceptably high when using other platforms and we therefore believe that with the current speckle tracking techniques this parameter has very limited value.Reference Koopman, Slorach and Hui 4
Dallaire et alReference Cantinotti, Kutty and Franchi 34 recently published body surface area-specific z-scores for myocardial deformation parameters by using a sophisticated statistical approach using data of a large population of healthy Canadian children.Reference Dallaire, Slorach and Bradley 11 Although we acknowledge that the use of z-scores is widely accepted in paediatric echocardiography,Reference Lopez, Colan and Frommelt 19 , Reference Cantinotti, Scalese and Franchi 28 the construction of reliable z-scores require a strong correlation between echocardiographic parameters and body size.Reference Cantinotti, Scalese and Franchi 28 Our study and others have shown that the relation between body size on myocardial deformation parameters is much weaker compared to values of Doppler measurements and cardiac size.Reference Dallaire, Slorach and Bradley 11 , Reference Cantinotti, Scalese and Giordano 16 , Reference Cantinotti, Scalese and Franchi 28 For this reason and because of the relative small sample size of our study, we chose not to use the z-score approach.Reference Cantinotti, Scalese, Molinaro, Murzi and Passino 35 , Reference Colan 36 Finally, although this reference value study included over 100 participants, estimation of the mean values would have been more robust and confidence intervals would have been slightly narrower if more participants were included.Reference Cantinotti, Scalese and Franchi 28 Especially in younger children where number of participants were lower, the normal values should be interpreted with caution.
Conclusions
Reference values for myocardial deformation parameters of the left ventricle are provided in children using the Philips platform. Although normal values for global longitudinal strain are relatively comparable with previously published studies using equipment of other vendors (mainly General Electric), normal values for circumferential strain seem higher while using the Philips platform compared to other platforms. This emphasises the need for standardisation of circumferential strain measurements by the different vendors, an initiative which recently has been successfully implemented for longitudinal strain.
Acknowledgements
The authors thank the children and their parents for participating in the study.
Financial support
This research received no specific grant from any funding agency, or from commercial or not-for-profit sectors.
Conflicts of interest
None.
Ethical standards
The study is in accordance with the 1964 Declaration of Helsinki and was approved by the local Institutional Research Ethics Board. Written informed consent was obtained from each participant and/or their parents before enrolment.