I. INTRODUCTION
The endowment of gradients to near-surface microstructures in machine elements has garnered significant interest recently. This interest originates from strong correlations between these gradients and concomitant enhancements of surface-originating structural and functional behavior in fabricated components.Reference Deng, Godfrey, Liu and Hansen1,Reference Liu, Zhang and Lu2 For instance, gradients involving near-surface nanocrystalline microstructures on a microcrystalline bulk exhibit enhanced resistance to scratching, fatigue, and corrosionReference Guo, Saldana, Dale Compton and Chandrasekar3–Reference Huang, Wang, Yong and Lu5 in addition to featuring superior combinations of ductility and strength compared to homogeneous microstructures featuring a lack of gradients.Reference Lu6 The sources of these unique properties are found in synergetic strengthening created by the incompatible deformation present across the mixture of refined and coarse grains, which result from promoted dislocation activities.Reference Wu, Jiang, Chen, Yuan and Zhu7 In this regard, materials with gradients in microstructures are more promising candidates for applications where the typical enhanced properties accessible through grain refinement must be attained without an appreciable loss of ductility.
Mechanical surface modification techniques involving grain refinement by severe plastic deformation (SPD), viz. surface severe plastic deformation (S2PD), have been developed for fabrication of gradient microstructures.Reference Guo, Compton and Chandrasekar8 Here, grain refinement involves interplay of dislocations through generation, storage, and annihilation, sometimes further compounded by twinning. Through this interplay, a microcrystalline structure featuring δ > 10 μm evolves to a nanocrystalline state featuring δ < 0.1 μm, where δ is the average grain size.Reference Murthy, Saldana, Hudspeth and Saoubi9 Sliding-type processes utilizing the effect of high interfacial friction have been found to be effective in nanocrystallization, while preserving the pristine state of the bulk. Examples of such processes include platen friction sliding,Reference Deng, Godfrey, Liu and Hansen1 surface mechanical grinding treatment,Reference Li, Tao and Lu10 and sliding friction treatment.Reference Wang, Yang, Shang, Li, Lv, Zhang and Zhang11 These processes enable the generation of deep work-hardened layers while providing control over the nature of the aforementioned gradients, wherein the functional behavior of the fabricated component can be optimized.
The transition from micro- to nanocrystalline states can be characterized as a function of thermomechanical conditions prevailing during shear, which comprise strain, strain rate, and temperature (i.e., ε,  $\dot{\varepsilon }$, and T). Herein, the response of materials in extreme S2PD conditions characterized by high strains (i.e., ε > 8) is less understood. Sources of this knowledge gap include the effects of high concentrations of grain boundaries with pre-existing and pristine dislocations during accumulative straining.Reference Basu and Shankar12 Furthermore, these effects are compounded by process specific deformation fields, wherein frameworks that encapsulate material response as a function of the simplistic thermomechanical variables (i.e., ε,
 $\dot{\varepsilon }$, T) are challenging to formulate over an extensive thermomechanical domain.Reference Basu, Wang, Liu and Saldana13 The present work seeks to address this knowledge gap by delineating material behavior during deformation occurring in S2PD by severe plastic burnishing (SPB). This process involves a hard wedge advancing over a workpiece, wherein the microstructural state in the latter is perturbed by the frictional sliding induced severe shear from the former. The mechanics of this process are analogous to machining.Reference Brown, Saldana, Murthy, Mann, Guo, Allard, King, Compton, Trumble and Chandrasekar14 However, the SPB process geometry involving extremely negative rake angles results in imposition of high surface strains (i.e., ε > 8), significantly higher than the strain resultant in conventional machining processes (i.e., ε ∼ 2). Furthermore, this deformation geometry enables the characterization of material flow using a noncontact technique, digital image correlation (DIC). It is anticipated that deploying a combination of extreme rake angles and DIC will reveal the deformation behavior of materials in extreme strains. Toward this, prior experimentation has looked at the effect of extreme rake angles on material behavior by SPB.Reference Guo, Compton and Chandrasekar8,Reference Mahato, Guo, Sundaram and Chandrasekar15 These studies were instrumental in identification of unforeseen fluid-like flow behavior in metallic systems at extreme strains. However, questions remain regarding underpinnings of these flow characteristics with concomitant evolution of microstructures at severe strains.
Seeking to understand the aforementioned underpinnings of S2PD, here we delineate the evolution of crystallographic textures in the processed subsurface in SPB of oxygen-free high conductivity copper (OFHC Cu). Crystallographic textures refer to the distribution of orientations in a polycrystalline microstructure and are characterized using the orientation distribution function (ODF). In turn, the integral of the ODF or f(g)dg represents the fractional volume in the polycrystal that features grains in close vicinity of the orientation g in the Euler space. While the evolution of crystallographic textures has received considerable attention in conventional SPD processes, such as equal channel angular processingReference Beyerlein and Tóth16,Reference Gu, Tóth, Arzaghi and Davies17 and large strain extrusion machining,Reference Basu and Ravi Shankar18,Reference Sagapuram, Efe, Moscoso, Chandrasekar and Trumble19 its dependence on the imposed heterogeneous thermomechanics during S2PD is not well understood, along with the mechanics of interaction of microstructural features such as grain boundaries and dislocations. This knowledge gap precludes generation of controlled gradients in crystallographic textures during S2PD and is further complicated by process specific deformation fields. Herein, a phenomenological framework is proposed to predict the mechanics of texture and microstructure evolution in SPB.
II. EXPERIMENT
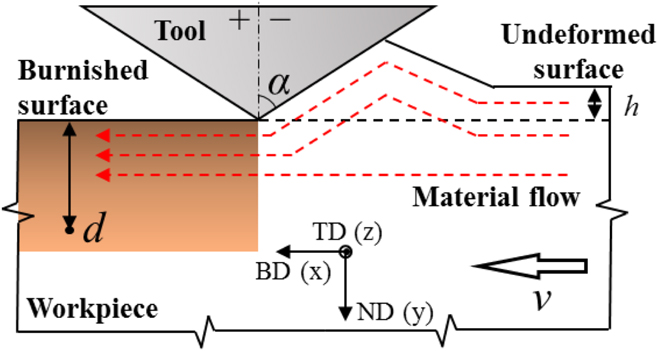
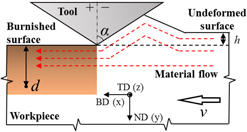
To understand the evolution of the surficial deformation field and microstructural state, orthogonal SPB was performed on OFHC Cu under plane strain conditions. These conditions were ensured by deploying a specimen thickness >10 times the depth of engagement, as illustrated in Fig. 1. The experimental configuration includes a tool steel wedge-shaped burnishing tool and an OFHC Cu workpiece. Both rake and flank faces of the burnishing tool were ground to produce an edge radius less than 10 μm. OFHC Cu workpieces with dimensions of 5 × 50 × 20 mm were annealed at 600 °C for 2 h to yield an average grain size of 20 μm and grain aspect ratio of ∼0.3. Controllable processing parameters included wedge engagement depth (h), burnishing rate (v), and incident wedge angle (α). In this work, experiments with α = [−20°, −40°, −60°] were implemented, wherein h was set within the range of 100–150 μm and v was set at 0.1 mm/s. Subsequent discussion of the process mechanics is with respect to the coordinate system defined by the burnishing direction (BD), the normal direction (ND), and the transverse direction (TD) as shown in Fig. 1.
Schematic representation of the wedge-based burnishing configuration.

To quantitatively analyze the deformation, the workpiece response during SPB was recorded in situ using a high speed PCO DIMAX (PCO, Kelheim, Germany) camera coupled with a Navitar Zoom 6000 optical lens assembly (Navitar, Rochester, New York). The overall imaged field was 2000 × 2000 pixels with a spatial resolution of 1.57 μm/pixel. The resulting images were analyzed using DIC, a correlation-based image analysis technique for obtaining high-resolution displacement fields. Asperities for DIC-based image tracking were introduced onto the workpiece surfaces prior to SPB by abrasion with 600 grit SiC pads. Local velocity vectors per pair of consecutive images with the subpixel accuracy were calculated via an iterative Newton–Raphson algorithmReference Bruck, McNeill, Sutton and Peters20 with the initial guess based on fast Fourier transform correlation. Direct spatial differentiation of the velocity field provided the strain-rate tensor 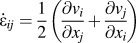 ${\dot{\varepsilon }_{ij}} = {1 \over 2}\left( {{{\partial {v_i}} \over {\partial {x_j}}} + {{\partial {v_j}} \over {\partial {x_i}}}} \right)$. A localized smoothing technique in the sense of linear least squares fitting was adopted to increase the accuracy of the measured fields.Reference Lava, Cooreman and Debruyne21 The resulting effective strain field was generated by temporal integration of local incremental strain fields along path lines, which is given by
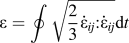 $\varepsilon = \oint {\sqrt {{2 \over 3}{{\dot{\varepsilon }}_{ij}}{\rm{:}}{{\dot{\varepsilon }}_{ij}}} } {\rm{d}}t$. A relative error of less than 0.01 was found for the measured displacement and velocity field by evaluation of simulated displacements of real marker fields. Correspondingly, a total strain measurement error of 0.1 was found for the images obtained.
The surface and subsurface microstructure of pre- and post-deformed workpieces were characterized by electron backscatter diffraction-based orientation image microscopy (OIM) on a Mira Tescan 3 thermal field emission scanning electron microscope (Tescan, Brno, Czech Republic) equipped with an EDAX TSL EBSD detector. The surface was prepared by traditional mechanical polishing down to a 0.05 µm finish using colloidal silica suspension and subsequent vibratory polishing with a VibroMet 2 unit (Buehler, Lake Bluff, Illinois) for ∼30 min. The accelerating voltage used during SEM-based characterization was 25 KV with scan steps ranging from 0.08 to 1 µm. Surface crystallographic textures were extracted from the discrete OIM data using MATLAB-based software MTEX.
Numerical simulation of the crystallographic texture evolution was conducted using a FORTRAN implemented framework of the visco-plastic self-consistent (VPSC) model.Reference Lebensohn and Tomé22 The VPSC model treats each grain as a visco-plastic inclusion in a homogeneous effective medium and updates the mechanical state of the medium self-consistently at each simulation step. Herein, the framework relies on the deformation history in the form of the velocity gradient  ${L_{ij}} = {{\partial {v_i}} \over {\partial {x_j}}}$, which is obtained from the DIC-based characterization of material flow. In addition, performance of the VPSC framework in simulating evolution of crystallographic textures depends on the pristine texture. This was represented by 2000 discrete orientations extracted from the OIM data of the predeformed annealed Cu specimen. Validation of the simulated textures was facilitated by comparison with the measured textures extracted from post SPB OIM. The ODF was quantified by the texture index
 $T = \int {{f_{\exp }}^2{\rm{d}}g}$ and the normalized texture index
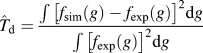 ${\hat{T}_{\rm{d}}} = {{\int {{{\left[ {{f_{{\rm{sim}}}}\left( g \right) - {f_{\exp }}\left( g \right)} \right]}^2}} {\rm{d}}g} \over {\int {{{\left[ {{f_{\exp }}\left( g \right)} \right]}^2}} {\rm{d}}g}}$, where g refers to the local orientation in the Euler space (φ1, Φ, φ2).Reference Li, Beyerlein, Necker, Alexander and Bourke23
III. RESULTS
A. In situ characterization of deformation fields
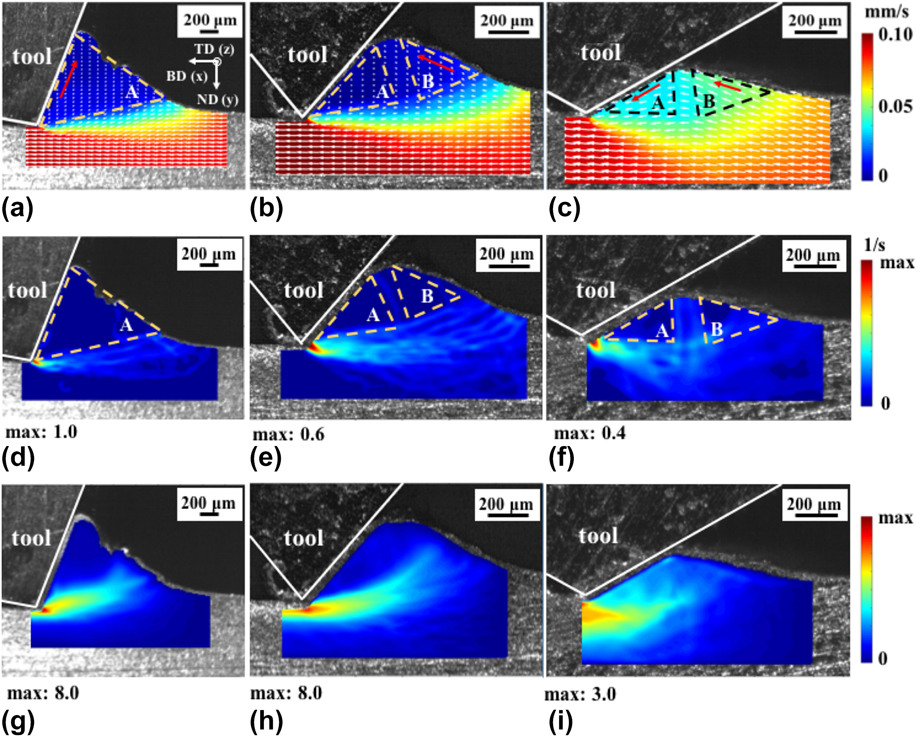
The velocity fields resulting from deformation imposed during SPB were characterized using DIC of motion of asperities on the workpiece surface. Subsequently, the effective strain rate fields were extracted from these velocity fields as  $\overline {\dot{\varepsilon }} = \sqrt {{2 \over 3}{{\dot{\varepsilon }}_{ij}}{\rm{:}}{{\dot{\varepsilon }}_{ij}}}$. Figures 2(a)–2(f) show these velocity and effective strain rate fields, characterized within a finite time interval of 0.1 s. Herein, Fig. 2(a) shows the material flow for α = −20°, where the material in region A flowed along the face of the wedge-shaped tool at a constant rate of 0.01 mm/s. The primary shear zone extending from the tip of the wedge to the free surface as shown in Fig. 2(d) exhibited a peak strain rate of
 $\overline {\dot{\varepsilon }}$ ∼ 1.0 s−1. From the corresponding effective strain field of Fig. 2(g), it was seen that deformation in region A was negligible (
 $\overline {\dot{\varepsilon }}$ < 5% peak strain rate) and the material within a zone ahead of the tool and in the subsurface dominantly accommodated the aforementioned deformation. At wedge angle α = −40°, as in Fig. 2(b), the deformation field was markedly different. For this condition, two distinct regions were observed: (i) a triangular region of stagnated material flow (region A) with v ∼ 0 mm/s anchored to the tool face and (ii) a region of material flow (region B) abutting the stagnated material flow region A and moving with velocity v ∼ 0.015 mm/s. The formation of the dead zone ahead of the tool, i.e., region A, resulted in a modified effective shape to the wedge on the plastic field, with a more negative effective inclination angle of α ∼ −75°. Nonetheless, the morphology and shape of the primary shear zone was similar as that occurring above at α = −20°, with a peak strain rate of
 $\overline {\dot{\varepsilon }}$ ∼ 0.6 s−1 observed in Fig. 2(e). Formation of stagnant material zones has been observed before during SPB involving negative rake angles.Reference Fang24
DIC-obtained velocity fields overlapped on images of the wedge-based surface deformation process with the incident wedge angle of (a) −20°, (b) −40°, and (c) −60°. Direction of white arrows indicates the magnitude and direction of the local velocity vector. Red arrows indicate the average velocity direction in localized regions. Effective strain rate fields (d)–(f) and effective strain fields (g)–(i) for incident wedge angles of −20°, −40°, and −60°, respectively.

At a wedge angle of α = −60° shown in Fig. 2(c), there is a clear absence of material stagnation in the flow field. A relatively stable prow of the material forms ahead of the wedge and propagates in a wave-like manner toward the tool (see movie in the Supplementary Material). Herein, it was realized that the material in the surface left in the wake of the tool after SPB originated from a zone near the surface of the pristine workpiece. Furthermore, this material followed a path of continuous flow through regions B and A in Fig. 2(c) with velocities of 0.055 mm/s and 0.040 mm/s, respectively. A peak strain rate of  $\overline {\dot{\varepsilon }}$ ∼ 0.4 s−1 was observed in this process, as shown in Fig. 2(f). A secondary shear zone located at the interface between regions A and B aligned along ND in the stable prow was observed with the material in this region exhibiting a strain rate of
 $\overline {\dot{\varepsilon }}$ ∼ 0.15 s−1. The resulting strain fields for each of these experimental conditions are shown in Figs. 2(g)–2(i), respectively.
The temporal evolution of Lagrangian strain tensor components in the material in the vicinity of the surface treated by SPB is shown in Fig. 3(a). It is evident from this figure that simple shear deformation dominates the surface. In this regard, the shear strain rate  $\left( {{{\dot{\varepsilon }}_{xy}}} \right)$ field exhibited large maxima in magnitude compared to that of normal components (
 ${\dot{\varepsilon }_{xx}}$,
 ${\dot{\varepsilon }_{yy}}$). This is shown in Fig. 3(a) where maximum shear strain rates with α = [−20°, −40°, −60°] were max(
 ${\dot{\varepsilon }_{xy}}$) = [0.45 s−1, 0.36 s−1, 0.37 s−1], respectively. Nonetheless, a decrease in rake angles to more negative values resulted in a proportionally larger strain rate component along ND and BD in comparison to the aforementioned shear component. Here, a max(
 ${\dot{\varepsilon }_{xx}}$,
 ${\dot{\varepsilon }_{yy}}$) = [0.29 s−1, 0.18 s−1, 0.22 s−1] was seen for α = [−20°, −40°, −60°], respectively. Prior investigations have shown that such characteristics of deformation strongly influence the rate and characteristics of microstructure evolution during SPD.Reference Basu, Wang, Liu and Saldana13,Reference Basu and Ravi Shankar18,Reference Saldana, Basu, Wang and Woodruff25 In this regard, consequences of this effect are discussed in the forthcoming sections.
(a) Evolution of Lagrangian strain-rate tensor components  $\left( {{{\dot{\varepsilon }}_{ij}}} \right)$ with respect to the time elapsed. (b) Variation of strain with the normalized depth (d/h) from the deformed material surface.

Effective strain fields in the subsurface region were calculated by integrating effective strain rates along path lines characterized using DIC. The effect of the incident wedge angle on subsurface straining is summarized in Fig. 3(b), wherein the deformation levels in the work subsurface were normalized by the engagement depth (d/h). The spatial distribution of strain was fitted empirically in the form of ε = c 1 exp(c 2d/h), where c 1 is the residual plastic strain imposed at the work surface and c 2 is a constant indicating rate of decrease in strain with respect to subsurface depth. The exponential form of this trend was motivated from prior work involving machining of brass.Reference Guo, Saldana, Dale Compton and Chandrasekar3 In this regard, c 1 ∼ [6.6, 8.3, 2.5] and c 2 = [−2.1, −1.9, −0.5] were found for the incident wedge angles of α = [−20°, −40°, −60°], respectively. The lower values of c 1 and c 2 for α = −60°, compared with those for α = −20° and α = −40° indicate a change in material behavior at extremely negative rake angles during SPB. Microstructural underpinnings of the same are delineated in the forthcoming sections.
B. Surface microstructural characterization
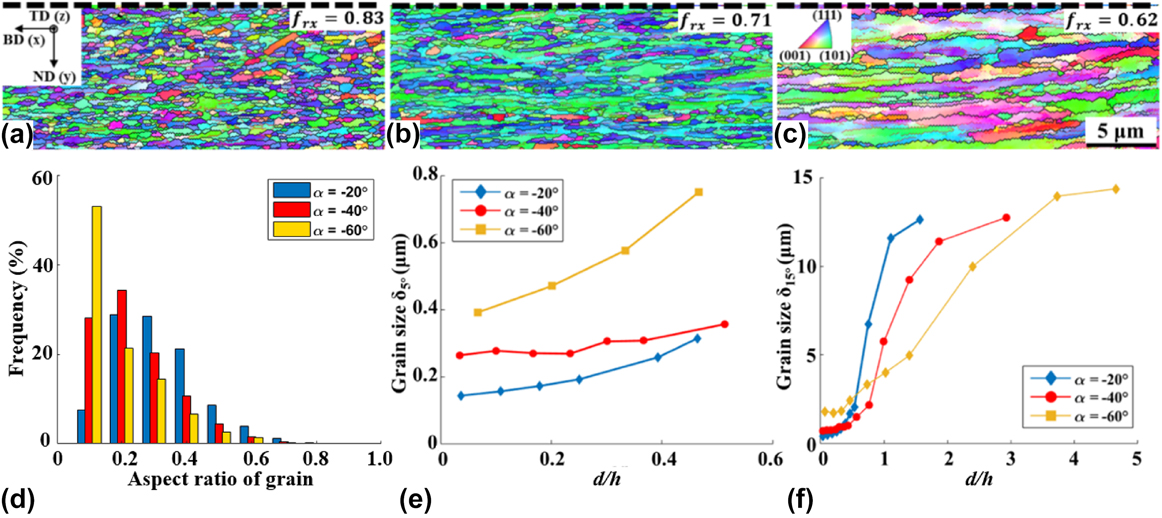
Figures 4(a)–4(c) show OIM of microstructures characterized near the surface, i.e., d/h ∼ 0, after wedge-based SPB with α = [−20°, −40°, −60°], respectively. For a wedge angle of α = −20°, which corresponded to (ε,  $\overline {\dot{\varepsilon }}$) ∼ (6.6, 1.0 s−1), moderately elongated UFGs parallel to the BD were formed with δ5° ∼ 0.15 μm. Here, δ5° refers to the average size of grains surrounded by boundaries with a misorientation angle of θ > 5°. At a more negative wedge angle of α = −40°, which corresponded to (ε,
 $\overline {\dot{\varepsilon }}$) ∼ (8.3, 0.6 s−1), nanoscale grains elongated along BD with δ5° ∼ 0.25 μm were observed. For α = −60°, progressively less refinement was observed due to moderate straining with (ε,
 $\overline {\dot{\varepsilon }}$) ∼ (2.5, 0.4 s−1), with elongated grains featuring δ5° ∼ 0.39 μm. Here, larger grain sizes were also accompanied by grain aspect ratios with increasing deviation from unity at more negative incident wedge angles [Fig. 4(d)]. The variation in average grain sizes (i.e., δ5° and δ15°) with respect to normalized depth of engagement d/h from the burnished surface was characterized by OIM and is summarized in Figs. 4(e) and 4(f). The average grain size increased monotonically with increasing depth, with a minimum grain size occurring near the SPB treated surface. In this regard, the increase in both δ5° and δ15° deeper into the subsurface is consistent with the measured deformation gradient as shown in Fig. 3(b), exhibiting
 ${{\partial \varepsilon } \over {\partial \left( {{d / h}} \right)}} \lt 0$. Herein, decreasing maximum values of
 ${{\partial \delta } \over {\partial \left( {{d / h}} \right)}} = \left[ {18.5,\;8.7,\;3.4} \right]$ were determined for α = [−20°, −40°, −60°]. From grain size data, the thickness of the deformed layer was approximated as d/h = [1.9, 3.0, 4.8] for α = [−20°, −40°, −60°], respectively.
OIM images of the subsurface microstructure on the TD plane close to the burnished surface (d ∼ 3–14 µm) with incident wedge angles of (a) −20°, (b) −40°, and (c) −60°. Black dashed lines indicate the location of the processed surface. (d) Corresponding statistical distribution of grain aspect ratio. Variation of grain size with respect to the normalized depth (d/h) from the processed surface, defined by (e) >5° misorientation, δ5°, and (f) >15° misorientation, δ15°.

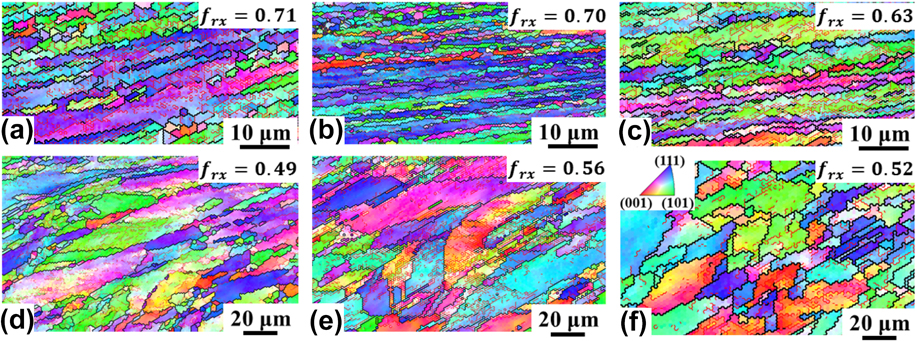
The progression of recrystallization during SPB was characterized as the fraction of high angle grain boundaries (HAGBs) in terms of boundary length as f rx = l HABG/(l HABG + l LAGB). Here, l HABG and l LAGB are lengths of high (θ > 15°) and low (15° > θ > 2°) angle grain boundaries, respectively. This fraction assumes a high value f rx ∼ 1 at the commencement of recrystallization when low angle dislocation boundaries characterized by 15° > θ > 2° are annihilated. In this regard, high recrystallization fractions have been seen as a consequence of continuous dynamic recrystallization (CDRX) during SPD and S2PD processes.Reference Hughes and Hansen26 Furthermore, a monotonically increasing relationship has been observed between parameter f rx and imposed effective strains ε during machining-based SPD of OFHC Cu.Reference Abolghasem, Basu and Shankar27 The recrystallization fractions in our SPB experiments for α = [−20°, −40°, −60°] were f rx = [0.83, 0.71, 0.62], respectively, at a normalized depth d/h = 0. The corresponding levels of imposed effective strains were ε = [6.6, 8.3, 2.5]. These values evolved to f rx = [0.71, 0.70, 0.63] and f rx = [0.49, 0.56, 0.52] at normalized depths of d/h = [0.5, 0.4, 0.5] and d/h = [1.1, 1.5, 3.0] as in Figs. 5(a)–5(c) and 5(d)–5(f), respectively. Empirically characterized effective strains at these depths were ε = [2.3, 3.9, 2.0] and ε = [0.7, 0.5, 0.6], respectively. A high recrystallization fraction of f rx = 0.83 at ε = 6.6, along with nearly equiaxed grain morphologies during SPB with α = −20° indicates the onset and near commencement of CDRX. However, this trend was not observed in samples processed using SPB with more negative rake angles. The surface left in the wake of the tool during SPB with α = −40° featured a smaller recrystallization fraction of f rx = 0.71, despite featuring a larger strain of ε = 8.3. This anomaly is analyzed in the forthcoming sections.
OIM of the microstructure at normalized depth (d/h) with incident wedge angle (a) d/h = 0.5, α = −20°; (b) d/h = 0.4, α = −40°; (c) d/h = 0.5, α = −60°; (d) d/h = 1.1, α = −20°; (e) d/h = 1.5, α = −40°; and (f) d/h = 3.0, α = −60°. Red lines and black lines demarcate boundaries featuring disorientation θ > 2° and θ > 15°, respectively.

C. Surface crystallographic texture
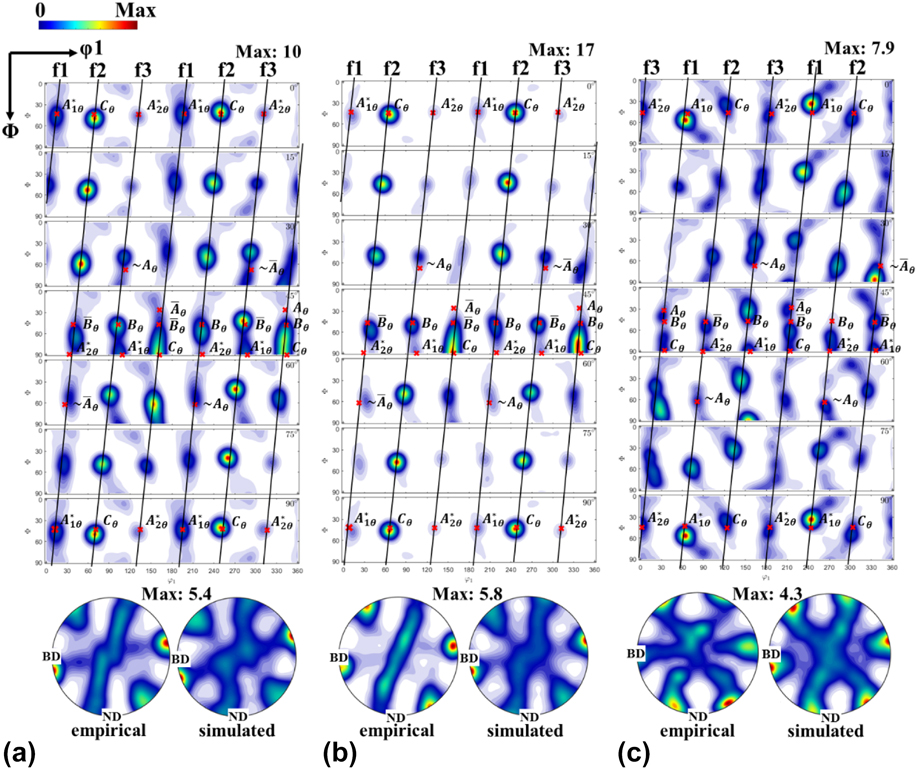
Figure 6 shows the OIM-characterized sections of the ODF featuring φ2 = {0°, 15°, 30°, 45°, 60°, 75°, 90°}. These sections were characterized from the material in the vicinity of the surface left after SPB and exhibited three dominant fibers outlined in solid black lines in Fig. 6. Comparison with shear-based processes such as machiningReference Basu and Ravi Shankar18 and plane strain compressionReference Basu, Wang and Saldana28 indicated a similar evolution of crystallographic textures in SPB. Herein, textures obtained from surfaces treated by SPB with α = [−20°, −40°] exhibited high concentrations along fibers in close vicinity with respect to f1, f2, and f3 fibers that evolve in simple shear. The f1 fiber is composed of the {111} partial fiber and starts at the  $A_{1\theta }^ *$ component, passes through
 ${{{A_\theta }} / {{{\bar{A}}_\theta }}}$ and ends at the
 $A_{2\theta }^ *$ component. The f2 fiber constitutes both {111} and 〈110〉 partial fibers, wherein the {111} partial fiber starts from C θ, passes through
 ${{{B_\theta }} / {{{\bar{B}}_\theta }}}$ and ends at
 ${{{A_\theta }} / {{{\bar{A}}_\theta }}}$. The 〈110〉 partial fiber starts at
 ${{{A_\theta }} / {{{\bar{A}}_\theta }}}$ and ends at
 $A_{1\theta }^ *$. The f3 fiber is symmetrical with respect to the f2 fiber and is composed of the C θ,
 ${{{B_\theta }} / {{{\bar{B}}_\theta }}}$, and
 ${{{A_\theta }} / {{{\bar{A}}_\theta }}}$ in the 〈110〉 partial fiber and the
 ${{{A_\theta }} / {{{\bar{A}}_\theta }}}$ and
 $A_{2\theta }^ *$ in the {111} partial fiber. The locations of each ideal component are summarized in Table I. The C θ component exhibited the largest strength in these fibers, featuring
 $f\left( {{g_{{C_\theta }}}} \right) = \left[ {10,\;17} \right]$ after SPB with α = [−20°, −40°], these featuring surficial strains ε = [6.6, 8.3], respectively. In this regard, the parameter
 $\max \left\{ {f\left( {{g_{{C_\theta }}}} \right)} \right\}$ exhibits a monotonic relationship with respect to effective strains imposed on the surface as seen in simple shear based processing. The pole figures shown in Fig. 6 also corroborated this similarity. By contrast, textures produced in the material treated with SPB featuring α = −60° exhibited fibers that shared a strong resemblance with plane strain compression (i.e., rollingReference Polkowski, Jóźwik, Polański and Bojar29). Reasons behind this deviation at α = −60° with respect to α = [−20°, −40°] are discussed in Sec. IV.
The empirical obtained ODFs and (111) pole figures with (a) α = −20°, (b) α = −40°, and (c) α = −60°. The simulated textures were predicted using the DIC + VPSC framework. Black dashed lines indicate the partial fiber and red crosses indicate the ideal shear texture components in the FCC material.

The ideal orientations of shear textures undergoing burnishing processes in Cu.

IV. DISCUSSION
A comparison of empirically characterized microstructures and quantified deformation fields of SPB indicate the presence of process anomalies. These anomalies encapsulated nonmonotonic fluctuations in imposed effective strains with respect to SPB process variable α. Furthermore, the fractional recrystallization content f rx in microstructures left in the surface in the wake of the tool exhibited a nonmonotonic variation with respect to imposed effective strains. This behavior is in contrast with prior observations made in OFHC Cu in comparable deformation geometries, wherein monotonic relationships between f rx and imposed effective strains were seen. The forthcoming sections attempt to delineate these anomalies.
A. Mechanics and microstructure evolution in S2PD
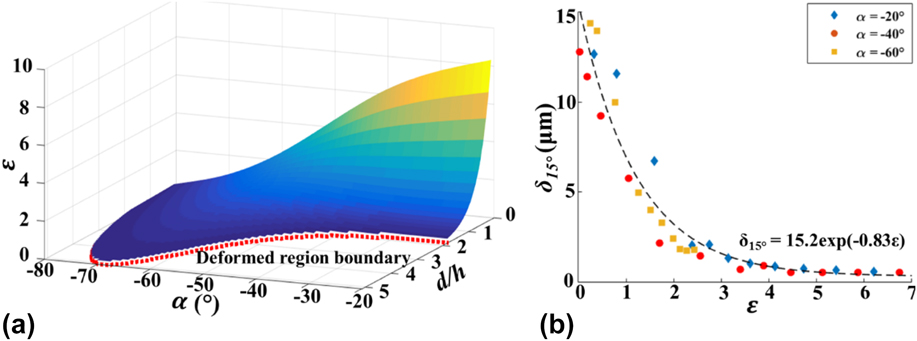
Understanding the correlation between subsurface deformation levels and process parameters is critical for a generalized framework for predicting the resulting surface and subsurface microstructure. From the data of the present study, a response surface was mapped and is shown in Fig. 7(a), which relates strain levels to incident wedge angle and normalized subsurface depth. As shown in the figure, less negative incident wedge angles tend to induce higher peak subsurface strains up to ε ∼ 8 at the work surface, while also producing smaller deformed subsurface layers. By contrast, more negative incident wedge angles exhibit the opposite effect with a maximum normalized deformed layer thickness of 5 for α ∼ −70°. This mapping of subsurface deformation mechanics provides a generalizable framework for selecting S2PD parameters to achieve specific deformation levels and subsurface strain distributions.
(a) Effective strain field induced by the surface deformation process with respect to the incident wedge angle (α) and normalized subsurface depth (d/h). The red dashed line indicates the boundary of the deformed region within the strain threshold of ε > 0.2. (b) The variance of grain size with respect to effective strain.

The microstructure of polycrystalline metallic systems evolves with the interplay of dislocation and twinning during imposition of severe strains. The correlation between average grain size and the imposed plastic strain in the surface/subsurface across the range of incident wedge angles is shown in Fig. 7(b). From the figure, the grain size decreased exponentially with respect to increasing strain with the relationship δ15° = 15.2 × e−0.83×ε. At near ambient temperatures, consequences of this interplay, viz. fragmentation and concomitant generation of new domains surrounded by HAGBs can be classified in CDRX or geometric dynamic recrystallization (GDRX) processes. CDRX involves the progressive fragmentation of grains by the formation and consolidation of dislocation cell structures. These structures feature differential disorientations with respect to their neighbors. Upon accumulative straining, these disorientations grow in magnitude through the plastic rotation of their respective lattice orientations. On the other hand, GDRX involves shear-based pancaking of grains with concomitant serration of grain boundaries. When the serrations in facing boundaries of the grain approach each other in close proximity, the original grain pinches off into several offspring grains, thereby resulting in fragmentation. Both CDRX and GDRX have been observed during shear-based surface generation by machining. In this regard, their presence in SPB indicates similarities in the mechanics governing material response across machining and burnishing.
The mechanics of the material response as described above is mediated by the imposed deformation during the advancement of the wedge tool. This boundary condition naturally results in generation of large cutting and thrust forces on the material that exists in the vicinity of the tool along its path of travel.Reference Findley and Reed30 The components of these forces along the shear plane administering the primary deformation zone result in a dislocation-based material response culminating in CDRX and GDRX. Herein, this response has been encapsulated in a phenomenological framework that prescribes a monotonic exponential growth of the recrystallization fraction (i.e., f rx) with respect to imposed effective strains ε. In this regard, the non-negligible decrease of f rx = 0.83 for α = −20° and ε = 6.6 to f rx = 0.71 for α = −40° and ε = 8.3 is indicative of an anomalous deviation in the mechanics of material response across the two conditions in the present SPB experiments. This behavior indicates lower levels of continuous recrystallization despite imposition of larger strains during SPB at extremely negative rake angles.
Sources of the aforementioned anomaly in SPB can be found in evolution of the dynamics of machining at comparable process parameters. Progressively negative rake angles have been shown to instigate the generation of larger thrust forces at the expense of smaller cutting forces during machining and SPB. At very negative rake angles, this effect will naturally result in smaller resolved shear forces along the aforementioned shear plane, wherein it is anticipated that the rate of microstructure evolution as described in the previous paragraph will be subdued. This hypothesis was tested by characterization of the Lagrangian strain tensor field under the surface undergoing SPB with α = −60° with measured strain components of (εxy, εxx, εyy) = (1.8, 0.7, −0.4) indicating significantly larger normal strains in comparison with shear strains. By contrast, experimental conditions of α = −20° and α = −40° resulted in tensor components of (εxy, εxx, εyy) = (6.0, 1.1, −0.5) and (εxy, εxx, εyy) = (5.3, 0.8, −0.3), respectively. In this regard, we also note that plane strain compression has been shown to result in a smaller rate of lattice rotation at comparable effective strain rates, in contrast with deformation by simple shear.Reference Basu, Wang and Saldana28 The net effect of these phenomena is an apparent decrease in the recrystallization fraction despite larger strains resulting from the process configuration involving more negative α. The observation that  ${{\partial {f_{{\rm{rx}}}}} \over {\partial \varepsilon }} \lt 0$ over the processing space explored in the present study is suggestive of fundamental processing limits on recrystallized microstructures achievable through shear-based surface generation in machining and SPB depending on the nature of the mechanics imposed. This aspect will be discussed in the forthcoming sections.
B. Evolution of surface crystallographic texture
The visco-plastic self-consistent framework was used to simulate the evolution of surface and subsurface crystallographic textures during SPB. The framework utilized a simple Voce hardening law and results from the same are shown in Fig. 8. A quantitative examination of the simulated textures with respect to their empirically measured counterparts is summarized in Table II. The index (T) of simulated textures was T = [3.2, 4.9, 2.6] for α = [−20°, −40°, −60°] at d/h ∼ 0, respectively. These values closely matched that of the empirical counterparts obtained from OIM (i.e., T = [3.0, 4.5, 2.5]). This is also confirmed by corresponding values of normalized texture index  ${\hat{T}_{\rm{d}}} = \left[ {0.36,\;0.27,\;0.29} \right]$ for α = [−20°, −40°, −60°], respectively.
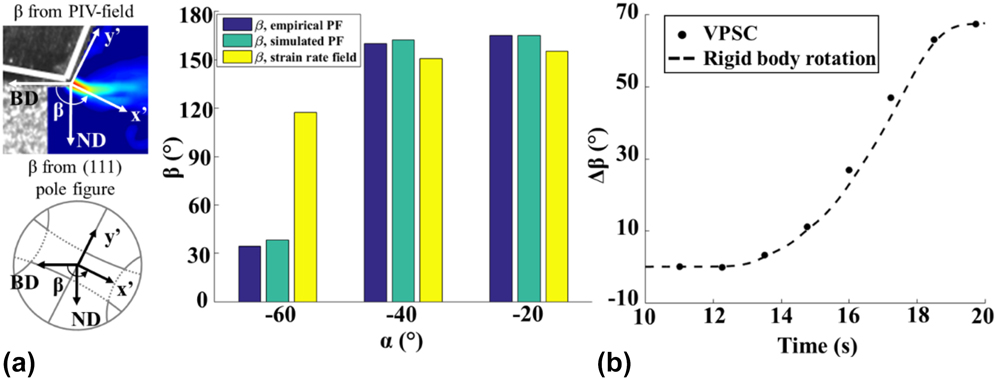
(a) Schematic representation of tilting angle (β) measurement based on (111) pole figure and deformation field and summary of β with respect to the incident wedge angle (α). (b) The change of β (Δβ) with respect to the processing time with α = −60°.

The variation of texture index (T) and normalized texture index  $\left( {{{\hat{T}}_{\rm{d}}}} \right)$ of the experimental and simulated textures with respect to incident wedge angle (α).

As the evolved texture was found to deviate from the ideal positions of shear texture components, rotation of the partial fibers can be observed in Fig. 8. Deformation-based processing techniques based on simple shear have been linked elsewhere to rotated ideal texture components.Reference Beyerlein and Tóth16,Reference Sagapuram, Efe, Moscoso, Chandrasekar and Trumble19 To quantify the presence of such phenomenon in the wedge-based SPB process, the tilt angle (β) of the texture was measured for each processing condition in the present study. As shown in Fig. 8(a), the x′ axis in the x′–y′ coordinate system is defined to be orthogonal to the 〈110〉 fiber and approximately parallel with the shear plane measured in the DIC-obtained deformation fields. The tilt angle was defined as the angle between x′ axis and direction BD. Figure 8(a) summarizes the texture tilt angle as measured from the empirically obtained (111) pole figures, the simulated (111) pole figures, and the effective strain rate field. From the figure, relatively good agreement is seen with the measured and simulated tilt angles for α = [−20°, −40°] in the range of 150°. However, a large difference of ∼75° was observed between the measured/simulated pole figures and the rotation in the strain rate field for α = −60°.
In comparison with α = [−20°, −40°], textures obtained from α = −60° exhibited considerable deviations with respect to crystallographic textures obtained in simple shear-based processing. Sources of this behavior can be traced to corresponding deviations across deformation fields imposed on surfaces treated with SPB with α = [−20°, −40°] and α = −60°, respectively. The former process conditions result in significantly larger contributions to the final microstructure from the simple shear components of the Lagrangian deformation tensor, where  $\left( {{\varepsilon _{xy}},\;\bar{\varepsilon }} \right) = \left( {6.0,\;6.6} \right)$ for α = −20° and
 $\left( {{\varepsilon _{xy}},\;\bar{\varepsilon }} \right) = \left( {5.3,\;8.3} \right)$ for α = −40°. By contrast, the experimental measurements with α = −60° revealed that the normal components of the deformation tensor along BD and ND resulted in (εxx, εyy) = (0.7, −0.4), which accounts for a significantly larger portion of the imposed effective strain,
 $\bar{\varepsilon } = {\rm{2}}{\rm{.5}}$. The differences in the nature of the strain tensor result in the crystallographic textures exhibiting characteristics of plane strain compression (i.e., rolling). These were confirmed in Fig. 8(b). The evolution of the tilt angle (∆β) in the simulated texture is closely matching the rotation angle calculated by strain tensor components.
The above results indicate the limitation of the simple shear assumption for a wedge-based SPB process. These in situ subsurface deformation field measurements revealed that shear and plane compression/tension result in the misalignment between texture orientation and principal shear direction. Similar observations have also been reported in the shear textures produced by ECAE configuration, where the positions of ideal shear texture components are shown to be rotated away from the extrusion direction by 10°–20°.Reference Huang, Chang, Kao and Chang31 In this regard, a better understanding of the interactive effects of shear and compression/tension strain would be of importance to provide accurate texture modeling in SPD configurations. Although decoupling the combined effect of individual strain components in SPB processing is nontrivial, textures produced by plane strain tension alone have been found to be similar to those by simple shear, indicating an accelerated rate of texture development.Reference Gholinia, Bate and Prangnell32 In this research, the overall effective strain level can be effectively used to predict the texture strength, given the linear correlation of texture index (i.e., T = [1.2, 2.6, 3.2, 4.9]) and overall effective strain level (i.e.,  $\bar{\varepsilon } = \left[ {0,\;2.5,\;6.6,\;8.3} \right]$). However, an excessive level of deformation (i.e.,
 $\bar{\varepsilon } > 10$) imposed by multiple passes is expected to result in weaker texture due to the effects of dynamic recrystallization.Reference Beladi, Cizek and Hodgson33
C. Implications on microstructure-tailoring frameworks based on shear-based surface processing
The aforementioned results suggest the presence of fundamental limits on frameworks for tailoring microstructures for endowing fabricated components with enhanced functional characteristics. Traditional deployment of frameworks that have been formulated for simple shear-based surface processing would prescribe more negative rake angles for imposition of larger effective surficial strains. In turn, larger strains would be anticipated to give rise to a larger recrystallization fraction. Herein, an implicit assumption in such frameworks is the dominance of the simple shear component in the Lagrangian strain tensor. However, the current research clearly shows that salient aspects of the deformation field in shear-based surface processing undergo a switchover at extremely negative rake angles. This switchover instigates a dominance of plane strain compression during shear-based surface processing. Consequently, the predictions of simple shear calibrated microstructure-tailoring frameworks, for instance those described in Refs. Reference Brown, Saldana, Murthy, Mann, Guo, Allard, King, Compton, Trumble and Chandrasekar14 and Reference Basu and Ravi Shankar18, require further validation across larger swathes of the thermomechanical space and process configurations.
V. CONCLUSION
In the present work, material response, microstructure, and crystallographic texture were investigated during wedge-based SPB of OFHC Cu with varying incident wedge angles. Larger peak surface plastic strains and deeper affected surficial regions were observed compared to conventional surface generation processes. It was shown that gradient microstructures formed and could be attributed to the heterogeneous deformation levels imposed on the final processed surface and subsurface. Multiple types of microstructures including nanoscale and microscale elongated grains, equiaxed UFG microstructures, and coarsely deformed microcrystalline structures were observed. The controllability of the burnishing process was discussed, this providing a direct guide for generating expected surficial microstructure gradients by the control of burnishing parameters. Crystallographic textures were characterized experimentally using OIM information, which is accompanied by accurate predictions by VPSC coupled with DIC-obtained deformation history. The evolutions of texture under all conditions were evaluated in terms of the texture rotation, offering a scope for the validation of analytical models for texture evolution in S2PD. Deviations between measured and simulated textures were analyzed based on differences in the mechanics of surface generation by SPB that arise due to the imposed processing conditions. Additionally, nonmonotonic evolution of recrystallization fraction with respect to magnitude of the imposed plastic strain was found to be present due to salient differences in the plastic strain tensor. The implications of these results on surface microstructure control frameworks were explained in terms of corresponding effects on strain tensor components in the processed surface and subsurface.
Supplementary Material
To view supplementary material for this article, please visit https://doi.org/10.1557/jmr.2018.58.
ACKNOWLEDGMENTS
This work was supported in part by NSF CMMI 1254818 and Third Wave Systems (via DOE subcontract DE-EE0005762).