In the quest to find suitable rocks that may be used to sequester carbon dioxide (CO2) from natural and/or industrial sources, basalts have emerged as particularly prospective (Schaef et al. Reference Schaef, McGrail and Owen2010). The alteration of basalts, including carbonation, takes place relatively readily, and basalt weathering has been studied in detail (Dessert et al. Reference Dessert, Dupré, Gaillardet, François and Allègre2003; McGrail et al. Reference McGrail, Schaef, Ho, Chien, Dooley and Davidson2006; Oelkers et al. Reference Oelkers, Gislason and Matter2008). Accordingly, basalts may have the potential to sequester CO2 in mineral form rather than simply acting as storage sites for CO2. Advanced initiatives are investigating specific sites in volcanic rocks for CO2 sequestration, including in Iceland (Alfredsson et al. Reference Alfredsson, Hardarson, Franzson and Gislason2008; Gislason et al. Reference Gislason, Wolff-Boenisch, Stefansson, Oelkers, Gunnlaugsson, Sigurdardottir, Sigfusson, Broecker, Matter, Stute, Axelsson and Fridriksson2010), the Deccan basalts, India (Prasad et al. Reference Prasad, Sarma, Sudhakar, Basavaraju, Singh, Begum, Archana, Chavan and Charan2009), the Newark Basin, USA (Matter et al. Reference Matter, Takahashi and Goldberg2007) and the Columbia River basalts, USA (Schaef & McGrail Reference Schaef and McGrail2009; Tollefson Reference Tollefson2013). This strategy assumes sequestration by reaction of CO2 with primary basalt minerals to yield carbonates (especially the magnesium carbonate mineral magnesite). The age of the basalts targeted for sequestration is not a consideration, including rocks about 200 million years old in the Newark Basin (Matter et al. Reference Matter, Takahashi and Goldberg2007).
An alternative perspective considers the role of volcanic rocks in the CO2 budget during and immediately after eruption. CO2 is an important component of volcanic degassing, and models for atmospheric evolution assume that periods of volcanic activity cause an increase in atmospheric CO2 (Frakes et al. Reference Frakes, Francis and Syktus1992). However, there is also potential for freshly erupted volcanic rock to undergo weathering and thereby consume CO2 (Varekamp & Thomas Reference Varekamp and Thomas1998; Dessert et al. Reference Dessert, Dupré, Gaillardet, François and Allègre2003; Berner Reference Berner2006). This fresh new crust is rich in minerals which are relatively unstable at the Earth's surface, and can be altered at a fast rate. The chemical weathering of basalts occur 5–10 times faster than the weathering of granites and gneisses (Dessert et al. Reference Dessert, Dupré, François, Schott, Gaillardet, Chakrapani and Bajpai2001). This is especially likely in warm tropical climates, which experience the most intense chemical weathering. As a general rule, bicarbonate concentrations in run-off water, and hence CO2 consumption by weathering, increase with temperature (Dessert et al. Reference Dessert, Dupré, Gaillardet, François and Allègre2003). Thus, basalts in a hot climate have the potential for substantial CO2 drawdown.
Quantitative estimates of CO2 sequestration that might be possible in large basaltic provinces today have been determined (Dessert et al. Reference Dessert, Dupré, Gaillardet, François and Allègre2003). However, there are no measurements of natural drawdown into basalts from the geological record for comparison. The optimum combination for drawdown, of voluminous continental volcanic activity and warm climate, was in the Devonian period (Frakes et al. Reference Frakes, Francis and Syktus1992) when the atmosphere was CO2-rich (Berner Reference Berner2006).
1. Lower Devonian lavas in the British Isles
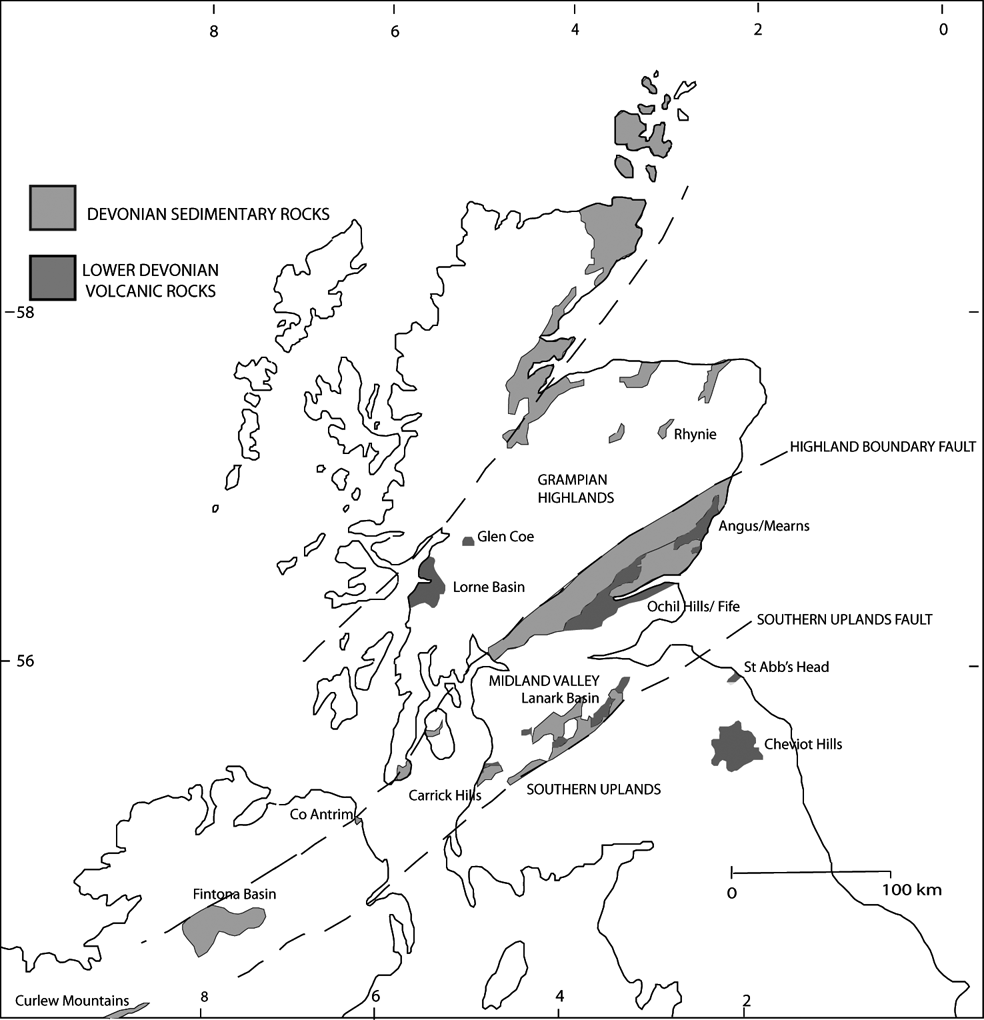
This study reports data from Lower Devonian volcanic rocks in the northern British Isles. Several outcrops of basaltic and andesitic lavas occur in Scotland, northern England, Northern Ireland, and the Republic of Ireland (Fig. 1). The lavas were deposited in a terrestrial environment, inter-bedded with sandstones and conglomerates in successions of ‘Old Red Sandstone’. The conglomerate beds contain abundant clasts of the lavas. The outcrops were probably once part of a continuous expanse of subaerial volcanic rocks that extended across the major lineaments of the Highland Boundary Fault and Southern Uplands Fault (Trench & Haughton Reference Trench and Haughton1990; Browne et al. Reference Browne, Smith and Aitken2002), and occupied at least 100,000 sq. km (Reference Alfredsson, Hardarson, Franzson and GislasonFig. 1). Their cumulative thickness varies from <100 m up to 2.5 km in central Scotland. The volcanic activity has been related to subduction on the northwest margin of the Iapetus Ocean (Thirlwall Reference Thirlwall, Harris and Fettes1988). The lavas in this setting are typically andesitic, and in such lavas the primary volatile component has a high H2O/CO2 ratio. The palaeolatitude of northern Britain in the lower Devonian was near-equatorial, and the climate was tropical: Lower Devonian temperatures were in the range of 30–35°C (Joachimski et al. Reference Joachimski, Breisig, Buggisch, Talent, Mawson, Gereke, Morrow, Day and Weddige2009).
Map of northern British Isles showing Lower Devonian volcanic outcrops and sampling localities.

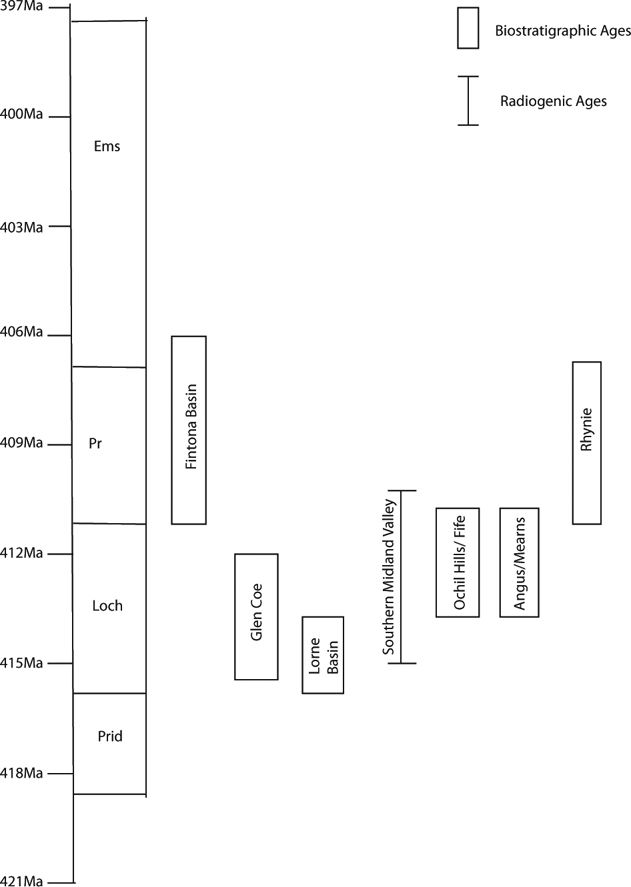
The dating of the lavas is possible through radiometric dating of the lavas themselves, and through spore zonation of accompanying terrestrial sedimentary rocks. In some cases, a specific Lower Devonian stage can be determined (Fig. 2), but in the Curlew Mountains (Graham & Clayton Reference Graham, Clayton, McMillan, Embry and Glass1988) and the St. Abbs and Cheviots (Stephenson Reference Stephenson, Stephenson, Bevins, Millward, Highton, Parsons, Stone and Wadsworth1999) regions, only a broad Lower Devonian age can be attributed. The spore-defined ages are mostly in the Lochkovian–Pragian stages (Fig. 2). Where lavas are dated radiometrically, the dates obtained are broadly consistent with the palynological ages. In Fife/Angus, dating was possible by both methods, and is mutually consistent (Browne Reference Browne, Stephenson, Bevins, Millward, Highton, Parsons, Stone and Wadsworth1999). A review of the stratigraphy of Devonian volcanism in northern Britain (Smith Reference Smith, Stephenson, Bevins, Millward, Highton, Parsons, Stone and Wadsworth1999) similarly concludes that activity was focused in the Lochkovian.
Age ranges for lava-bearing Lower Devonian sequences, determined from spore and radiometric dating. Integration of spore and radiometric dating from Mark et al. (Reference Mark, Rice, Fallick, Trewin, Lee, Boyce and Lee2011), using timescale of Gradstein et al. (Reference Gradstein, Ogg and Smith2005).

The lava outcrops show a remarkable degree of similarity, including brecciation of lava flow surfaces, high vesicularity, and widespread reddening. They are typically the products of pāhoehoe flow-fields, forming units of up to 10m thickness, generally of the compound type, with individual pāhoehoe toes being in the range of 10–50 cm thick (Hole et al. Reference Hole, Jolley, Hartley, Leleu, John and Ball2013). These are interbedded with sedimentary rocks, some of which were deposited in minor lakes on top of the developing flow-fields. In general, compound pāhoehoe flow fields frequently develop pervasive weathered profiles, partly as a result of their vesicularity, but also because of the large surface area/volume ratio offered by their low aspect ratio (Self et al. Reference Self, Keszthelyi and Thordarson1998; Hole et al. Reference Hole, Jolley, Hartley, Leleu, John and Ball2013). Comparison with modern analogies suggests that the development of weathered profiles, and indeed the development of soil horizons, takes place in a matter of a few tens of thousands of years (Jolley et al. Reference Jolley, Passey, Hole and Millett2012). Weathering of the full thickness of pāhoehoe can occur because of vesicularity, and fracture permeability and, in many cases, the reddening is observed to extend a metre below the flow top.
The lavas typically show intermixing with sediments, including the penetration of sediment veins. In many cases, the magma is inferred to have been emplaced at a shallow level (<10 m) within unconsolidated sediments, rather than at the very surface (Kokelaar Reference Kokelaar1982; Smith Reference Smith1995, Reference Smith, Stephenson, Bevins, Millward, Highton, Parsons, Stone and Wadsworth1999; Moore & Kokelaar Reference Moore and Kokelaar1998; Trewin & Thirlwall Reference Trewin, Thirlwall and Trewin2002). However, our observations suggest that these features developed at the base of lava flows. A detailed assessment of lava-sediment interaction in the Lower Devonian is given in Hole et al. (Reference Hole, Jolley, Hartley, Leleu, John and Ball2013). Pāhoehoe flow fields are punctuated and not continuous, such that during periods of no effusion, lakes develop on top of the flow-field, and fine-grain laminated sand and mud, some of which may be transported by aeolian processes, accumulates in the lakes. Resumption of effusive volcanism, before the sediment has lithified, and whilst it still contains significant pore-water, allows lava–sediment interaction to take place. Interaction occurs commonly at the base of individual pāhoehoe lobes, forming “peperite domains” with increasing sediment-to-lava ratio downwards from the base of the flow lobe (Skilling et al. Reference Skilling, White and Mcphie2002; Hole et al. Reference Hole, Jolley, Hartley, Leleu, John and Ball2013). In some cases, where sediment has undergone surface desiccation, lava lobes are unable to penetrate the desiccated sediment surface because the sediment no longer behaves as a viscous medium. However, where pore waters are still present at depth in the sediment pile (depths of only a few tens of centimetres), localised lateral and downwards invasion of lava into the wet sediment may occur. The outcrop expression of this phenomenon is the presence of a peperite domain on the upper surface of a lava lobe, with undisturbed sedimentary rocks resting directly on the peperite. This generic process is known from a number of localities worldwide, and the term “invasive lava flow” has been widely used in the literature, particular with respect to the Columbia River Basalt Province (e.g., Mangan et al. Reference Mangan, Wright, Swanson and Byerly1989; Ross Reference Ross1989; Reidel Reference Reidel2005). The key point here is that whilst the lava is invasive, it is not intrusive, meaning that the invasion took place as a result of a subaerial lava flow locally penetrating wet sediment. Consequently, even when invasive lava flows are present, lateral stratigraphical correlations show that the flow unit is dominantly subaerial.
The lavas were oxidised, and many flows are coloured red, purple or brown due to the alteration of iron minerals to haematite. The occurrence of fresh black lavas and red altered lavas in the same succession, and the co-occurrence of fresh and altered clasts of lava in conglomerates, both show that weathering was contemporaneous. Weathering of the lavas is also evident in the clay mineralogy of inter-bedded sedimentary units (Wilson Reference Wilson1971), and in a remanent magnetisation from low-temperature alteration of magnetic iron oxides (Storetvedt et al. Reference Storetvedt, Abranches, Petersen, Hummervoll, Deutsch and Murthy1992).
Calcite occurs as vesicle-fills (amygdales) (Fig. 3A), as interstitial infillings of autobrecciated lavas, and disseminated in the altered groundmass. Calcite occurs most abundantly in the more altered lavas, especially in those oxidised to a red colour. The calcite infillings of the vesicles were precipitated at a very early stage, as shown by: (i) their occurrence in clasts in immediately succeeding conglomerates; (ii) intermixtures of calcite and iron oxides in vesicles where the lavas experienced contemporaneous oxidation; and (iii) isotopic data for accompanying silica infillings and K-feldspar, which indicate low-temperature fluids with at least a partially meteoric origin (Fallick et al. Reference Fallick, Jocelyn, Donnelly, Guy and Behan1985; Mark et al. Reference Mark, Rice, Fallick, Trewin, Lee, Boyce and Lee2011). Petrographic examination of the red, altered lavas shows a groundmass dominated by iron oxides and clay minerals, variable amounts of calcite, and corroded remnants of feldspar phenocrysts. Calcite vesicle-fills show growth zoning due to variations in manganese content (Fig. 3B). Less altered samples show serpentinisation of olivine, and chloritisation of the groundmass (Trewin & Thirlwall Reference Trewin, Thirlwall and Trewin2002). The vesicle-fills have very irregular margins, with crenulate interfaces between calcite and host lava, and stringers of calcite penetrating the groundmass (Fig. 3C).
Images of calcite-filled vesicles in Lower Devonian lavas: (A) calcite-filled vesicles (round) and feldspar phenocrysts (laths) in altered basalt lava, Crawton, Mearns (field width 5 cm); (B)–(C) calcite-filled vesicle in lava, Dunstaffnage, Lorne Basin: backscattered electron image (B) shows zoning of infill due to variable manganese content. Secondary electron image (C) shows crenulate margins indicative of fluid–fluid (magma–wet sediment) intermingling during emplacement.

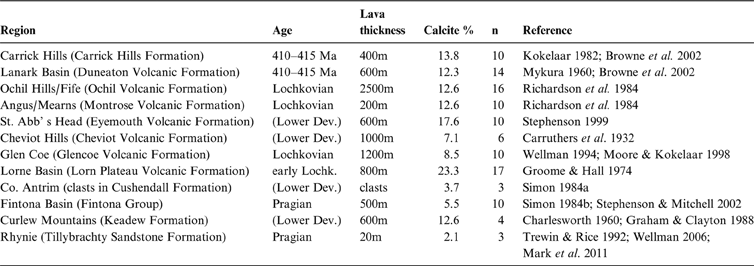
Samples from 12 localities were investigated for their carbonate content (Table 1). The samples are from lava, except those from Co. Antrim, where samples are from lava clasts in Lower Devonian conglomerates that are thought to be locally derived (Simon Reference Simon1984a). The carbonate content was determined from samples of about 10 g, by measurement of mass loss following milling and dissolution in 10% hydrochloric acid. Where possible, both altered and unaltered lava samples were measured.
Localities for carbonate measurement in Lower Devonian lavas

2. Calcite contents of Devonian lavas
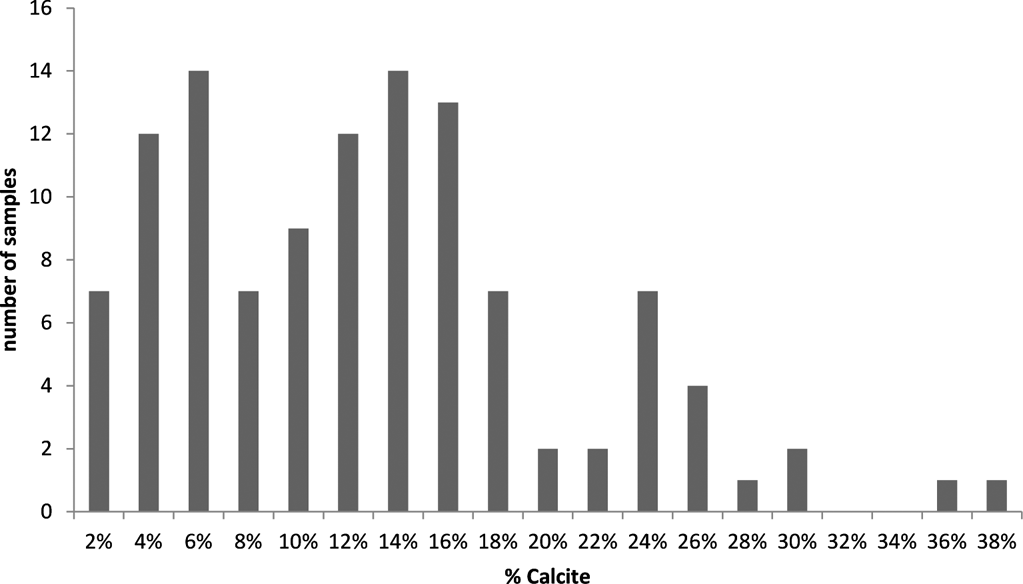
The total database for calcite contents in 104 samples is summarised in Figure 4. Samples from the Cheviot Hills were omitted from calculations, as their carbonate content is considered to be a consequence of hydrothermal alteration by post-lava granite intrusion. It is possible that lavas in other regions have experienced hydrothermal alteration, especially in Glen Coe (Moore & Kokelaar Reference Moore and Kokelaar1998) and Rhynie (Mark et al. Reference Mark, Rice, Fallick, Trewin, Lee, Boyce and Lee2011). However, the sampling was restricted to lavas in which the carbonate was limited to vesicles and autobreccias, and carefully avoided any lavas which exhibited carbonate (or other mineral) veining or brecciation typical of hydrothermal activity. The data show consistent high calcite contents across the region of study. The mean calcite content in altered lavas is 13%. The lavas show a wide range of calcite contents (Fig. 4); the higher values reflect calcite infillings of vesicles. In the most altered lavas, the highest calcite contents represent a combination of vesicle infilling and dissemination through the groundmass. A procedural blank (quartz sand) yielded 0.17% mass loss (mean of three samples), which was subtracted from the measured calcite loss.
Distribution of calcite contents (wt. %) in Lower Devonian lava samples.

3. Discussion
The calcite contents can be used to calculate the uptake of CO2 into the lavas. One mole (44 g) of CO2 is represented by 100 g of calcite. Assuming the mean calcite content in lavas of 13%, and a lava density of 2800 kg m−3, a 1-m thickness of lava has sequestered 3.64×10⁹ moles CO2/km2. Assuming a conservative 30% of lava was altered, and that originally the lava contained no calcite, the mean value for the 11 localities, weighted for lava thickness (mean thickness 675 m), is 7.3×10¹¹ moles CO2/km2. Over the area of 100,000 km2, this equates to 7.3×10¹⁶ moles CO2. This will be an underestimate, because (i) in some localities the proportion of altered lava is clearly greater; (ii) inter-bedded sediments were also carbonated; (iii) we have not included highly auto-brecciated lavas (which contain more calcite) in our calculation; and (iv) modern weathering may have leached out some calcite.
The overall sequestration rate depends upon the time frame assumed. If we consider the whole Lochkovian–Pragian interval, lasting nine million years (Fig. 2), the mean sequestration rate is 8.1×10⁹ moles/a. Volcanic activity in individual regions was probably of shorter duration, but also over a smaller area. On a more local scale, sequestration rates could be higher. A 1-m thickness of weathering over 100 km2 in ten years or one year would increase the rate by one or two orders of magnitude.
The area of 100,000 km2 is a conservative estimate based on current outcrops in the northern British Isles. The extent of volcanic activity on the margin of the Iapetus Ocean would have been much greater. Lower Devonian basalts with reddened tops to flows are similarly recorded in Maine, USA (Gates & Moench Reference Gates and Moench1981), indicating that the rapid subaerial alteration which promoted CO2 drawdown occurred over a globally significant region. The altered region including Scotland and Maine represents approximately 2000 km of arc length (Cocks & Torsvik Reference Cocks and Torsvik2011).
The timescale over which drawdown occurred is uncertain. Baines & Worden (Reference Baines and Worden2004) suggest that solid phase CO2 sequestration in deep sandstone reservoirs takes longer than tens to hundreds of thousands of years, controlled by the dissolution rate of reactive minerals. Sequestration in individual Devonian lava flows could have been much faster, due to more rapid fluid ingress in the near-surface, and consequent rapid alteration of minerals. Both auto-brecciation and magma–sediment interaction would promote alteration almost immediately upon extrusion. The hot magma would react with carbonate in the ambient ground waters. Thus, the irregular margins of calcite vesicle-fills, including stringers penetrating the groundmass, are fluid–fluid mingling textures which represent alteration while the rocks were solidifying. Such fluid–fluid mingling involves large surface areas for extensive and rapid alteration. In addition, these rocks were susceptible to carbonate mineralisation from shallow ground waters. In the prevailing climatic conditions, weathering and mineralisation may have penetrated several tens of metres. We estimate that at least 90% of the calcite in the Devonian lavas is sited in vesicles, as opposed to the altered groundmass. The vesicle-fills represent precipitation from groundwater, while groundmass calcite is a result of fluid–rock interaction. Some samples of relatively fresh, black-coloured, lava contain vesicle-fill calcite, but no calcite in the groundmass. This implies that the vesicle infilling occurred first. However, both must take place rapidly, as red lava clasts in conglomerates contain both types of calcite. The close relationship of lavas, and conglomerates with lava pebbles, has been interpreted as a product of rapid reworking (Phillips Reference Phillips2007), probably in less than 1000 years. The preservation of blocky flow surfaces in some cases, rather than their erosion, has been interpreted to imply very rapid accumulation (Stephenson Reference Stephenson, Stephenson, Bevins, Millward, Highton, Parsons, Stone and Wadsworth1999), although it could also reflect the nature of lava emplacement.
We can make a comparison with modern CO2 consumption in several ways: as a consumption rate per unit area; as consumption over the whole volcanic province; and consumption per unit length of volcanic arc. Comparison with the sequestration rate of modern provinces of volcanic rock is most appropriately made over the whole region.
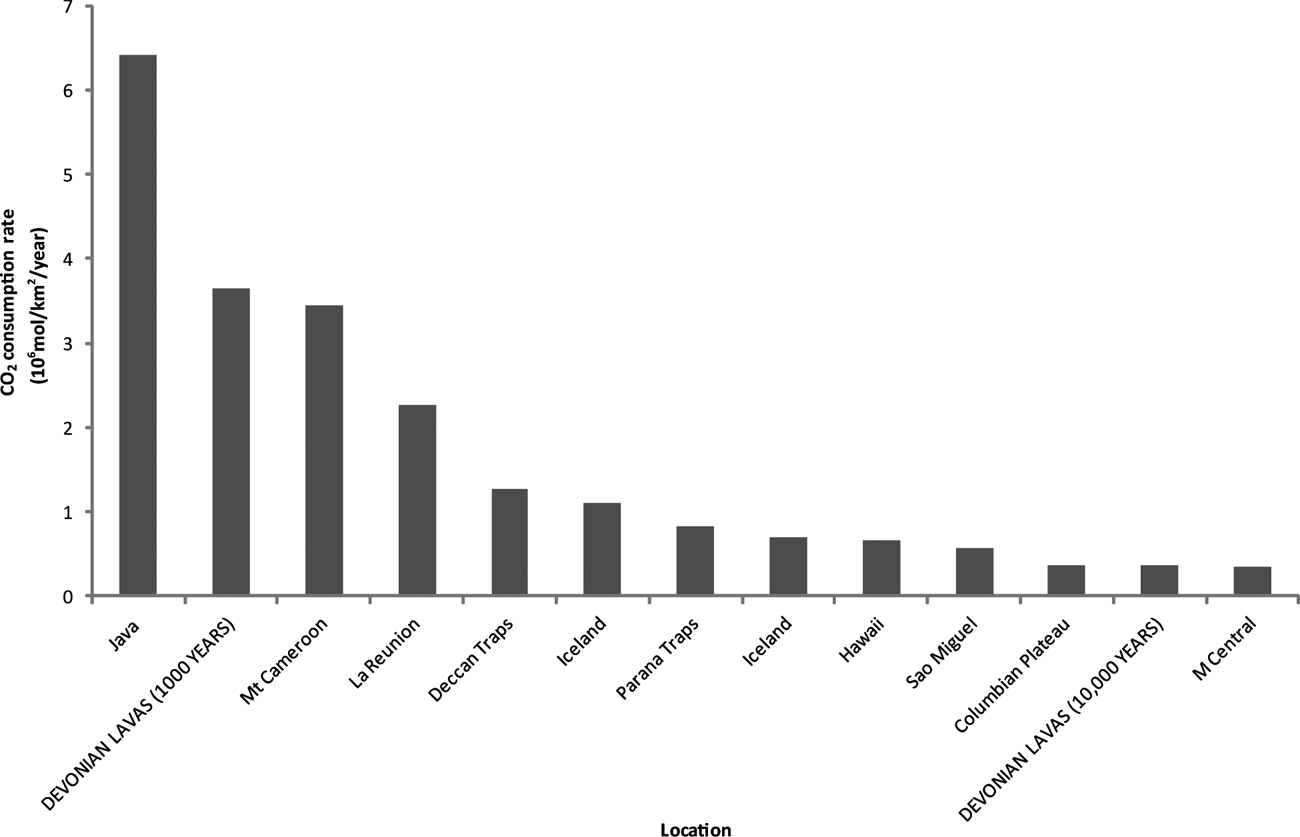
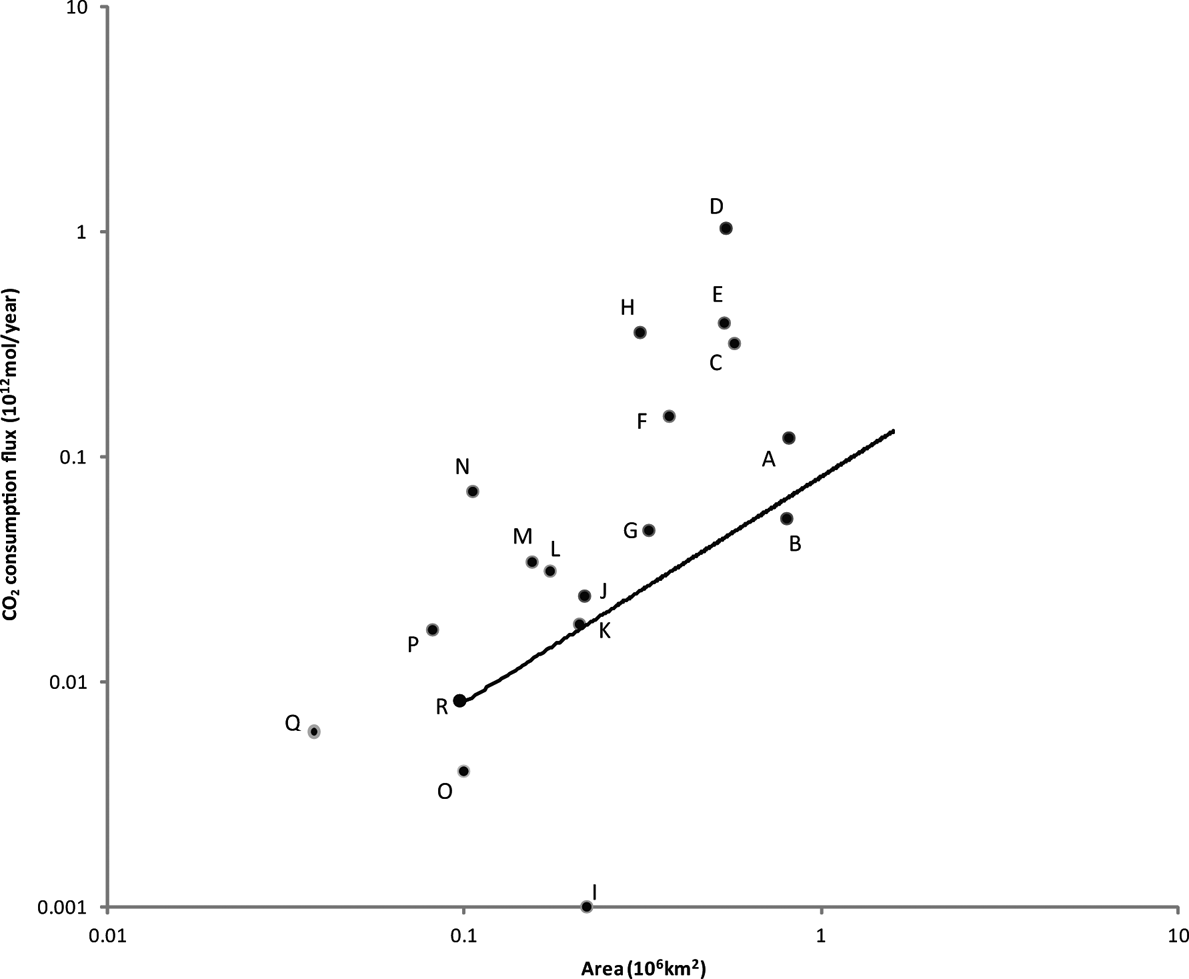
Weathering of 13% of a 1-m surface layer consumes 3.64×10⁹ moles/km2. If that occurred over 1000 years, the consumption rate per unit area is 3.64×10⁶ moles/km2/a. This is comparable to the highest rates determined from modern basaltic watersheds (Dessert et al. Reference Dessert, Dupré, Gaillardet, François and Allègre2003; Fig. 5). Weathering over 10,000 years would still be comparable (Fig. 5), and weathering in less than 1,000 years would be much faster. Over the whole volcanic province in the northern British Isles, if the observed weathering is distributed over nine million years, the consumption rate for a weathered thickness of 200 m becomes 0.0081×10¹² moles/a. That is about twice the consumption flux for the Greenland basaltic province (Cenozoic basalts in Greenland), of identical size (Dessert et al. Reference Dessert, Dupré, Gaillardet, François and Allègre2003; Fig. 6). The Lower Devonian arc extended 4000 km westward down the eastern seaboard of modern North America (Cocks & Torsvik Reference Cocks and Torsvik2011) and, if we scale up the consumption flux proportionally for an increased area, it would be comparable with several other modern basaltic provinces (Fig. 6).
Consumption rate of CO2 per unit area for modern basaltic provinces (data from Dessert et al. Reference Dessert, Dupré, Gaillardet, François and Allègre2003) and Lower Devonian lavas. Devonian rates calculated for weathering to completion of a 1-m surface layer in 1000 and 10,000 years.

Plot of area against CO2 consumption flux for modern basaltic provinces (data from Dessert et al. Reference Dessert, Dupré, Gaillardet, François and Allègre2003) and Lower Devonian lavas: A=Ethiopia; B=Siberia; C=Parana; D=SE Asia/Indonesia; E=Deccan; F=Japan/East Russia; G=Australia; H=Central America; I=Arabian Peninsula; J=South Africa; K=Patagonia; L=Kamchatka; M=Columbia River; N=Iceland; O=Greenland; P=Cascade/Snake River; Q=East Canada; R=Devonian lavas. Flux for Devonian lavas also shown scaled upwards for increased area beyond British Isles.

If the total consumption of 3.6×10⁹ moles/a is distributed over about 500 km of volcanic arc in the northern British Isles, which was oriented parallel to the NE–SW structural grain (Cocks & Torsvik Reference Cocks and Torsvik2011), the consumption per unit length is 6.3×10⁶ moles/km/a. This is comparable to the low end of the range of estimates for CO2 output for modern volcanic arcs. James et al. (Reference James, Manga and Rose1999) predict a mean flux of 7.7×10⁶ moles/km/a for the Cascadian volcanic arc, but other estimates for modern arcs are up to an order of magnitude greater (Gorman et al. Reference Gorman, Kerrick and Connolly2006; Hilton et al. Reference Hilton, Fischer, Marty, Porcelli, Ballentine and Weiler2002). If we adopt the higher consumption rates for a smaller area, those rates would equal or exceed the output fluxes for modern arcs.
The process of sequestration by contemporaneous volcanism is clearly different to that of atmospheric weathering or artificial injection of ancient volcanic rocks. So why are these data valuable? First, they help us to understand the contribution of volcanic activity to the geological record of atmospheric CO2 levels. The general assumption is that volcanism is a source, not a sink, of CO2. Volcanoes today release up to 150 million tonnes (3.4×10¹² moles) of CO2 into the atmosphere each year (USGS 2010) from a combination of ocean ridge and arc volcanism. However, depending on the combination of timescale and arc length, the levels of drawdown that we have determined in the Devonian rocks can be comparable with or exceed the CO2 output flux. At least on a limited timescale, volcanic rocks may be self-compensating in their CO2 budget. Secondly, the measurements give some indication of the natural capacity of volcanic rocks for CO2 uptake. The same high porosity and permeability of lava flow tops makes them favourable for artificial sequestration (McGrail et al. Reference McGrail, Schaef, Ho, Chien, Dooley and Davidson2006) and for geological sequestration, and also makes them good aquifers in many parts of the world (e.g. Russell & Rodgers Reference Russell and Rodgers1977; Kulkarni et al. Reference Kulkarni, Deolankar, Lalwani, Joseph and Pawar2000). The vesicles in which much of the Devonian calcite occurs are also critical to artificially-induced calcite precipitation, as they present very large surface areas (McGrail et al. Reference McGrail, Schaef, Ho, Chien, Dooley and Davidson2006). The calcite mineralogy is also intriguingly comparable, as both our Devonian examples (Fig. 3) and examples precipitated by laboratory experiment (McGrail et al. Reference McGrail, Schaef, Ho, Chien, Dooley and Davidson2006) show zoning due to variable manganese content. Thirdly, atmospheric CO2 levels were high during the Devonian (Berner Reference Berner2006), but were falling rapidly to a much lower level in the Carboniferous. This accompanied the spread of photosynthesising plant life, but the abundant volcanic activity would have contributed to the uptake of CO2.
4. Conclusions
The Lower Devonian lavas, distributed widely across the northern British Isles, show consistent evidence for contemporaneous subaerial weathering. The mineralogical alteration particularly involved the precipitation of calcite, representing CO2 drawdown from the atmosphere via groundwaters. Quantitative measurements of the calcite show that:
-
(i) The total drawdown over an area of 100,000 km2 was in the region of 7×10¹⁶ moles CO2;
-
(ii) distributed over the whole Lochkovian–Pragian interval of nine million years, this equates to a sequestration rate of 8×10⁹ moles/a;
-
(iii) adopting shorter timescales for weathering suggests CO2 consumption rates comparable to, or exceeding, those in modern basaltic watersheds;
-
(iv) the consumption rates per unit volcanic arc length equal or exceed output fluxes of CO2 for modern arcs, showing that volcanic rocks can be an important net sink for CO2.
5. Acknowledgements
We are grateful to C. Rice and J. Ponicka for help in sampling, and to C. Taylor for assistance in the laboratory. We thank D. Brown for a careful review that helped us to improve the manuscript.