Introduction
Adolescence is a period of change that increases susceptibility to psychopathology while also creating opportunities for healthy development (Suleiman & Dahl, Reference Suleiman and Dahl2017). While it is well known that many common psychiatric disorders have their average onset during the adolescent period (Paus, Keshavan, & Giedd, Reference Paus, Keshavan and Giedd2008), the underlying neurobiological mechanisms remain an important question in developmental neuroscience. Normative changes in brain structure and function during adolescence have been posited as creating vulnerability for maladaptive behavior during this period (e.g. imbalance models; Casey, Reference Casey2015). Meanwhile, other avenues of investigation have established changes in physiological responses to stress during adolescence (Hostinar, Johnson, & Gunnar, Reference Hostinar, Johnson and Gunnar2015). To date, however, little work has directly addressed the relationships between brain function and physiological responses to stress during adolescence, an interaction that may elucidate new mechanisms leading to psychopathology during this period.
Normative changes in physiological stress systems, particularly the hypothalamic–pituitary–adrenal (HPA) axis, make up one potential mechanism contributing to the increased risk of psychopathology during adolescence. As individuals transition from childhood into adolescence, the HPA axis becomes more reactive to stressors (Lupien, King, Meaney, & McEwen, Reference Lupien, King, Meaney and McEwen2001; Spear, Reference Spear2000; Sumter, Bokhorst, Miers, Van Pelt, & Westenberg, Reference Sumter, Bokhorst, Miers, Van Pelt and Westenberg2010) and individuals exhibit increased social engagement and neural reactivity to emotional stimuli (Vijayakumar, Pfeifer, Flournoy, Hernandez, & Dapretto, Reference Vijayakumar, Pfeifer, Flournoy, Hernandez and Dapretto2019). This period of heightened reactivity may result in poorly regulated stress and emotion systems in vulnerable youth, contributing to the development and onset of affective disorders during adolescence (Dahl & Gunnar, Reference Dahl and Gunnar2009). In addition to changes in physiological responses to stress, developmental shifts in the efficacy of stress regulation mechanisms further contribute to risk during the adolescent period.
Adolescence is also associated with changes in stress regulation. Work in infants, children, and adults has established that the presence of a caregiver (in the case of infants and children) or a romantic partner (in adulthood) can “buffer” the effects of stressful situations, blocking responses of the HPA axis that would normally occur (Ditzen et al., Reference Ditzen, Neumann, Bodenmann, von Dawans, Turner, Ehlert and Heinrichs2007; Heinrichs, Baumgartner, Kirschbaum, & Ehlert, Reference Heinrichs, Baumgartner, Kirschbaum and Ehlert2003; Hostinar et al., Reference Hostinar, Johnson and Gunnar2015). During adolescence, however, this does not seem to be the case, at least in the context of social evaluative threat. Hostinar et al. (Reference Hostinar, Johnson and Gunnar2015) demonstrated that the adrenocortical responses of 9–10-year-olds to a social evaluative stressor were buffered by the presence of a parent, while the adrenocortical responses of 15–16-year-old adolescents were not. Further, while peers play an increasing role in the social environments of adolescents, they do not assume the role of stress buffer during the adolescent period in response to social evaluative threat (Doom, Doyle, & Gunnar, Reference Doom, Doyle and Gunnar2017). In combination, changes in hormone levels, physiological responses to stressors, and the loss of an effective social buffering mechanism likely contribute to the increased risk observed during the adolescent period. Better understanding the neural correlates of these normative changes in stress- and emotion-regulatory processes during the adolescent transition will be a significant step forward in understanding the under-appreciated neurobiological contributors of emerging psychopathology.
The gold standard behavioral task for probing physiological responses to social evaluative threat is the Trier social stress test (TSST; Dickerson & Kemeny, Reference Dickerson and Kemeny2004), which has been adapted for use with children and adolescents (Buske-Kirschbaum et al., Reference Buske-Kirschbaum, Jobst, Wustmans, Kirschbaum, Rauh and Hellhammer1997; Yim, Quas, Cahill, & Hayakawa, Reference Yim, Quas, Cahill and Hayakawa2010). However, although the TSST produces a robust average cortisol response in many individuals, typically only between 50% and 80% of participants show a significant elevation. This is true in adults (Frisch, Häusser, & Mojzisch, Reference Frisch, Häusser and Mojzisch2015), as well as children and adolescents (Hostinar et al., Reference Hostinar, Johnson and Gunnar2015). In adults, an adapted version of the TSST has been used in the magnetic resonance imaging (MRI) scanner to examine the neural correlates of cortisol responses to stress. In the Montreal Imaging Stress Test (MIST; Dedovic et al., Reference Dedovic, Renwick, Mahani, Engert, Lupien and Pruessner2005, Reference Dedovic, Rexroth, Wolff, Duchesne, Scherling, Beaudry and Pruessner2009; Pruessner et al., Reference Pruessner, Dedovic, Khalili-Mahani, Engert, Pruessner, Buss and Lupien2008), adults completed math problems presented on a screen that putatively displayed their progress compared to that of the average participant's performance. Throughout the task, participants fell behind the computer-generated average participant and were told by an experimenter that they needed to improve their performance. The social evaluative task yielded activation in cognitive control and conflict monitoring regions such as the anterior insula, ventral anterior cingulate cortex, and ventrolateral and dorsomedial prefrontal cortex (Dedovic et al., Reference Dedovic, Rexroth, Wolff, Duchesne, Scherling, Beaudry and Pruessner2009). Additional analyses revealed a limited number of associations between cortisol production and brain function. However, less than half of the participants (37%) in this protocol were classified as cortisol responders. Further, the MIST has not proved effective for elevating cortisol levels in children and adolescents (e.g. 25% responders; Gunnar & Thomas, Reference Gunnar and Thomas2017). Given the heightened stress reactivity, decreased efficacy of social buffering, and increased risk for psychopathology during adolescence, an MRI task that effectively activates the HPA axis is needed to directly test neuroendocrine function during the period. In response to this need, we have developed an adapted version of the TSST that effectively elicits cortisol responses and measures concurrent neural activity during early adolescence, the Minnesota Imaging Stress Test in Children (MISTiC).
Using this new task, which includes the preparation and delivery of a speech in addition to a math task, we set out to meet two primary objectives. First, we wanted to test whether the MRI task could effectively elicit a cortisol response at similar rates to the behavioral TSST task. Based on existing literature and pilot data in our lab we expected to find a group of cortisol responders (50%–60% of the study population) and nonresponders (40%–50% of the study population). Second, we wanted to establish the brain regions associated with social evaluative stress during adolescence. We predicted that brain function during the math task would mirror the results of Dedovic et al. (Reference Dedovic, Rexroth, Wolff, Duchesne, Scherling, Beaudry and Pruessner2009), including significantly increased activity in the insula, medial and lateral prefrontal regions, and paracingulate cortex when completing math problems under stress compared to an unstressed condition. Finally, given the concurrent collection of salivary cortisol levels and functional brain imaging, an exploratory goal of this study was to examine potential relationships between cortisol reactivity and neural responses to social evaluative stress.
Method
Participants
Forty early adolescents between 11–14 years of age completed the MRI session (M age = 12.33 years, SD age = 0.77 years, 18 female). Participants were recruited from a database of families interested in child development research maintained at the University of Minnesota. The majority of participants were white and from middle class families (85% White, 10% Asian, and 5% more than one race; median household income = $100,001 – $150,000). Youth and their parents were compensated for their participation in the study. All procedures were reviewed and approved by the University of Minnesota's Institutional Review Board.
Procedures
Session timeline
Adolescents and their caregivers arrived at the imaging center 30 minutes prior to the beginning of the MRI scanning session and completed informed consent and assent procedures. Twenty minutes after arrival, participants were separated from their parents and changed into surgical scrubs for MRI scanning. After changing, participants were escorted to the scanning room and situated in the MRI scanner. A structural scan with movie viewing and 10 minutes of eye-open, resting-state functional MRI (fMRI) were completed prior to the stressor paradigm in order to familiarize participants to the scanning environment. Following completion of the stressor paradigm, a final 10 minutes of resting-state fMRI data was collected. After scanning, participants returned to the lobby where they completed questionnaires and cortisol sampling. All sessions began at 3 p.m. or later to account for diurnal variation in cortisol.
MISTiC
Participants completed the MISTiC, which consisted of the preparation and delivery of a speech to unfamiliar judges and completion of timed multiple-choice math problems. The MISTiC protocol is a slight modification of the commonly used TSST (Kirschbaum, Pirke, & Hellhammer, Reference Kirschbaum, Pirke and Hellhammer1993) using the speech prompt from the Modified TSST (TSST-M; Yim et al., Reference Yim, Quas, Cahill and Hayakawa2010). In this protocol, adolescents were given five minutes to prepare a speech in which they were to introduce themselves to a new class of students and include in their speech at least one good thing and one bad thing about themselves. The speech preparation period was timed with a count-down clock on the screen in front of them. After the speech preparation period, one female and one male judge wearing white lab coats entered the screen of a closed-circuit video system and were seated facing the camera. The judges instructed the participant that their speech should be five minutes in length and reiterated the topic of the speech. Speech instructions also informed participants that their performance would be videotaped and later rated by a classroom of students their age, though no such recording was made. Participants then gave the speech they had planned while lying in the MRI scanner. If the participant stopped speaking for 20 seconds or more the judges would respond, “please continue, your time is not yet up.” No images were acquired during the speech period due to motion caused by speaking and the acoustic interference of scanning. After the speech period, an experimenter asked the participant to lie still for two short scans (used to mitigate the effects of movement during the speech on later registration). When the scans were complete, the female judge gave instructions for the 5-minute math portion.
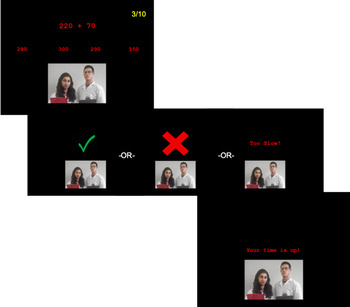
Unlike other versions of the TSST, the math portion of the MISTiC protocol used on-screen multiple-choice math problems normed for 11–14-year-olds (Rinne & Mazzocco, Reference Rinne and Mazzocco2014). Pilot testing had shown this to be the optimal strategy for eliciting a cortisol response in the scanner, perhaps because the serial subtraction used in behavioral versions of the TSST (e.g. subtract 7 from 758 as quickly and accurately as possible) is substantially easier when completed in multiple-choice format on screen. Participants were told that their goal should be to get at least 10 problems in a row correct. Math problems were presented in the center of the screen for a maximum of 5,000 ms with four options listed below. After a response was made, a 1,500 ms feedback screen indicated a correct answer with a green check mark, an incorrect answer with a red “X”, or indicated that the response had been too slow. Two blank trials equivalent to the length of math trials (7,500 ms) were inserted randomly into every 10 trials to provide an effective baseline for the math task. Participants used a button-box in their right hand to indicate the correct answer to the addition, subtraction, multiplication, or division problems presented on the screen from the set of four options. Progress toward the participant's goal was tracked in the top right corner of the screen. Incorrect or missed responses reset the progress counter to 0/10. The judges maintained neutral facial expressions throughout the speech and math periods, held clipboards in their hands, and feigned note-taking throughout. At the conclusion of the math section, the judges addressed the participant saying, “Thank you, that's a hard task for everyone,” and exited the screen. Figure 1 provides a schematic overview of the math task. One participant was excluded from analysis due to an error in the presentation of the math task.
Overview of the math task used in the Minnesota Imaging Stress Test in Children (MISTiC) paradigm. Problems were presented on screen for 5,000 ms. Participants received visual feedback for correct and incorrect answers (green check mark or red “x,” respectively) or were told that they responded too slowly. Two live judges were presented via picture-in-picture video feed throughout the five-minute math task. Participant success was tracked in the upper right corner of the screen as the number of correct answers in a row out of the goal number of 10.

To allow for direct testing of stressed compared to unstressed segments of the MISTiC, both the speech preparation and math segments had roughly equivalent unstressed versions. Here we report only on the comparison of judged and unjudged math. To provide an unstressed version of the math, 20 minutes after completion of the judged math task, participants completed the same math task without being observed by judges. Participants completed a 10-minute set of diffusion-weighted scans while watching a movie between judged and unjudged math to allow for recovery between tasks. During the unjudged math task, participants were presented with two empty stools where the judges had previously been and their progress was not tracked on the screen. Contrasting levels of brain activity during the judged and unjudged math tasks allows for a direct test of brain activity in stressed and unstressed conditions.
Participants were debriefed following the completion of the imaging protocol to ensure they understood that the judges were not actually assessing their performance, that the judges were not recording notes, and that they were not videotaped during the stress task.
Self-reported stress ratings
Participants completed a short self-report of their perceived stress immediately following the MRI portion of the task but prior to debriefing. Responses to the question, “How stressed did you feel during the [speech prep, speech, math with judges, etc.]?” were recorded. Participants rated perceived stress for: arrival at the facility, time before getting into the MRI machine, the time spent in the MRI, the math task with judges, and the time spent outside the scanner following the task. Ratings ranged from 1 (“not at all”) to 5 (“a whole lot”).
Cortisol saliva sampling
Nine saliva samples were collected throughout the session: three prestress task samples to assess adaptation, three during the stress task in the scanner, and three recovery samples after scanning. Participants mouthed Salimetrics’ SalivaBio Children's Swabs, made from a synthetic material known not to interfere with cortisol assay, to provide saliva samples. Saliva samples occurring outside of the scanner were collected using a 2-inch swab placed entirely in the mouth for 30–60 seconds or until soaked through. When participants were lying in the MRI scanner, samples were collected using a 5-inch swab, half of which remained outside the mouth to prevent choking. Participants were asked to refrain from ingesting anything other than water within 2 hours of the session start time. After the session was completed, saliva was stored in a laboratory freezer (−20 °C) prior to being shipped to the University of Trier, Germany for assay. All samples were assayed for cortisol concentrations in duplicate using a time-resolved fluorescence immunoassay (DELFIA). Intra- and inter-assay coefficients of variation were under 10%. All samples from a single participant were assayed in the same batch.
Cortisol analysis
The average of duplicate samples was used for final analysis and values were log transformed due to skewness. Four out of 339 cortisol values were considered outliers (>4 SD from the mean) and were winsorized. To evaluate the response to the task, the first three adaptation samples were ignored. The three samples collected in the scanner and the three recovery samples were then used to index responding. A cut-off of 10% increase from sample four to sample eight was used to identify responders as advised by Van Cauter and Refetoff (Reference Van Cauter and Refetoff1985). Fifty-one percent (51%; 19/37) of participants produced an increase of 10% or more. Visual inspection of individual participant curves confirmed that group assignments were aligned with individual responses to the psychological stressor.
We then calculated area under the curve with respect to intercept (AUCi) to evaluate continuous effects of cortisol production on neural activity (Pruessner, Kirschbaum, Meinlschmid, & Hellhammer, Reference Pruessner, Kirschbaum, Meinlschmid and Hellhammer2003). Area under the curve with respect to ground (AUCg) was also calculated to allow for the possibility that the overall production of cortisol, not the increase associated with the task, was related to brain function (Pruessner et al., Reference Pruessner, Kirschbaum, Meinlschmid and Hellhammer2003). Behavioral and cortisol-related analyses were completed in R (R Core Team, 2013) and data visualization was completed using ggplot2 (Wickham, Reference Wickham2016).
fMRI data acquisition and analysis
MRI data were collected using a Siemens 3 Tesla Prisma scanner with a 32-channel head coil. Structural data were acquired using a T1-weighted three-dimensional magnetization-prepared rapid-acquisition gradient echo (MPRAGE) sequence (TR = 2530 ms, TE = 3.65 ms, FOV = 256 × 176 mm, coronal plane, flip angle = 7°, 1 mm3 isotropic voxel, acceleration = GRAPPA 2, 240 slices). Stress test data were collected with a T2*-weighted echo-planar imaging (EPI) pulse sequence in the posterior to anterior direction (TR = 1500 ms, TE = 30 ms, slice thickness = 2 mm, 72 contiguous slices, 106 × 106 matrix, FOV of 212 × 212 mm, 2 mm3 isotropic voxel, multiband acceleration factor = 4). Short, reverse phase encoded EPI scans (anterior to posterior) with the same prescriptions were acquired for unwarping.
Preprocessing and analysis of neuroimaging data were completed using the Oxford Centre for Functional MRI of the Brain's (FMRIB) Software Library v6.0 (FSL; Jenkinson, Beckmann, Behrens, Woolrich, & Smith, Reference Jenkinson, Beckmann, Behrens, Woolrich and Smith2012; Woolrich, Behrens, Beckmann, Jenkinson, & Smith, Reference Woolrich, Behrens, Beckmann, Jenkinson and Smith2004; Woolrich, Ripley, Brady, & Smith, Reference Woolrich, Ripley, Brady and Smith2001). Data preprocessing included skull stripping using the Brain Extraction Tool, motion correction to the initial volume using MCFLIRT, geometric unwarping using reverse-phase encoded data and FSL's FUGUE tool, spatial smoothing with a 6 mm full width at half maximum Gaussian kernel, and high-pass temporal filtering using a 100 second cutoff. Motion was quantified using the root mean square of six motion parameters. High-motion volumes were censored if they exceeded one or both of the following criteria: (a) absolute displacement of greater than one voxel from the initial volume or (b) relative displacement from the previous volume of one-half voxel. Finally, participant's functional images were registered to their high-resolution MPRAGE image using boundary-based registration and subsequently registered to a standard space (MNI152 2 mm T1 template) using 12 degrees of freedom. Only volumes exceeding motion thresholds were censored. Seven participants were excluded from MRI analysis for excessive motion, defined as more than 33% of total TRs across both runs of the math task exceeding motion thresholds. Finally, participant's functional images were registered to their high-resolution MPRAGE image using boundary-based registration and subsequently registered to a standard space (MNI152 2 mm T1 template) using 12 degrees of freedom.
Preprocessed data were then entered into a first-level mixed effects general linear model (GLM) with two predictors of interest – problem completion and feedback. Blank trials were used as the unmarked baseline condition. Predictors of interest were convolved with FSL's gamma-function based estimation of the hemodynamic response function with default parameters. Each predictor's first temporal derivative was also added to the model. Finally, six motion parameters (three rotation and three translation) and nuisance predictors for each of the censored volumes were included. The contrast of interest was problem greater than baseline.
Output from the first level was then submitted to a second-level within-subject fixed effects GLM analysis to compare math when being observed by judges to math completed without judges present. At this level, the contrast of interest was neural activation during judged math greater than unjudged math. Mean activation maps were also computed for math overall, as well as for each of the math conditions individually (judged math and unjudged math).
Finally, group-level analyses were completed using a whole-brain mixed effects GLM. Continuous effects of cortisol production during the task were evaluated by entering mean-centered AUC values for each participant as the predictor of interest. AUCi analyses focused on cortisol responders only. The analysis of AUCg included all participants as it reflects the possible influence of anticipatory stress effects. Group-level analyses also investigated mean activation across all participants as well as within the cortisol responder and cortisol nonresponder groups separately. A group contrast of cortisol responder greater than cortisol nonresponder was also calculated.
Results
Neural response to socially evaluative stress
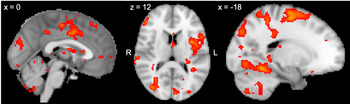
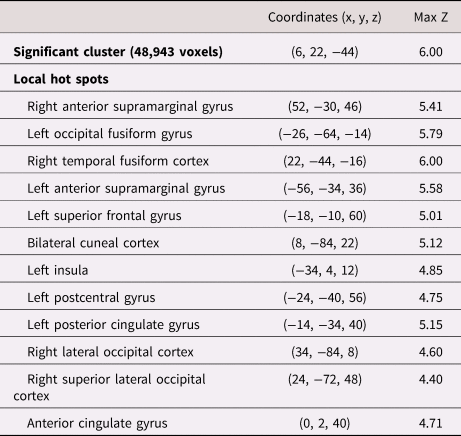
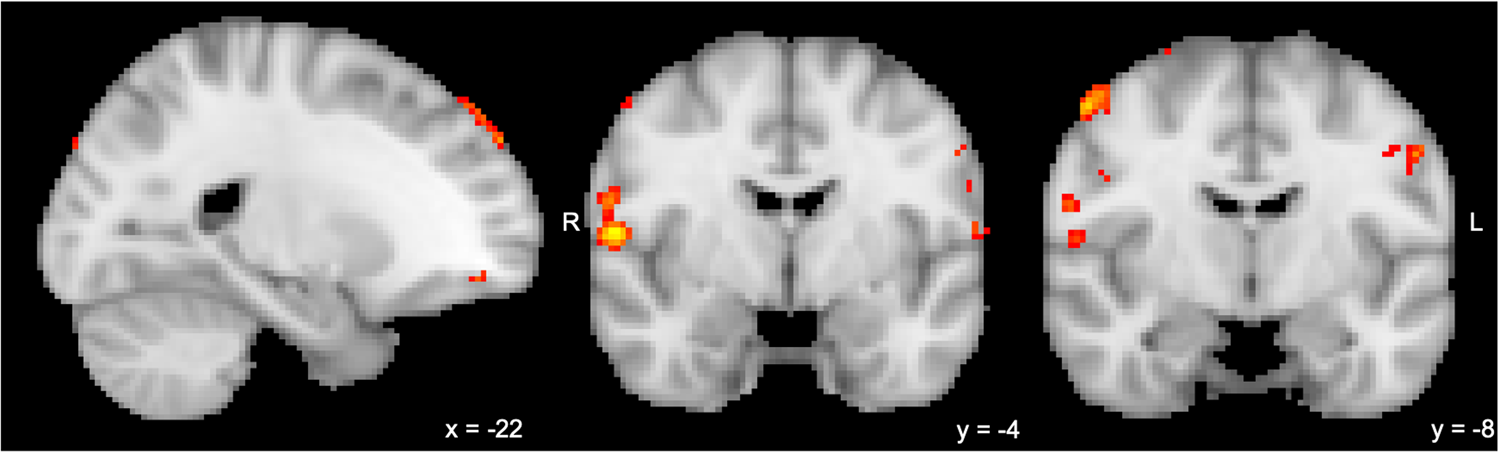
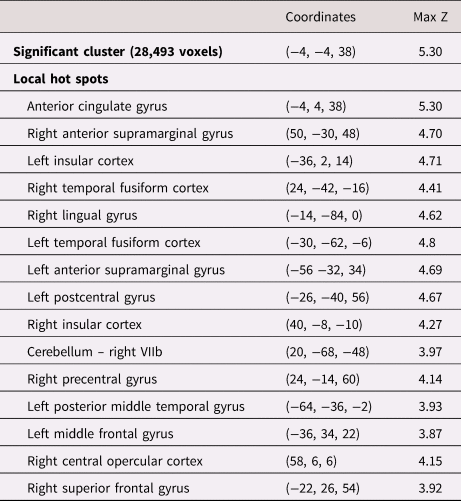
In order to evaluate differences in neural activity associated with the MISTiC social evaluation, we examined mean task activation across all participants with a judged math greater than unjudged math contrast. Results included widespread and robust effects of the judged math task compared to the unjudged math task (p < .005, cluster corrected p < .05; Figure 2). Increased activity during judged math was evident in the bilateral fusiform gyrus, left superior frontal gyrus, left insula, and anterior cingulate cortex compared to unjudged math. A complete list of regions that were more active during judged math versus unjudged math can be found in Table 1.
Neural activity during social evaluation (judged math > unjudged math) across all participants. All regions survive correction for multiple comparisons (voxelwise p < .005, cluster corrected p < .05). Significant locations include paracingulate, left insula, left superior frontal, and bilateral fusiform cortex.

Mean activity for all subjects in the judged math > unjudged math contrast

Locations and Montreal Neurological Institute (MNI) coordinates of activation in the judged greater than unjudged math contrast in all participants. With a voxelwise threshold of p < .005 with cluster correction of p < .05, one large cluster was identified covering many anatomical regions. The voxelwise threshold was increased to p < .001 to identify local hot spots within the significant cluster.
Cortisol responses to MISTiC
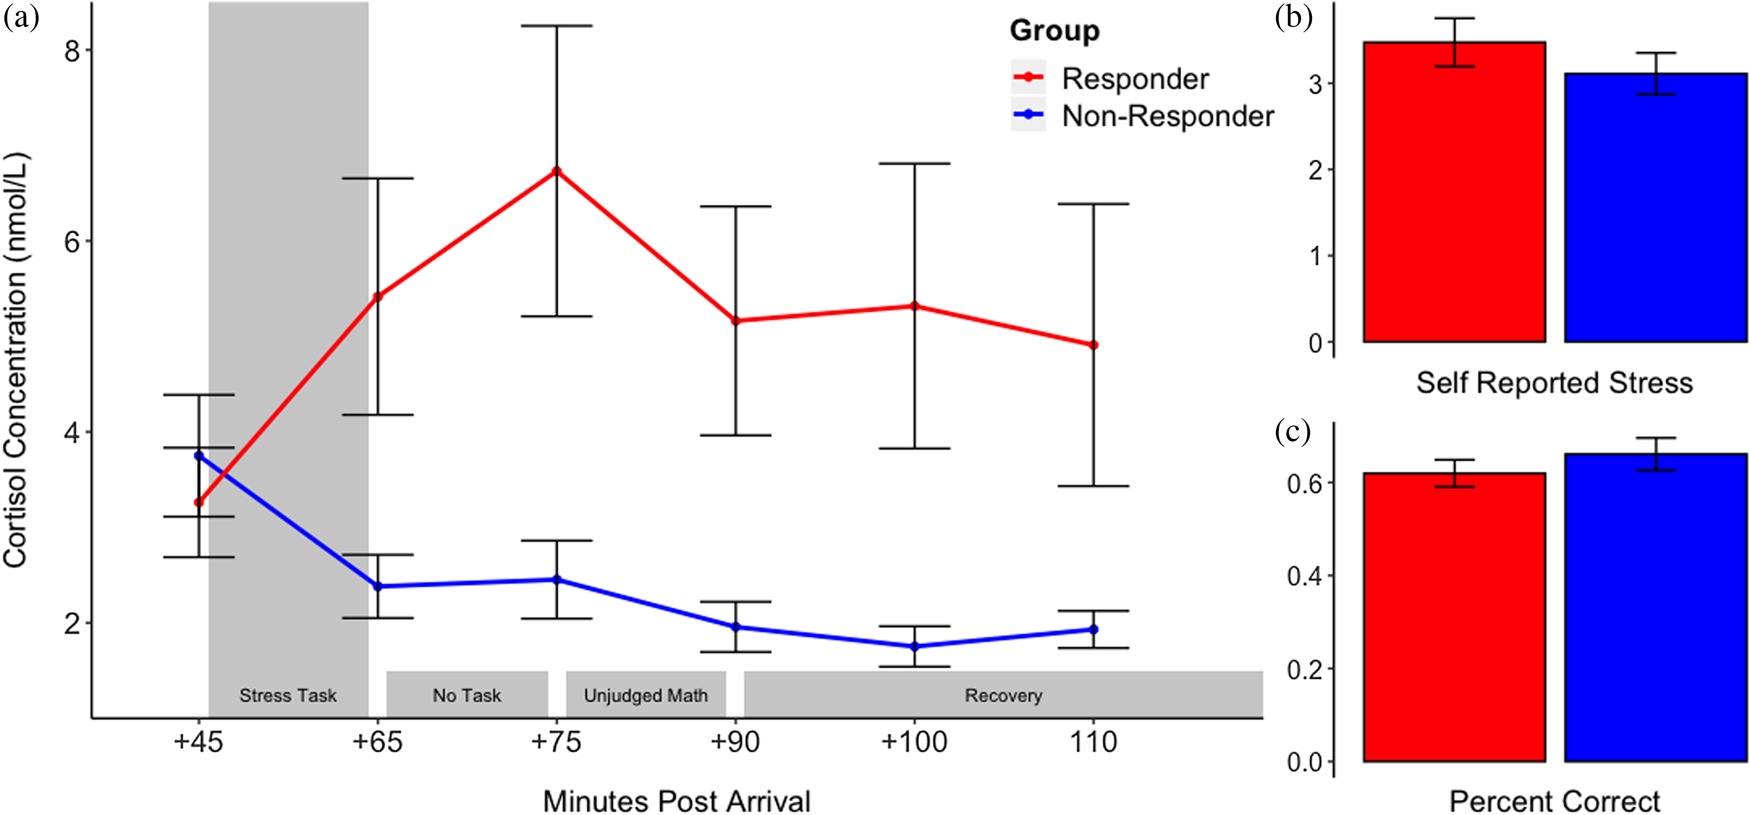
Cortisol values during the stress task for the full group were entered in a within-subject repeated measures analysis of variance (ANOVA) to examine average responses to the stressor. Results revealed a significant effect of time on cortisol concentration in the full group (F = 4.116, p = .008). As expected, there was heterogeneity in cortisol responses such that a group of responders and a group of nonresponders were evident. Group average cortisol curves can be seen in Figure 3a. By definition, cortisol responders exhibited significantly more cortisol production than nonresponders during the stressful portions of the MISTiC paradigm (see means and standard deviations for all time points in Supplementary Table 1). On average, responders displayed a 106.4% increase in salivary cortisol concentration from the beginning of the stress task to the peak of cortisol production after the stress test. Nonresponders exhibited the expected diurnal pattern of decreasing cortisol values across the stress task. No differences in sex or age were identified between cortisol groups (t(1, 35) = −1.48, p = .15 and t(1, 35) = 1.25, p = .22, respectively).
(a) Mean cortisol concentrations in cortisol responders and nonresponders during completion of the Minnesota Imaging Stress Test in Children (MISTiC) paradigm, beginning with the sample acquired immediately prior to the stress task. Light gray shading indicates the stressful portion of the task. As expected, the peak cortisol response in the responder group occurs approximately 20 minutes after the stressful portions of the task. Error bars indicate ±1 SE from the mean. (b) Self-reported stress during the math task; higher values indicate more perceived stress out of a maximum of 5. Group differences were not significant (p > .05). (c) Accuracy (percent correct) on math problems during the judged math portion of the scanning session. Group differences were not significant (p > .05).

Self-reported stress and cortisol
To ensure that the MISTiC task was perceived as stressful in addition to eliciting a physiological stress response, self-reported stress during the math task was collected. Self-reported stress ratings indicated that the math task was associated with perceived stress (M = 3.3, SD = 1.13), indicating that the task was experienced as moderately stressful. Cortisol responders did not report significantly higher perceived stress than nonresponders (t(1, 35) = −0.982, p = .33; Figure 3b) nor was perceived stress associated with AUCi (r = 0.25, p = .13). Means and standard deviations for each rating period by responder group can be found in Supplementary Table 2.
Math performance, self-reported stress, and cortisol
We also investigated the associations between success on the math task and perceived and physiological stress. Math performance (percent correct) did not differ between judged and unjudged conditions (t(1,36) = 0.53, p = .60). Results indicated that the math problems were difficult in the time provided (M percent correct = 63%, SD = 14%). Accuracy (percent correct) on the judged math task was negatively correlated with perceived stress during the stressor task (r = −.37, p = .03), indicating higher perceived stress among participants who made more mistakes. Importantly, cortisol responder groups did not differ in accuracy during the judged math (t(1,35) = 0.91, p = .37; Figure 3c) nor was judged math performance correlated with AUCi, though there was a trend-level effect (r = −0.31, p = .06). Given that neither math performance nor perceived stress differed across cortisol groups or as a function of AUCi, we did not include either as covariates in the MRI analysis.
Cortisol and brain function
AUC and neural activity
After confirming that the task effectively elicited a cortisol response and successfully delineated neural activation associated with social evaluation, a set of exploratory analyses investigated whether cortisol reactivity was associated with brain function during the task. When AUCi was evaluated in only the cortisol responder group, there were regions in the right central operculum, right precentral gyrus, and left frontal pole that increased in activity as a function of increasing AUCi (p < .005, see Figure 4). These effects did not survive cluster correction. When AUCg was used to evaluate total cortisol production (which includes the possibility of anticipatory stress effects in the full sample), a pair of clusters was evident in bilateral frontal pole prior to cluster correction (p < .005) though no clusters survived cluster correction (see Supplementary Figure 1).
Regions positively associated with area under the curve with respect to intercept (AUCi) during social evaluation in the cortisol responder group only (judged > unjudged math; p < .005, no cluster correction). The largest clusters are observed in left superior frontal gyrus, right central operculum, and right precentral gyrus (116, 175, and 132 voxels, respectively).

Brain activity in cortisol responders and nonresponders
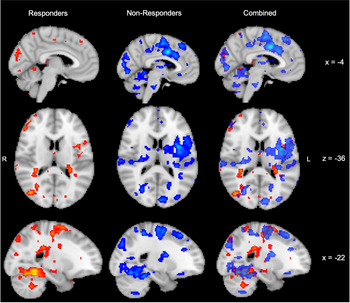
Given the small sample size of this pilot study, no activations survived cluster correction when responders were compared to nonresponders in the judged greater than unjudged condition. However, when the mean activity in each group was investigated separately, some qualitative differences were evident. Both groups exhibited significant task effects in a large number of regions (p < .005, cluster corrected p < .05). Among the significant clusters, several overlapped between groups, while others were unique to responders or nonresponders. For the most part, overlapping clusters were located in sensorimotor and association cortices, including fusiform, parietal, and occipital cortex.
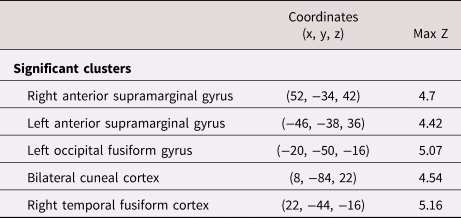
Cortisol responders showed significant effects in regions of sensory and association cortex such as the supramarginal gyrus, fusiform gyrus, and cuneal cortex. The nonresponder group showed these same regions as well as additional activation in bilateral anterior cingulate, bilateral insula, and right superior frontal gyrus. Figure 5 shows these results in responders, nonresponders, and with the maps superimposed (see Tables 2 and 3 for a list of significant clusters in the cortisol responder and nonresponder groups, respectively).
Mean neural activity during social evaluation (judged > unjudged math) by cortisol group. All effects are positive (i.e., greater activation during the judged compared to unjudged math). Color indicates cortisol response group (red = cortisol responders, blue = cortisol nonresponders). Common activation was observed in sensory, motor, and association cortices while unique activations occurred most often in higher-order regions of cortex.

Mean activity in cortisol responders in the judged math > unjudged math contrast

Locations and MNI coordinates of activation in the judged greater than unjudged math contrast in cortisol responders. All clusters survive correction for multiple comparisons (voxelwise p < .005, cluster corrected p < .05).
Mean activity in cortisol nonresponders in the judged math > unjudged math contrast

Locations and MNI coordinates of activation in the judged greater than unjudged math contrast in cortisol nonresponders. With a voxelwise threshold of p < .005 and cluster correction of p < .05, one significant cluster is identified crossing many anatomical regions. Local hot spots were identified by increasing the voxelwise threshold to p < .001.
Math performance and brain function
Similar to the results for AUCi, a number of small effects were evident when the difference in math performance between judged and unjudged math was used as a continuous predictor of neural activity in the judged greater than unjudged condition. Lower accuracy during the judged compared to unjudged math task was associated with increased activity in the left postcentral gyrus, left central operculum, and left precentral gyrus (p < .005; see Supplementary Figure 2). These effects do not survive cluster correction.
Given that math performance and perceived stress were correlated, an analysis also investigated associations between perceived stress and brain function. No significant associations were found in this analysis.
Discussion
Neural activity for judged versus unjudged math
When comparing brain activity during the judged and unjudged math tasks we found heightened activation in the left insula, left superior frontal gyrus, and paracingulate cortices. Increased activity in the insula, a region associated with processing of social exclusion and evaluation, suggests that the presence of the judges during the judged portion of the task is perceived as a socially salient (and somewhat negative) event (Eisenberger, Reference Eisenberger2012). Consistent with this effect, activation of the superior frontal gyrus is often observed when participants are asked to consciously control their emotional responses to a task or socially salient images (Buhle et al., Reference Buhle, Silvers, Wage, Lopez, Onyemekwu, Kober and Ochsner2014; Ochsner et al., Reference Ochsner, Ray, Cooper, Robertson, Chopra, Gabrieli and Gross2004). Increased activation during judged math in these two regions is consistent with the possibility that participants were engaging with the social aspects of the stressor task and further recruited resources for the cognitive regulation of emotion. Finally, the anterior cingulate gyrus has been associated with a diverse array of functions including error or conflict monitoring and processing of social pain (Eisenberger, Reference Eisenberger2015). Given the nature of the MISTiC task, the activity observed in the anterior cingulate may be associated with either or both of these functions: the cingulate may be playing a role in the completion of the math problems and monitoring of errors during the task and/or may be involved in processing the social stress imposed by the presence and behavior of the judges. In addition to the higher-order cognitive regions discussed above, performing math in the presence of judges increased activity in sensory and associative regions, particularly occipital, fusiform, and supramarginal cortices. It is likely that much of this activity necessarily reflects the added visual stimulation carried by the presence of live judges that was not present in the unjudged math task.
Compared to adult findings using the MIST, adolescents activated similar insula and anterior cingulate regions during socially evaluated math (Dedovic et al., Reference Dedovic, Rexroth, Wolff, Duchesne, Scherling, Beaudry and Pruessner2009). However, whereas Dedovic and colleagues noted increased activity in the ventrolateral and dorsomedial prefrontal cortex, we did not observe such activation in our task. Unfortunately, because the tasks differed, we cannot tell whether these activation differences were due to developmental changes or task differences. While we and others have been unsuccessful in using the MIST with children and adolescents (i.e., low rate of cortisol reactivity), the MISTiC may be easily adapted for adults and is likely to successfully elicit a cortisol response given the parallel structure to the TSST. Thus, it should be possible to conduct a direct examination of developmental changes in the neural systems involved in reactions to social evaluative stress using this task.
Cortisol responses to the MISTiC paradigm
An effective stressor task should elicit a significant increase in cortisol, on average. This was the case for the MISTiC. As expected, roughly 50% of the participants showed a significant cortisol response to the MISTiC paradigm. This is consistent with studies using the TSST outside of the scanner (50%–80% of participants; Frisch et al., Reference Frisch, Häusser and Mojzisch2015). As in many other studies of the TSST, self-reported stress and cortisol reactivity were not significantly correlated (e.g., Takahashi et al., Reference Takahashi, Ikeda, Ishikawa, Kitamura, Tsukasaki, Nakama and Kameda2005). Thus, failure to show a cortisol response to the MISTiC paradigm was not the result of those youth perceiving the situation as less stressful. Nor was it the case that the youth who were nonresponders were able to do the math easily without errors as accuracy on the math problems did not differ between responders and nonresponders. It could be the case, however, that some individuals in the nonresponder group mounted an anticipatory cortisol response prior to the session and thus may have exhibited dampened cortisol responses to the MISTiC paradigm itself. While there was a correlation between perceived stress and math performance, neither math performance nor perceived stress were correlated with cortisol responses. Future research in this and other data sets investigating the neural correlates of perceived stress and math performance during social evaluation may illuminate additional individual differences that contribute to adolescent responses to stress.
Brain function associated with cortisol reactivity
Brain activity may be associated with differences in cortisol stress responding. Given the preliminary nature of this study, we were underpowered to detect continuous or group effects of cortisol production though there were preliminary indications that such effects may be evident in larger samples. Specifically, when examining the responder group separately, increased cortisol reactivity was associated with increased brain activity in the right operculum. While this effect did not survive cluster correction, it provides some evidence that regions associated with affective processing may be associated with increased cortisol reactivity during socially evaluative tasks. Cortisol responders showed the largest effect sizes in visual association regions that were active in both groups during judged math, though subthreshold activations were present in superior and inferior frontal gyri. If replicable in a larger sample, we hypothesize that the subthreshold superior and inferior frontal gyri activation in cortisol responders may reflect the recruitment of additional cognitive resources during the completion of the judged portion of the math task – either as evidence of heightened sensitivity to social evaluation or as an adaptive strategy for maintaining math performance under distraction. Alternatively, the lack of recruitment of higher-order cognitive regions in cortisol responders may be the result of heterogeneity of neural recruitment within the responder group itself. Larger samples of cortisol responders may be able to disentangle this potential diversity of neural patterns, many of which may facilitate behavioral performance when completing math in socially evaluative environments.
Conversely, nonresponders exhibited effects not seen in the responder group, including increased activity in the left insula and bilateral anterior cingulate. The insula and anterior cingulate activation in the nonresponders may suggest that nonresponders are processing the emotional or self-referential aspects of the socially evaluative context, but are not recruiting additional physiological resources to maintain behavioral performance. Given the lack of group differences in either perceived stress or math accuracy, these divergent brain results may indicate that mounting a cortisol response is important for peak performance during social evaluation in some individuals while others recruit a more consistent pattern of neural activity in lieu of a cortisol response.
This would be consistent with other studies that have attempted to understand why some participants can maintain the same performance, but not activate endocrine stress responses. The earliest of this work explored cortisol reactivity in high school students and engineering students in Sweden during academic exams. In these studies, conducted in the 1970s, males produced a larger cortisol response to the exams and reported greater effort and better performance than the females, despite no actual performance differences (Collins & Frankenhaeuser, Reference Collins and Frankenhaeuser1978; Frankenhaeuser et al., Reference Frankenhaeuser, von Wright, Collins, von Wright, Sedvall and Swahn1978). Given these results and past research, it is clear that multiple patterns of neuroendocrine activity are associated with similar behavioral performance.
An important caveat to the interpretation of data from stress tasks like the MISTiC arises when considering what constitutes the most adaptive response. The production of cortisol, and activation of other physiological stress systems, is one mechanism by which the brain and body allocate resources to respond to their environment (Korte, Koolhaas, Wingfield, & McEwen, Reference Korte, Koolhaas, Wingfield and McEwen2005). For some individuals, completing a set of math problems in front of a group of strangers may not require additional resources to maintain appropriate behavioral performance. In these cases, mounting a cortisol response is maladaptive – it amounts to a needless expense of physiological resources. Conversely, an individual who is threatened by the presence of social evaluators or struggles to maintain behavioral performance on a socially evaluated task may be well served by the additional physiological resources afforded by mounting a cortisol stress response.
The same concept likely applies to brain activity: one pattern of activity may be more adaptive for some individuals than for others. In individuals for whom social evaluation is an emotionally salient and negative experience, increased activation of emotion regulation regions may be the most adaptive response. Alternatively, individuals who are motivated more positively by social evaluation may be better served by attending to the social environment as a means of boosting their performance. How these profiles of brain and HPA axis activity interact with one another to adapt to the social environment is one of the major questions the MISTiC task is equipped to answer. Future research specifically targeting the individual differences that predict brain and/or cortisol responses during this socially evaluative task is likely to identify interesting new avenues for research in normative and stress-dysregulated populations.
Limitations
While the results presented here are promising for future research, the current study is limited in several ways. First and foremost, as a preliminary study of the MISTiC task, the sample size is insufficient to draw firm conclusions about differences between responders and nonresponders. Even continuous measures of the magnitude of the cortisol response are limited given the essentially zero values for all nonresponders. However, the pattern of results between groups suggests that the MISTiC task may be a useful tool for scientists interested in many aspects of socially evaluative stress, neuroendocrine interactions, and pathways from stress dysregulation to psychopathology.
Another potential weakness of the MISTiC paradigm is intimately linked to the difficulty of concurrently completing a stress task in an MRI scanner and collecting measures of salivary cortisol. While the cortisol effects observed here indicate that the protocol is capable of eliciting an HPA axis response at levels similar to behavioral studies, the psychological distancing effects of the scanner must be overcome. The current study changed previous stress tests in the scanner by returning the preparation and delivery of a speech to the protocol, using live judges on video-feed, and ensuring appropriately difficult math problems (but low response demands) for the age range of the participants. Further, the experience of being situated in the scanner is novel and stressful for some participants. As such, evaluating cortisol responses requires special care to disentangle the effects of the MRI environment from the socially evaluative stress task.
Finally, the judged math task always preceded the unjudged math task in this protocol. This fixed order was used to ensure that the judged math task was novel to participants given the importance of unpredictability when attempting to elicit a physiological stress response (Dickerson & Kemeny, Reference Dickerson and Kemeny2004). Interestingly, there were small effects linking differences in math performance between judged and unjudged conditions with brain activity. While the associations were limited to parietal regions, they may be important for understanding individual responses to this task in larger samples. In addition to these effects, the lack of counterbalancing further introduces the potential for familiarity or practice effects to be partially responsible for differences in neural activity to the judged and unjudged math conditions. Future researchers may want to consider counterbalancing the conditions; however, it will be important to consider what effect that decision may have on participants’ experience of the stress induction portions of the task.
Future directions
For these initial analyses, we chose to focus on the math portion of the MISTiC. Given the timing of peak cortisol responses to the MISTiC and to the TSST performed outside the scanner, it is assumed that the largest activation of the axis begins during the 5-minute period when the participant is preparing their speech. Thus, it occurs in anticipation of giving the speech. We were able to scan during this time, but have not yet analyzed these data. Since this portion of the task does not contain any consistent event markers, analysis of the speech preparatory period will require one of two approaches. First, an additional active control scan was collected, in which participants engaged in self-referential thought not pertaining to the topic of the speech. Direct statistical comparison of speech preparation to this active control could be completed with a region of interest approach targeting regions thought to be involved in anticipatory stress. This region of interest approach could include examining differences in mean signal between speech preparation and the active control task or could use connectivity approaches that include time-related associations between regions. Second, network-level analyses could be used to evaluate patterns of whole-brain connectivity in cortisol responders and nonresponders during the speech preparation task alone. These approaches might further reveal differences between responders and nonresponders.
In addition to using the MISTiC to evaluate the development of neural systems involved in reactivity to social evaluation as discussed earlier, researchers interested in understanding individual differences in responses to social evaluation could easily probe the links between neural activity and measures of personality. Alternatively, given the link between stress system dysregulation and psychopathology, research using the MISTiC paradigm could investigate differences in neural activity during socially evaluative stress in patient groups compared to healthy controls.
Conclusions
The MISTiC elicits a physiological stress response in early adolescents in a proportion similar to behavioral studies using the TSST-M. However, the MISTiC allows for concurrent acquisition of brain imaging data. This study identified robust task effects in a large number of brain regions, including the anterior cingulate, insula, and a number of sensorimotor and association cortices. Further, preliminary results suggest that individuals who mount a cortisol response to the task may exhibit different patterns of brain activation than those who do not mount such a response. Given these results, the MISTiC paradigm has great potential for use in research addressing a diverse array of questions in the area of stress reactivity and regulation.
Supplementary Material
The supplementary material for this article can be found at https://doi.org/10.1017/S095457942000125X
Acknowledgments
The authors thank the staff, students, and research assistants of Kathleen M. Thomas’ Cognitive Development & Neuroimaging Lab and Megan R. Gunnar's Human Developmental Psychobiology laboratory for help with participant recruitment, scheduling, and testing. Thanks also to Bryon Mueller, who provided technical assistance necessary for the completion of these analyses and Bonny Donzella for training and help with cortisol data. Additional thanks to research participants and their families for their time and effort in this research.
Funding Statement
This research was supported by the National Institute of Health's Eunice Kennedy Shriver National Institute of Child Health and Human Development R01HD095904 (MPIs MRG & KMT), a grant from the Masonic Children's Hospital Research Fund for Neurodevelopment & Child Mental Health Development at the University of Minnesota Medical School (to MRG) and the National Institutes of Health's National Center for Advancing Translational Sciences, grants TL1R002493 and UL1TR002494 (MPH). The content is solely the responsibility of the authors and does not necessarily represent the official views of the National Institutes of Health’s National Center for Advancing Translational Sciences.
Conflicts of Interest
None.