Introduction
Sorghum (Sorghum bicolor (L.) Moench) is one of the most important cereal crops in the semi-arid tropics (SAT) of the world. It is the fifth most important cereal crop worldwide after wheat, rice, maize and barley (FAO, 2004). It serves as a staple food crop for the people living in the semi-arid regions of the world. Besides being a staple food crop, sorghum is being used in a wide range of industries, viz. animal feed, ethanol production, sugar and concentrated sugar syrup, etc., in the developed and developing countries. Sorghum is best known for its adaptation to drought-prone SAT regions with poor soils when compared with other cereal crops. In the light of rapidly increasing human population and expansion of agriculture into marginal areas, the importance of sorghum in semi-arid regions of the world will increase in the future (House, Reference House1995). Under such situation, there will be a continuous demand for sorghum cultivars with broad genetic base, which are high yielding and stable under abiotic and biotic stresses (Appa Rao et al., Reference Appa Rao, Prasada Rao, Mengesha and Gopal Reddy1996).
Genetic diversity of any crop species is fundamental to its survival and for its improvement through plant breeding. Successful development of new cultivars depends largely on the availability of source germplasm with desirable traits such as disease and pest resistance, drought tolerance and improved grain quality. The important objective of plant-breeding programme is the diversification of the genetic base of cultivars, which is achieved by intercrossing the genetic sources of diverse origin. Sorghum is endowed with high variability due to its wide range of adaptation in tropical and temperate climates and free gene exchange among various races. Harlan and De Wet (Reference Harlan and De Wet1972) classified cultivated sorghum into 15 races. These include five primary races, bicolor, caudatum, durra, guinea and kafir, and ten intermediate races originating from possible combinations among the primary races. For utilization of genetic diversity in any crop, adequate evaluation and genetic characterization of the germplasm collection are prerequisites.
In India, systematic effort for the improvement of sorghum was initiated during 1960s by introducing temperate germplasm. Remarkable progress was achieved during the subsequent four decades by diversifying the parental lines through utilization of indigenous and exotic germplasm. Sorghum breeders in India have used germplasm lines belonging to different races (Audilakshmi et al., Reference Audilakshmi, Aruna and Kiran2003), and sorghum yields have been increased by more than 50%. Of late, in India and in the world, the potential yield levels of sorghum are stagnating due to the narrow genetic base utilized in the breeding programmes. There is an urgent need for diversification of the genetic base of the breeding material to break the yield plateau. Improvement in yield can be further brought out by pyramiding the genes responsible for different yield components such as the number of primary branches (PB), the number of secondary branches (SB), the number of grains per panicle, panicle length, width and weight, etc. There are many studies on the association of different panicle components with grain yield (Singh and Baghel, Reference Singh and Baghel1977; Ayana and Bekele, Reference Ayana and Bekele2000). Identification of important agronomic traits for each race/inter-race and incorporating them in the elite background are very important for utilizing the available genetic diversity in sorghum.
The objective of this field experiment was therefore to evaluate sorghum germplasm lines for yield and yield attributes in order to facilitate their use in sorghum improvement.
Material and methods
Plant material
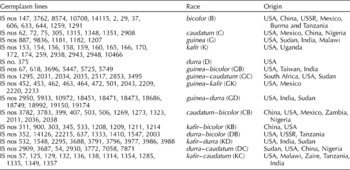
One hundred and thirty-five sorghum germplasm lines belonging to five different races, viz. bicolor (B), durra (D), guinea (G), caudatum (C) and kafir (K), and ten inter-races originating from different countries were selected (genebank at International Crops Research Institute for Semi-arid Tropics, ICRISAT) for this study (Table 1). The standard varieties, viz. CSV 15, 27 B, 296 B, C 43 and Indore 12, were also included. Among these, CSV 15 is a nationally released popular dual-purpose variety; 296 B and 27 B are the female parents of the most popular sorghum hybrids CSH 9 and CSH 16, respectively; and C 43 and Indore 12 are the male parents of the popular sorghum hybrids CSH 16 and CSH 18, respectively.
Passport data of the sorghum germplasm lines utilized in the study during 2002

Experimental method
One hundred and thirty-five sorghum germplasm lines were grown in an augmented randomized complete block design (Federer, Reference Federer1961) consisting of five blocks during the rainy season of the year 2002 at National Research Centre for Sorghum (NRCS), Hyderabad, India.
Out of the 135 germplasm lines, 36 germplasm lines with good performance during 2002 were evaluated in RCBD with four checks (CSV 15, 296 B, C 43 and Indore 12) during rainy season of 2003. Each entry was planted in a single row of 4.5 m length with 0.6 m spacing between the rows. Recommended agronomic practices were followed throughout the crop season during both the years. For every accession, data were recorded on ten plants on the following characters.
Panicle length (PL): The length of the panicle from its base to the tip measured in centimetres.
Panicle width (PWdt): The width of the panicle at the middle of the panicle measured in centimetres.
Primary branch length (PBL): The length of the primary branch from the middle of the panicle measured in centimetres.
Number of primary branches (PB): The total number of primary branches in each panicle counted.
Number of secondary branches (SB): The total number of secondary branches in all the primary branches of a panicle counted.
Grains per primary branch (GPB): The number of grains in the primary branch from the middle of the panicle counted.
Number of grains per unit length of primary branch (GPB/PBL): The number of grains per unit length of primary branch obtained by dividing the GPB with the PBL in each plant.
SB/PB: The number of secondary branches per primary branch obtained by dividing the number of SB with the number of PB in each plant.
100 grain weight (100 GW): Hundred grains counted from each panicle and their weight in grams was ascertained during 2002 only.
Panicle weight (PW): The weight of the panicle from each plant recorded and expressed in grams.
Grain yield (GY): The grain yield from each of the ten individual plants weighed and expressed as grams per plant.
Statistical analysis
All the observations were analysed using Federer's model (Federer, Reference Federer1961) as previously mentioned. The correlation coefficients between grain yield per plant and other traits were calculated for the data collected during the year 2002 (Al-jibouri et al., Reference Al-jibouri, Miller and Robinson1958). The data from the year 2003 were subjected to analysis of variance. The genetic divergence among the germplasm lines used during 2003 was computed by means of Mahalanobis' D2 technique (Mahalanobis, Reference Mahalanobis1930, Reference Mahalanobis1936). The genotypes were grouped into clusters following Tocher's method as described by Rao (Reference Rao1952), and principal component analysis was done (Rao, Reference Rao1964). Analysis was done using the statistical software Windostat (2004).
Results
Mean performance
The results of analysis of variance for yield components of the five standard varieties in 2002 and the selected germplasm lines in 2003 showed that there is variability for all the characters studied. To compare the entries, adjusted values were obtained using the block effect estimated from the standard varieties.
Panicle length: Out of the five checks, 27 B had longest panicles (31.7 cm) followed by CSV 15 (29.6 cm) (Supplementary Table 1, available online only at http://journals.cambridge.org). The germplasm lines IS nos 2, 37, 29, 606 and 1259 belonging to the race bicolor (B) had significantly longer panicles (42.5–61.7 cm) than the best check 27 B during 2002. Germplasm lines (of different races) IS nos 1211, 1214, 1348, 2034, 2948, 8574, 472, 3977 and 453 also had longer panicles (37–40 cm) when compared with 27 B. During 2003, besides IS nos 2, 37, 29, 606, 1214 and 1259, the lines IS nos 399, 2038 (caudatum–bicolor, CB) and 453 (guinea–kafir, GK) also recorded significantly longer panicles (Supplementary Table 2, available online only at http://journals.cambridge.org).
Panicle width: For this important yield component, CSV 15 was the best check (7.92 cm PWdt) followed by C 43 (7.18 cm). The IS nos 506 and 2036 (CB) had significantly higher values than the best check CSV 15. Also, the lines IS nos 5447, 5725, 5749 (GB), 5933 (GD), 1259 (B) and 501 (GK) had wider panicles (>8 cm) when compared with CSV 15. During 2003 also, the lines IS nos 506, 2036, 5725, 5447 and 1259 were found promising when compared with the best check for this trait (Supplementary Table 2, available online only at http://journals.cambridge.org).
Primary branch length: There was large variation for primary branch length (4.7–46.0 cm) in the germplasm studied (Supplementary Table 1, available online only at http://journals.cambridge.org). The lines IS nos 37, 2, 29, 1214, 2038, 606, 399, 633, 3762, 2034, 67, 453, 503, 1211, 3977, 1259, 2908, 1181, 2948, 2035, 472, 3782, 900, 303, 3687 and 3772 had significantly more PBL than that of the best check 27 B (11.75 cm) during 2002. IS nos 37, 2 and 29 belonging to the race bicolor had very long primary branches during both the years (Supplementary Tables 1 and 2, available online only at http://journals.cambridge.org).
Number of primary branches: 296 B (76.8 PB) was the best check, followed by 27 B (64.56 PB) for this trait. The germplasm lines IS nos 1259, 14115 (B), 5447, 5725 (GB) and 1410 (DB) were found to be significantly superior to the best check during 2002 (Supplementary Table 1, available online only at http://journals.cambridge.org). During 2003, the germplasm lines IS nos 1259 and 5447 had significantly higher number of primary branches, while IS no. 5725 was numerically superior to the best check 296 B (Supplementary Table 2, available online only at http://journals.cambridge.org).
Number of secondary branches per panicle: For this important yield component, IS nos 5725 and 5447 (GB) were significantly superior, and IS nos 1259 (B) and 1410 (DB) were numerically superior to the best check CSV 15 (566.5 SB) during 2002 (Supplementary Table 1, available online only at http://journals.cambridge.org). During 2003, only IS no. 5725 had significantly higher number of secondary branches when compared with the best check, while IS nos 5447 and 1259 were numerically superior (Supplementary Table 2, available online only at http://journals.cambridge.org).
Number of grains per primary branch: The germplasm line IS no. 3762 (B) during both years and the lines IS nos 1335 and 399 during 2003 were on par with the best check CSV 15 (129 GPB) for this trait (Supplementary Table 1, available online only at http://journals.cambridge.org). The second best check 27 B showed 93 GPB in 2002. The germplasm line IS no. 3762 was significantly superior, and the lines IS nos 1357 and 1335 were numerically superior to 27 B.
Number of grains per unit length of primary branch: The number of grains per unit length of primary branch is a more appropriate trait that contributes to grain yield. Correlation analysis also showed that the magnitude of association was more between this trait and yield per plant. CSV 15 was the best check for this trait (18.96 GPB/PBL). Even though none of the germplasm lines were found to have more GPB when compared with CSV 15, a few lines like IS nos 3495 (GC), 1357, 138, 57 (KC), 14115 (B) and 10972 (GD) were significantly superior to the second best check C 43 (10.17 GPB/PBL). Other germplasm lines IS nos 1335, 259, 147, 136, 5447, 2517, 5725 and 10708 were also promising for this trait. During 2003 also, IS nos 138, 1357, 5447, 5725, 10708 and 57 were found to be promising.
Number of secondary branches per primary branch: The number of primary branches is an important yield component; however, the number of secondary branches per primary branch would be more appropriate in determining the yield per plant. Among the checks, CSV 15 (8.94 SB/PB) was the best followed by C 43 (7.47 SB/PB) (Table 2). The germplasm line IS no. 1351 (C) (12.54 SB/PB) was the best source for the trait. The lines IS nos 5725 (GC) and 153 (K) were significantly superior when compared with C 43. During 2003, the germplasm lines IS nos 10708, 1335, 170, 506, 7058, 1214 and 5725 were found to be promising.
Correlation coefficients between quantitative characters among the germplasm lines during 2002

PW, panicle weight; PBL, primary branch length; SB, number of secondary branches; PWdt, panicle width; PB, number of primary branches; GPB, grains per primary branch; PL, panicle length; 100 GW, 100 grain weight; GPB/PBL, number of grains per unit length of primary branch; SB/PB, number of secondary branches per primary branch; GY, grain yield per plant. *, **significant at 5% and 1% level, respectively.
100 grain weight: The IS nos 62, 1354, 1314, 75, 2295, 1351, 2517, 3687 and 2853 had significantly higher 100 grain weight when compared with the best check C 43 (2.73 g/100 grain) during 2002. The IS nos 62 (4.42 g) and 1354 (4.06 g) had more than 4 g/100 grains. Most of these germplasm lines belonged either to caudatum race or inter-races with caudatum.
Panicle weight: Panicle weight is highly correlated with grain yield per plant. None of the germplasm lines were found superior to the best check CSV 15 (159.68 g). The lines IS nos 125, 1357 and 10708 were promising with panicles weighing 100–139 g, followed by IS nos 138, 506, 19174, 5725, 3495 and 2853 (>80 g). Many of these belong to inter-races among guinea, caudatum and kafir. During 2003, besides the lines IS nos 10708, 125, 1357 and 5725 (which had high PW during 2002), other lines IS nos 506, 72 and 1291 were also found to be statistically on par with the second best check C 43 (Supplementary Table 2, available online only at http://journals.cambridge.org).
Grain yield per plant: None of the germplasm lines out yielded the best check CSV 15. However, the lines IS nos 125, 1357, 138 (KC) and 10708 (B) out yielded the other four checks and were significantly superior to many of the germplasm lines evaluated during 2002 (Supplementary Table 1, available online only at http://journals.cambridge.org). During 2003 also, the same genotypes performed well (Supplementary Table 2, available online only at http://journals.cambridge.org). Besides these, other germplasm lines, viz. IS nos 19174 (GD), 2853, 3495 (GC), 5725 (GC), 506 (CB), 57 and 1285 (KC), were also found promising.
Correlation studies: In general, correlation coefficients among different characters during 2002 were positive and highly significant (Table 2). Both grain yield per plant and panicle weight showed highly significant positive correlation with GPB/PBL followed by GPB, SB, SB/PB, PWdt, PB, PL and 100 GW. Length of the primary branch showed significant negative correlation with grain yield per plant.
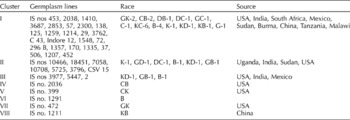
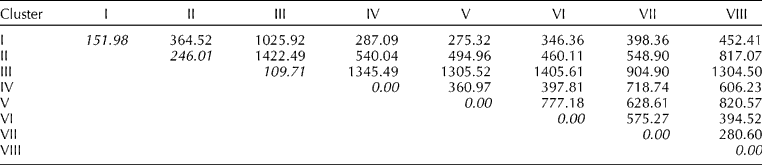
Genetic divergence studies: The 40 sorghum germplasm lines tested during 2003 rainy season were grouped into eight clusters based on D2 values (Table 3). Cluster I had the maximum number of 25 genotypes. The clusters IV–VIII had one genotype each. The parental lines 296 B, C 43 and Indore 12 included in the study fall in cluster I, showing less diversity among them. The variety CSV 15 is in cluster II. The cluster distance ranged from 109.71 to 246.01 within clusters and 275.32–1422.49 between clusters (Table 4), and there is a large variability in the cluster means for different characters (Supplementary Table 1, available online only at http://journals.cambridge.org). The cluster III, which is diverse from other clusters, was found to have high mean values for PL and PBL. Cluster II has high mean values for the traits such as PWdt, PW, the number of primary and secondary branches, GY, GPB/PBL and SB/PB.
Grouping of germplasm lines into different clusters

C, caudatum; B, bicolor; K, kafir; G, guinea; GK, guinea–caudatum; CB, caudatum–bicolor; DB, durra–bicolor; DC, durra–caudatum; GC, guinea–caudatum; KC, kafir–caudatum; KD, kafir–durra; KB, kafir–bicolor; GD, guinea–durra; GB, guinea–bicolor; CK, caudatum–kafir.
Average intra- (Italics) and inter-cluster distances for 40 genotypes of sorghum

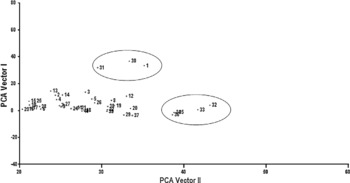
Principle component analysis gave supplementary information on the usefulness of the characters for the definition of the groups (Supplementary Table 4, available online only at http://journals.cambridge.org). The first two principle vectors contributed to 61% of the variance. In the first vector, which accounts for 43% of the variance, the important characters responsible for genetic divergence in the major axis of differentiation were PL, PBL and GPB/PBL. In the second vector (18% of the variation), the important characters responsible for genetic divergence were PWdt, PW, SB and PB.
Discussion
The results of the analysis of variance suggested the existence of significant phenotypic variation between the accessions as a whole for all the traits studied. The studies on analysis of variance and correlation coefficients during the first year of study (2002) identified the promising germplasm lines for the important yield components showing significant positive correlation with yield, like IS nos 1357, 138, 57 and 5447 for GPB/PBL, IS nos 3762 and 1335 for GPB, IS nos 5725, 5447 and 1259 for SB, etc. These identified germplasm lines for different yield components were evaluated during second year of study (2003). The best-performing germplasm lines for different yield components consistently showed good performance in both the years. The evaluated germplasm collection represented a wealth of diversity for the considered traits. Although phenotypic variation was considered, it is likely that this variation is largely genetic and therefore directly usable in breeding programmes. This experiment identified some promising germplasm lines that have a combination of yield components responsible for high yield, for example IS nos 125, 1357, 138 and 10708, for their utilization in breeding. For improving specific yield-attributing traits like long heavy panicle, long primary branches, more secondary branches, bold seed, etc., IS nos 2853, 5725 and 3495 can be utilized.
Significant positive correlation of panicle length with panicle width and length of primary branch supporting the present results was reported by Ayana and Bekele (Reference Ayana and Bekele2000). Positive association of grain yield with PL and SB (Reddy and Rao, Reference Reddy and Rao1971), with panicle weight, width, the number of primaries (Giriraj and Goud, Reference Giriraj and Goud1983), and with grain size (Muppidathi et al., Reference Muppidathi, Paramasivan, Rajarathinam, Sivasamy and Sevagaperumal1999; Veerabadhiran and Kennedy, Reference Veerabadhiran and Kennedy2001) was reported earlier. Within the limit of experimental error and environmental effects, high correlation between characters may show that the characters share some common element of genetic control (pleiotropy, linkage, etc.) between the genes (Thorpe, Reference Thorpe1976; Bekele, Reference Bekele1984). They are also useful in indicating the possibility and limitation of simultaneous selection of desirable characters (Amurrio et al., Reference Amurrio, De Ron and Escribano1993). From this study, it is observed that the number of grains per unit length of primary branch is the most important yield-attributing trait. Also, SB/PB is more important than the number of primary branches for yield improvement. It shows that for improving the grain yield in sorghum, selection should be concentrated on the higher GPB/PBL and SP/PB. The PBL showed negative correlation with GPB/PBL, but highly significant positive correlation with the PL, which in turn has a significant positive association with the yield (though the magnitude is less). If the negative linkage between the primary branch length and GPB/PBL is broken, there is a possibility of getting long primary branches with more GPB/PBL, which ultimately results in increased yields. There is a need to grow large population of F2 from genetically diverse parents to break this negative linkage and identify derivatives with long primary branches with high GPB. Improving the yield of genotypes through selection for different yield components was reported in other cereals like rice, wheat, etc. (Slafer and Andrade, Reference Slafer and Andrade1991; Singh et al., Reference Singh, Sharma, Nank and Sharma2003).
As seen from the cluster analysis, the genetic diversity is not associated with either geographical distribution or botanical races supporting earlier reports (Rohman et al., Reference Rohman, Hakim, Sultana, Kabi, Hasanuzzan and Ali2004; Rana et al., Reference Rana, Yadav, Mandal and Sangeeta2005). The inter-cluster distances were higher than the intra-cluster distances, which indicated wide genetic diversity among the genotypes of different groups than those within same cluster. In general, cluster III showed high inter-cluster distance with all other clusters. Maximum inter-cluster distance was observed between clusters II and III, followed by between clusters III and VI, which suggests that the cultivars from these clusters if chosen for hybridization programme may give high heterotic F1s and broad spectrum of variability in segregating generations. The diversity in the present material was also supported by the appreciable amount of variation among cluster means for different characters. In the present study, some germplasm lines in different clusters that performed well for different yield attributes were identified. The germplasm line IS no. 1259 (cluster I) belonging to the race bicolor was found to have long, broad panicles with more number of primary and secondary branches. The lines IS nos 5447 (cluster III) and 5725 (cluster II) were found to be good sources for PWdt, the number of primary and secondary branches and SP/PB. IS no. 5725 also has more GPB. All these three germplasm lines belong to different cluster groups. Another germplasm line IS no. 2036 (cluster IV) belonging to caudatum–bicolor has broad panicles with more GPB. The lines IS nos 2, 37 and 29 are good sources for long panicles. Using the principle factor scores, all the 40 genotypes (names and numbers assigned are given in Supplementary Table 1, available online only at http://journals.cambridge.org) were plotted for PC1 and PC2, which cumulatively explained 61.27% variability and accounted for the most important characters (Fig. 1). The germplasm lines IS nos 2, 29 and 37 belonging to the primary race bicolor stood out towards high scores on PC1 axis and moderate scores on PC2, thus showing optimum combination of the characters, viz. PL, PBL and GPB/PBL for PC1, and PWdt, PW and PB and SB for PC2. The germplasm lines IS nos 1259 (B), 506 (CB), 5447 (GB), 5725 (GB) and 2036 (CB) that are placed at higher score on PC2 axis have an optimum combination of PWdt, PW and PB and SB. Breeding programme can be designed to utilize these germplasm sources for improving the yield components in the elite lines. Hybrid breeding can also be planned by improving both female and male parents for different yield attributes using diverse germplasm lines. The elite parents in the present study belong to cluster I. Hence, promising germplasm lines from other clusters can be utilized to diversify the genetic base of the parents, and also to improve the parents for specific yield traits. It is likely that if high-performing germplasm lines from clusters II and III are selected for the improvement of male and female parents separately, it would lead to highly heterotic hybrids. The best germplasm lines of cluster II, IS nos 10708 and 5725, can be used for improvement of one parent, and best line from cluster III, IS no. 5447, can be used for the improvement of other parent. Exploitation of genetic diversity within and among these contrasting clusters may provide a rich source of highly productive sorghum genotypes.
Scatter plot of 40 sorghum genotypes based on two principal components.

Almost all sorghum cultivars have the genetic/physiological potential to produce some degree of economic yield, but yield potential varies among cultivars (Miller et al., Reference Miller, Muller, Monk, Murthy and Obilana1996). It is important to determine those traits that directly and indirectly influence yield. Enormous genetic variability for yield components exists in the sorghum germplasm, but the natural character combinations in the landrace are largely unfavourable. However, a much more favourable combination of yield components with higher harvest index and grain yields can be developed. Despite the considerable diversity in the available sorghum germplasm, very few germplasm lines have been utilized. One of the reasons that plant breeders are using less basic germplasm in research is the lack of information on traits of economic importance, which requires replicated multilocational evaluation which is very costly. This can be overcome by developing core collections (Upadhyaya et al., Reference Upadhyaya, Gowda, Buhariwalla and Crouch2006). The core collections, due to the reduced size of germplasm, can be evaluated extensively for traits of economic importance to identify useful germplasm for crop improvement. The diversity among the five basic races and their inter-races needs to be used to broaden the genetic base in order to produce improved cultivars for sustainable agriculture. The caudatum race has been exploited to a large extent in different breeding programmes all over the world. In India, several Indian sorghum breeders have used numerous germplasm lines belonging to different races during the last 30 years. Majority of them belonged to durra–caudatum, durra and caudatum races (Audilakshmi et al., Reference Audilakshmi, Aruna and Kiran2003). There is a need to diversify the breeding material by involving other races. Studies have shown that the guinea race contributes significantly (after caudatum) to higher mean and heterosis for grain yield (Reddy et al., Reference Reddy and Prasada Rao1993). The present study shows that the germplasm lines belonging to guinea, kafir and inter-races with them are good sources for different yield components in addition to caudatum. Thus, attempts may be made to utilize guinea and kafir sorghums.
The enormous variation in the sorghum germplasm would continue to provide breeders with good opportunities for breeding and selections. Exploitation of the genetic variability available in sorghum germplasm for yield components will continue to be emphasized in cultivar development.