I. INTRODUCTION
Tungsten oxide (WO3) is an interesting semiconductor oxide with potential applications in photocatalysts, electrochromic devices, and gas sensors. WO3 possesses a small band gap of 2.4–2.8 eV and presents many advantages for visible light-driven photocatalysis, such as a deep valence band (+3.1 eV), strong absorption within the solar spectrum, stable physicochemical properties, and resilience to photocorrosion.Reference Bamwenda and Arakawa1 The band gap of a semiconductor increases with decreasing particle size and is indicated by an absorption shift toward shorter wavelengths.Reference Henglein2 Nanosized defects may act as electron traps that can lengthen the lifetime of the generated charge carriers and enhance photoactivity. However, if an electron is held within a deep trapping site, it may exhibit a lower redox potential despite having a longer lifetime, thereby decreasing photoreactivity.Reference Hoffmann, Martin, Choi and Bahnemann3 WO3 usually presents lower light energy conversion efficiency than the more widely used titanium oxide (TiO2) because electrons in WO3 have low conduction band levels and lower reduction potentials.
Various methods, including chemical vapor deposition,Reference Zhang, Zhang, Yang, Yu, Zhang, Chang and Javey4 electrochemical deposition,Reference Qi, Tan, Feng and Yu5 sol–gel coating,Reference Zhao, Zhang, Dong, Wang and Yan6 hydrothermal,Reference Ng, Razak and Lockman7 and acid treatmentReference Ng, Razak and Lockman8 have been used to fabricate WO3. The formation of nanostructured WO3 with a large surface area has drawn the interest of many researchers because of the versatility of the resultant material. Nanoporous WO3 is among several widely studied nanostructures. Porous WO3 can be prepared by template-assisted layer-controlled synthesis,Reference Zhang, Duan, Liu, Li, Xu, Dai, Wang and Cai9 template-assisted electrodepositionReference Qi, Tan, Feng and Yu5 and anodization methods.Reference Ng, Razak and Lockman10 The template-assisted layer-controlled synthesis and electrodeposition methods could produce ordered porous WO3, but with large pore diameter size of ∼330 nm and ∼1.5 μm, respectively. On the contrary, the anodization method could not produce ordered porous WO3 as in the template-assisted methods. However, the anodization method could produce pores in nanometer-size (≤100 nm). Mukherjee et al.Reference Mukherjee, Paulose, Varghese, Mor and Grimes11 first reported the preparation of porous WO3 (50–100 nm in diameter) by galvanostatic anodization using an oxalic acid electrolyte. Tsuchiya et al.Reference Tsuchiya, Macak, Sieber, Taveira, Ghicov, Sirotna and Schmuki12 then fabricated self-organized nanoporous WO3 by potentiostatic anodization using a Na2SO4 electrolyte and characterized its photoelectrochemical properties. To the best of our knowledge, formation of segmented nanoporous WO3 has not been reported, and only limited information on self-assembled nanoporous WO3 without cross-sectional observations is available.
The current work aims to investigate the photocatalytic ability of as-anodized and annealed (500 °C for 1 h) nanoporous WO3 synthesized via anodization in an aqueous electrolyte containing various amounts of NH4F (0.07–0.7 g). The photocatalytic property of the catalyst was studied through photodegradation of methyl orange dye by ultraviolet (UV) light.
II. EXPERIMENTAL DETAILS
W foil (>99.95% purity, 0.1 mm thick) was cut into 1 cm × 4 cm and the samples were cleaned using ethanol and acetone prior to anodization. Anodization was conducted using an anode–cathode (W–platinum) system with an applied DC voltage of 40 V. Anodization was performed for 1 h in an electrolyte consisting of 1 M Na2SO4 and various amounts of NH4F (0.07, 0.1, 0.3, 0.5, and 0.7 g). The electrolyte was adjusted to pH 3 by the addition of H2SO4 and constantly stirred at room temperature during anodization. Afterward, the samples were rinsed with deionized water and annealed at 500 °C in air for 1 h to induce crystallization of WO3. Three samples have been prepared for each amount of NH4F.
The morphologies of the samples were observed using field emission scanning electron microscopy (FESEM; Zeiss SUPRA 35, Carl Zeiss, Jena, Germany) and transmission electron microscopy (TEM; Philips CM 12, FEI Company, Amsterdam, The Netherlands) systems. The phases present in the samples were analyzed using an X-ray diffractometer (XRD; Bruker AXS D8 ADVANCE, Bruker Corporation, Billerica, Massachusetts) equipped with Cu Kα radiation. The Raman and photoluminescence (PL) spectrometer (Horiba Jobin Yvon 800 UV, HORIBA Scientific Instruments & Systems, Kyoto, Japan) equipped with 532 nm laser source was used to study the structural and optical properties of the samples. The photocatalytic activity of the nanoporous samples was evaluated through degradation of methyl orange solution with an initial concentration of 30 ppm. The methyl orange solution was photo-irradiated by 120 W UV light for 5 h. Degradation rates were measured with a UV-visible (UV-vis) spectrophotometer (Varian Cary 50 Conc, Varian Inc., Santa Clara, California) at 200–800 nm.
III. RESULTS AND DISCUSSION
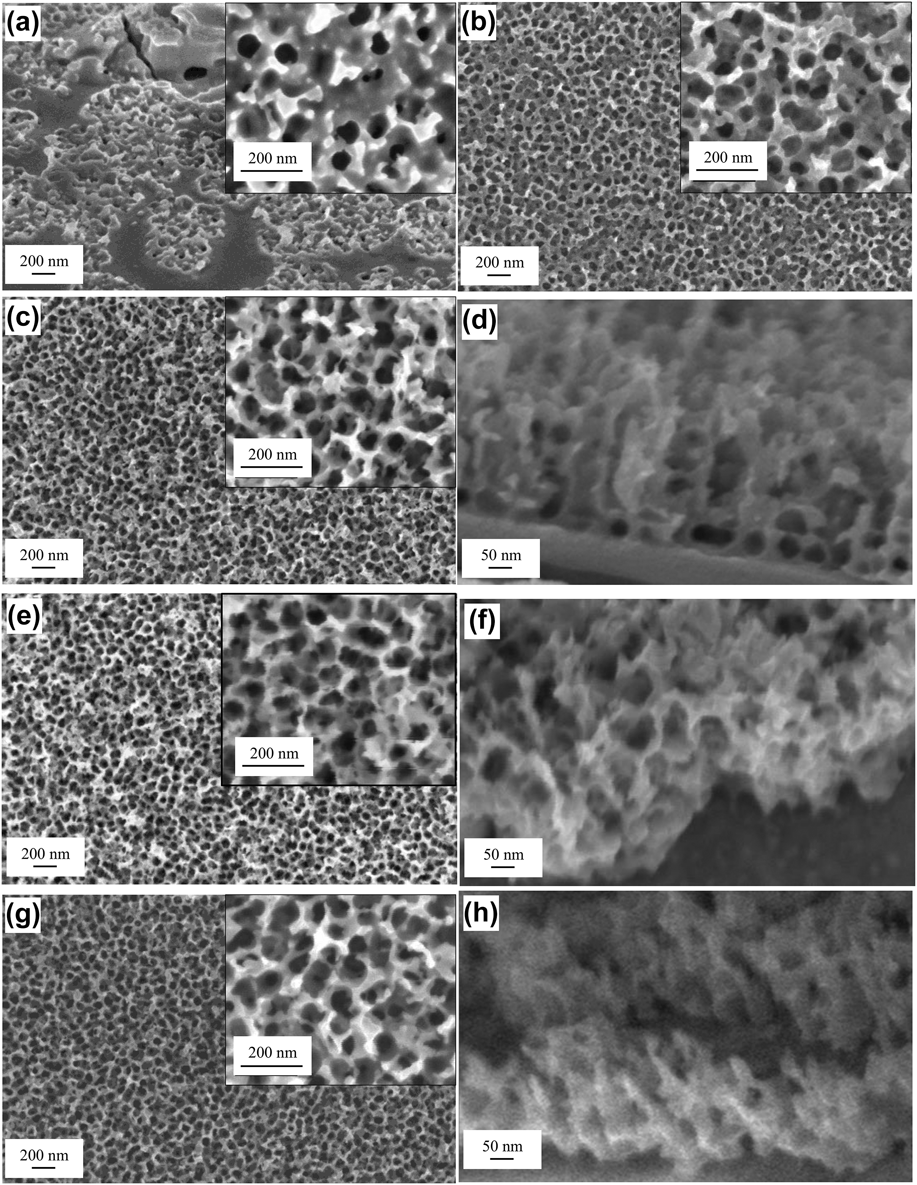
The F− concentration in the electrolyte significantly affects the morphology of the porous anodic oxide because F− enhances the chemical dissolution of WO3, leading to porous oxide formation. Figures 1(a)–1(c), 1(e), and 1(g) show the surface images of samples anodized with 0.07, 0.1, 0.3, 0.5, and 0.7 g of NH4F, respectively, while Figs. 1(d), 1(f), and 1(h) show the cross-sectional views of the samples. The cross-sectional views of the samples anodized with 0.07 and 0.1 g of NH4F could not be obtained because the porous layers were extremely thin (<20 nm). Porous structures were formed on parts of the sample surface when 0.07 g of NH4F was added to the electrolyte [Fig. 1(a)]. The pores were circular in shape with diameters ranging from 50–80 nm. More pores were formed by increasing the NH4F to 0.1 g [Fig. 1(b)]. By increasing the amount of NH4F to 0.3–0.7 g, nanoporous structures were formed on the entire sample surface [Figs. 1(c)–1(h)]. Despite the surface morphology of the present samples resembling that of TiO2 nanotubes, however, cross-sectional images show segmented porous structures in contrast to the nanotubular cross section of TiO2. The sample anodized with 0.3 g NH4F has a porous layer thickness of 400 nm [Fig. 1(d)]. The porous layer thickness did not increase with the increasing amount of NH4F (0.5 and 0.7 g) as shown in Figs. 1(f) and 1(h). Since thicker porous layer results in larger surface area, the optimum NH4F amount to achieve uniform segmented nanoporous WO3 formation is 0.3 g. The TEM images of the nanoporous film are shown in Fig. 2. The circular pores and segmented structure of the nanoporous film can be clearly seen in the images.
FESEM images of nanoporous film produced with various amounts of NH4F: (a) 0.07 g, (b) 0.1 g, (c and d) 0.3 g, (e and f) 0.5 g, and (g and h) 0.7 g. Insets indicate higher-magnification images.

TEM images of nanoporous film produced with 0.3 g of NH4F: (a) surface and (b) cross-section.
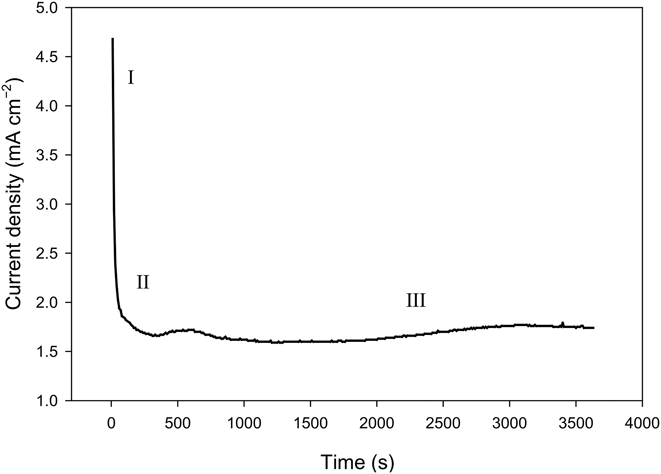
To discuss the effect of various parameters on the resultant material, formation mechanism of segmented nanoporous WO3 must first be understood. Figure 3 shows the curve of current density versus time during the anodization process. WO3 anodization occurs in three stages, similar to previous reports on various porous systems. An abrupt decrease in current can be seen at the early stage of anodization (stage I), the current then increases slightly (stage II), and lastly maintains a constant value (stage III). Current decay during stage I is caused by passivation, where the interaction of W6+ and O2− during anodization [Eq. (1)] causes an amorphous WO3 barrier layer to form on the W substrate [Fig. 4(a)]. The oxide layer has a double-layer structure: the inner layer is anhydrous WO3 layer and the outer layer is hydrated WO3 layer (WO3·H2O), as represented in Eq. (2).Reference Pérez and López Teijelo13 The barrier layer then thickens with prolonging anodization process. WO3 growth involves the inward migration of oxygen-containing ions (O2−/OH−) from the electrolyte through the barrier layer and the outward flow of W6+ ions from W substrate.
 $${{\rm{W}}^{6 + }} + 3{{\rm{O}}^{2 - }} \to {\rm{W}}{{\rm{O}}_3}\quad ,$$
 $${\rm{W}}{{\rm{O}}_3} + {{\rm{H}}_2}{\rm{O}} \to {\rm{W}}{{\rm{O}}_3} \cdot {{\rm{H}}_2}{\rm{O}}\quad {\rm{.}}$$
Current density versus time curve during anodization of W for the formation of nanoporous WO3 with 0.3 g of NH4F.
Schematic diagram of segmented nanoporous WO3 formation mechanism: (a) amorphous oxide layer formation, (b) pit formation, (c) crack formation, (d) crack-heal event, (e) segmented nanoporous structure formation, and (f) typical FESEM image of segmented nanoporous structure.
When a voltage is continuously applied to W, it establishes a large electric field across the compound. The electric field is greatly affected by the surface morphology of WO3 and thus resulted in a nonuniform current distribution on the sample surface [Fig. 4(b)]. Areas on the surface with the most intense electric fields will be dissolved through field-assisted dissolution, and resulted in the pit formation. On the other hand, oxide growth at the metal|oxide interface increases with increasing field-assisted oxide dissolution because of the dynamic equilibrium between the rates of field-assisted oxide dissolution and oxide formation.Reference Sulka and Eftekhari14
Once pits are formed, pores begin to grow because of the chemical-induced oxide dissolution. The F− and H+ ions in the electrolyte react with WO3 and produce a fluoride complex [Eq. (3)]. This reaction dissolves WO3 and thus deepens and widens the pits, forming pores. The pore formation causes the current to increase slightly as denoted in Fig. 3; stage II. The anodization (anodic oxidation) of W occurs simultaneously, and the process grew inward. When balance between chemical dissolution and oxide layer growth is achieved, a steady state is established in the reaction system and the current reaches a constant value (Fig. 3; stage III). At stage III, nanoporous WO3 growth occurs. However, unlike common ordered nanoporous WO3, nanoporous WO3 formed in this work is segmented because of crack-heal event [Fig. 4(c)]. During oxide layer growth, localized stress is generated in hemispherical pores. Cracks will then form on the film but are eventually healed by WO3 formation because of the outward diffusion of W6+ from WO3 at the film|electrolyte interface [Fig. 4(d)]. When W6+ diffuses outward, the protruding WO3 regrows and upon meeting, closes into a hemispherical region, and forms a segment [Fig. 4(e)]. Figure 4(f) shows a typical FESEM image of the segmented nanopores. Crack-heal event was first reported by ThompsonReference Thompson15 during the synthesis of hemispherical porous oxide through the use of an anodic alumina.
 $${\rm{W}}{{\rm{O}}_3} + 8{{\rm{F}}^ - } + 6{{\rm{H}}^ + } \to {\left[ {{\rm{W}}{{\rm{F}}_8}} \right]^{2 - }} + {{\rm{H}}_2}{\rm{O}}\quad {\rm{.}}$$
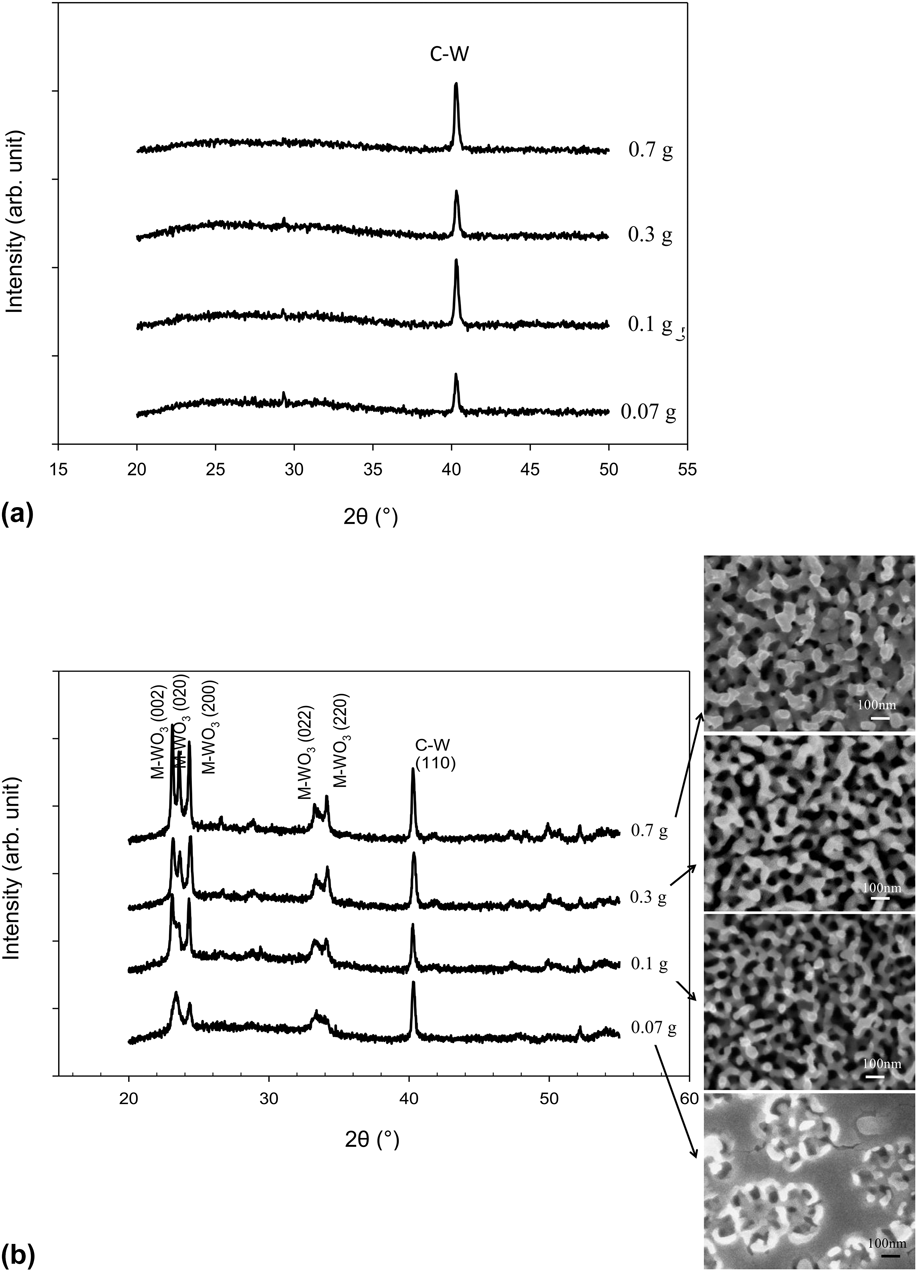
The XRD patterns of the as-anodized nanoporous samples are shown in Fig. 5(a). Only C–W (cubic–tungsten) peaks from the W foil substrate were observed in the samples; this finding reveals the amorphous behavior of as-anodized WO3. Samples were subsequently heat treated to induce crystallinity in WO3 [Fig. 5(b)]. Peaks matching those of monoclinic WO3 (ICDD no. 00-043-1035) were observed after annealing. The annealed film produced with 0.07 g NH4F contained two WO3 peaks at 2θ = 22–26° and one WO3 peak at 2θ = 32–36°. However, these WO3 peaks became more apparent with increasing amount of NH4F, where three WO3 peaks were formed at 2θ = 22–26° and two WO3 peaks were formed at 2θ = 32–36°. Moreover, the intensity of WO3 peaks increased with increasing amount of NH4F. The surface morphologies of respective annealed nanoporous WO3 are shown on the right side of Fig. 5(b). Oxide growth during the annealing process caused pore walls to grow thicker.
XRD patterns of nanoporous films produced with various amounts of NH4F: (a) as-anodized and (b) annealed. Insets are FESEM images of respective annealed nanoporous films.
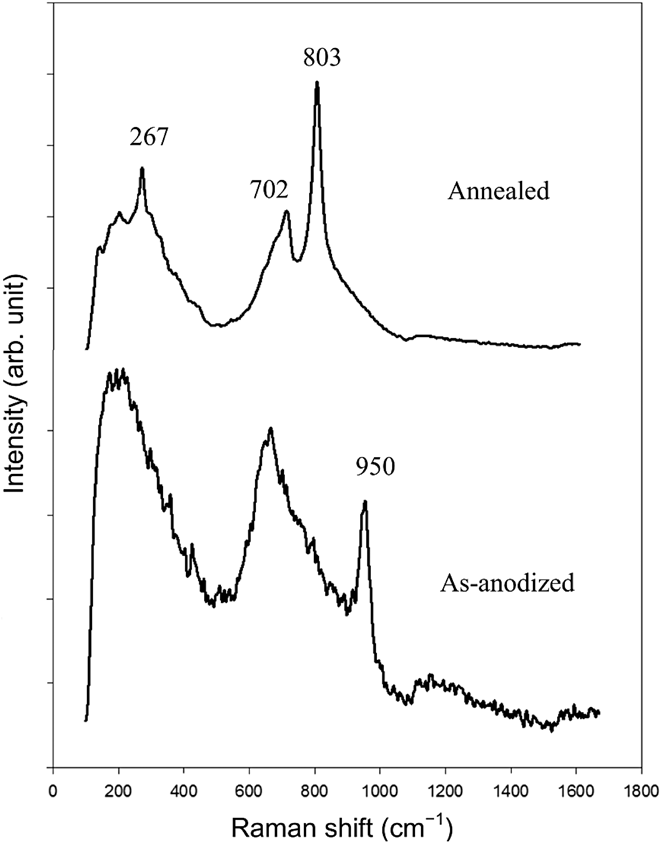
The Raman spectra of as-anodized and annealed samples are shown in Fig. 6. The as-anodized WO3 shows two broad peaks at 100–350 and 600–850 cm−1, as well as a sharp peak at 950 cm−1. The peak at 100–350 cm−1 corresponds to the deformation vibration of O–W–O bond and the peak at 600–850 cm−1 is attributed to the stretching vibration of W–O bond. The peak at 950 cm−1 belongs to the W=O stretching mode of terminal oxygen atoms present on the surface of the cluster and microvoid structures in the film.Reference Lethy, Beena, Vinod Kumar, Mahadevan Pillai, Ganesan, Sathe and Phase16 These peaks ascribed to amorphous hydrated WO3 and Bittencourt et al.Reference Bittencourt, Landers, Llobet, Correig and Calderer17 observed similar peaks on WO3 grown by radio frequency (RF) sputtering. After annealing, peaks at 267, 702, and 803 cm−1 were present and the peaks became narrower, indicating an increase in crystallinity. The peak at 267 cm−1 corresponds to the O–W–O bending modes of bridging oxygen, whereas those at 702 and 803 cm−1 are the corresponding stretching modes.Reference Bittencourt, Landers, Llobet, Correig and Calderer17,Reference Trasferetti, Rouxinol, Gelamo, Bica de Moraes, Davanzo and de Faria18 The broad peak at 600–700 cm−1 is a feature of nanocrystalline phase in the anodic film. The peak at 950 cm−1 (stretching mode) was not visible in the annealed sample, revealing the formation of crystalline stoichiometric WO3 film.Reference Lethy, Beena, Vinod Kumar, Mahadevan Pillai, Ganesan, Sathe and Phase16 All these peaks are assigned to monoclinic WO3, which is in good agreement with the XRD result [Fig. 5(b)].
Raman spectra of as-anodized and annealed WO3 samples made with 0.3 g of NH4F.
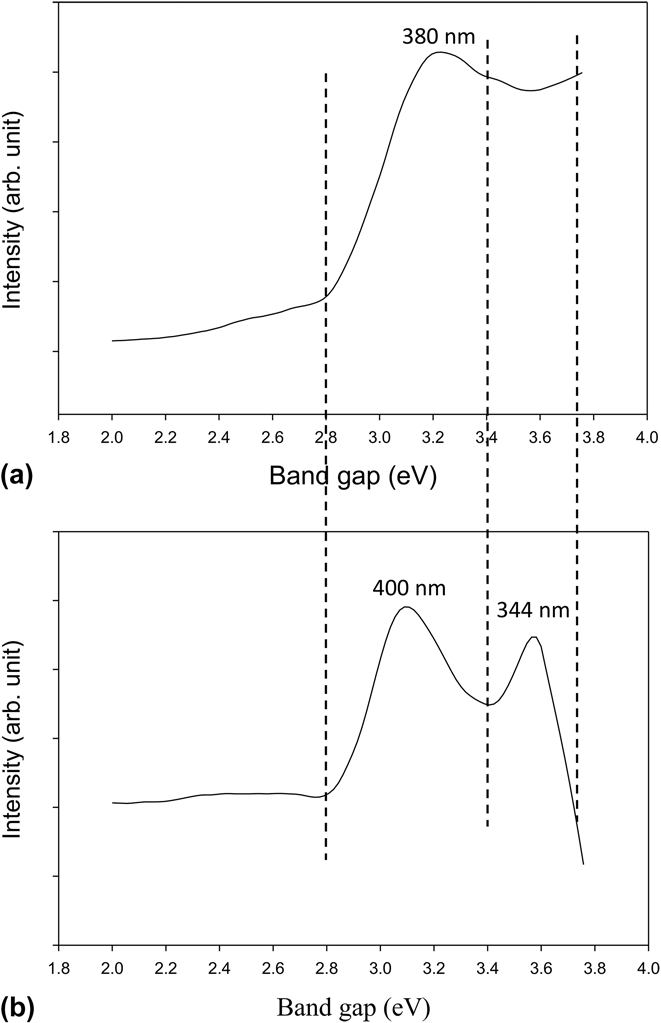
The PL spectra of as-anodized and annealed WO3 are shown in Figs. 7(a) and 7(b), respectively. The as-anodized sample [Fig. 7(a)] shows several small and broad peaks centered at 380 nm (3.3 eV), corresponding to the UV emission of the sample (340–365 nm). Small peaks are formed as a result of differences in the levels of defect states in the amorphous sample. Two intense peaks centered at 400 nm (3.1 eV) and 344 nm (3.6 eV) for the annealed sample [Fig. 7(b)] are assigned to UV (340–365 nm) and blue (465–440 nm) emissions. The blue emission can be attributed to indirect band-to-band transitions of WO3 and the UV emission could arise from defect states of WO3.Reference Wang, Lee and Ma19,Reference Niederberger, Bartl and Stucky20 The band gaps of the as-anodized and annealed samples were observed at 3.3 and 3.1 eV, respectively, which are in accordance with the band gap value of self-assembled nanoporous WO3.Reference Guo, Quan, Lu, Zhao and Chen21
PL spectra of (a) as-anodized and (b) annealed WO3 samples made with 0.3 g of NH4F.
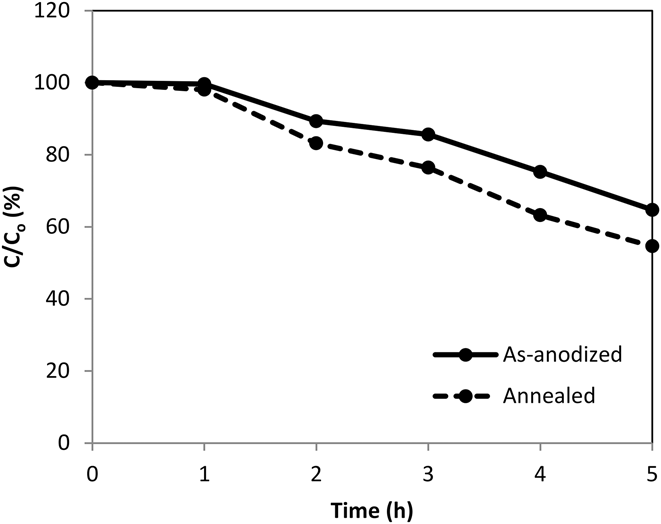
The photocatalytic degradation of methyl orange solution with as-anodized and annealed WO3 is shown in Fig. 8. The annealed sample achieved higher degradation of methyl orange solution than as-anodized sample. The lower photocatalytic ability of the as-anodized sample was because of the amorphous structure.Reference Sánchez Martínez, Martínez-de la Cruz and López Cuéllar22 Amorphous and crystalline WO3 feature different physical properties. Amorphous WO3 has a disordered structure and decreases in disordered structure in the crystalline WO3 cause a decline in defects and consequent reductions in the number of available electron–hole recombination centers. Hence, charge transfers occur more easily in the crystalline WO3 and higher decomposition rates of methyl orange solution is expected.Reference Wang, Xu and Wang23
Photocatalytic degradation of methyl orange solution using nanoporous WO3 produced with 0.3 g of NH4F.
IV. CONCLUSIONS
Segmented nanoporous WO3 with diameters of 50–80 nm and a porous layer thickness of 400 nm were formed on the entire sample surface by adding 0.3 g of NH4F to the anodization electrolyte. The nanoporous WO3 only formed at parts of the sample surface by adding <0.3 g of NH4F and the porous layer thickness did not increase with the addition of >0.3 g of NH4F. The segmented nanoporous WO3 was formed by field-assisted oxide formation, field-assisted oxide dissolution, chemical-induced oxide dissolution, and crack-heal event. The as-anodized and annealed samples have band gaps of 3.3 and 3.1 eV, respectively. The annealed sample exhibits better photocatalytic ability than as-anodized sample.
ACKNOWLEDGMENT
The authors are grateful to the financial support provided by Long Term Research Grant Scheme (OneBAJA Project 304/PBAHAN/6050235) from the Ministry of Higher Education Malaysia.