1 Introduction
Immersion in a liquid bath (dip-coating) is a simple and efficient coating process, which is widely used across food, health, textile or plastic industries (Schweizer & Kistler Reference Schweizer and Kistler1997; Weinstein & Ruschak Reference Weinstein and Ruschak2004). In its simplest version, a plate withdrawn vertically from the bath with a constant velocity
 $U$
entrains a uniform liquid film. For a Newtonian liquid with viscosity
 $\unicode[STIX]{x1D702}_{0}$
, density
 $\unicode[STIX]{x1D70C}$
and surface tension
 $\unicode[STIX]{x1D70E}$
, the film thickness
 $h_{0}$
depends on the capillary number
 $Ca=\unicode[STIX]{x1D702}_{0}U/\unicode[STIX]{x1D70E}$
and length
 $\ell =\sqrt{\unicode[STIX]{x1D70E}/\unicode[STIX]{x1D70C}g}$
, where
 $g$
is the acceleration due to gravity. Provided
 $Ca$
and
 $\unicode[STIX]{x1D70C}Uh_{0}/\unicode[STIX]{x1D702}_{0}$
are both smaller than 1, it follows that
 $$\begin{eqnarray}h_{0}\simeq 0.95\ell Ca^{2/3},\end{eqnarray}$$
as derived by Landau & Levich (Reference Landau and Levich1942), Derjaguin (Reference Derjaguin1943) and validated experimentally since then (Morey Reference Morey1940; van Rossum Reference van Rossum1958; Groenveld Reference Groenveld1970; Lee & Tallmadge Reference Lee and Tallmadge1974; Kizito, Kamotani & Ostrach Reference Kizito, Kamotani and Ostrach1999; Snoeijer et al. Reference Snoeijer, Ziegler, Andreotti, Fermigier and Eggers2008; Maleki et al. Reference Maleki, Reyssat, Restagno, Quéré and Clanet2011).
For a particle-laden liquid, a supplementary length – the particle diameter
 $d$
– is introduced and different rheology (Guazzelli & Pouliquen Reference Guazzelli and Pouliquen2018) and surface conditions (Kralchevsky & Nagayama Reference Kralchevsky and Nagayama1994) are expected. Motivated by film deposition and self-assembly of colloids for surface patterning, lithography or optical applications (Yu & Zhang Reference Yu and Zhang2013), much attention has been devoted to colloidal particles suspended in a volatile liquid, for which evaporation is often a dominant factor (Dimitrov & Nagayama Reference Dimitrov and Nagayama1996; Buchanan et al.
Reference Buchanan, Molenaar, de Villiers and Evans2007; Ghosh, Fan & Stebe Reference Ghosh, Fan and Stebe2007; Le Berre, Chen & Baigl Reference Le Berre, Chen and Baigl2009; Faustini et al.
Reference Faustini, Louis, Albouy, Kuemmel and Grosso2010; Jing et al.
Reference Jing, Bodiguel, Doumenc, Sultan and Guerrier2010; Brewer et al.
Reference Brewer, Shibuta, Francis, Kumar and Tsapatsis2011; Berteloot et al.
Reference Berteloot, Daerr, Lequeux and Limat2013; Jung & Ahn Reference Jung and Ahn2013). However, much fewer studies have considered suspensions of larger particles (
 ${\sim}100~\unicode[STIX]{x03BC}\text{m}$
) or low-volatility liquids (Kao & Hosoi Reference Kao and Hosoi2012; Colosqui, Morris & Stone Reference Colosqui, Morris and Stone2013; Gans et al.
Reference Gans, Dressaire, Colnet, Saingier, Bazant and Sauret2019). In these cases the thickness, particle content and structure of the coating remain to be characterized over the full range of withdrawal velocity and volume fraction.
We focus here on the case of a viscous flow for non-Brownian, monodisperse and neutrally buoyant spherical particles, and experimentally study how the liquid and solid contents of the coating depend on
 $U$
for different particle sizes (
 $80~\unicode[STIX]{x03BC}\text{m}\leqslant d\leqslant 550~\unicode[STIX]{x03BC}\text{m}$
) and volume fractions (
 $0.10\leqslant \unicode[STIX]{x1D719}\leqslant 0.50$
). We present the experimental protocol in § 2, discuss general observations, the different coating regimes and their boundaries in § 3, and conclude in § 4.
2 Experimental set-up
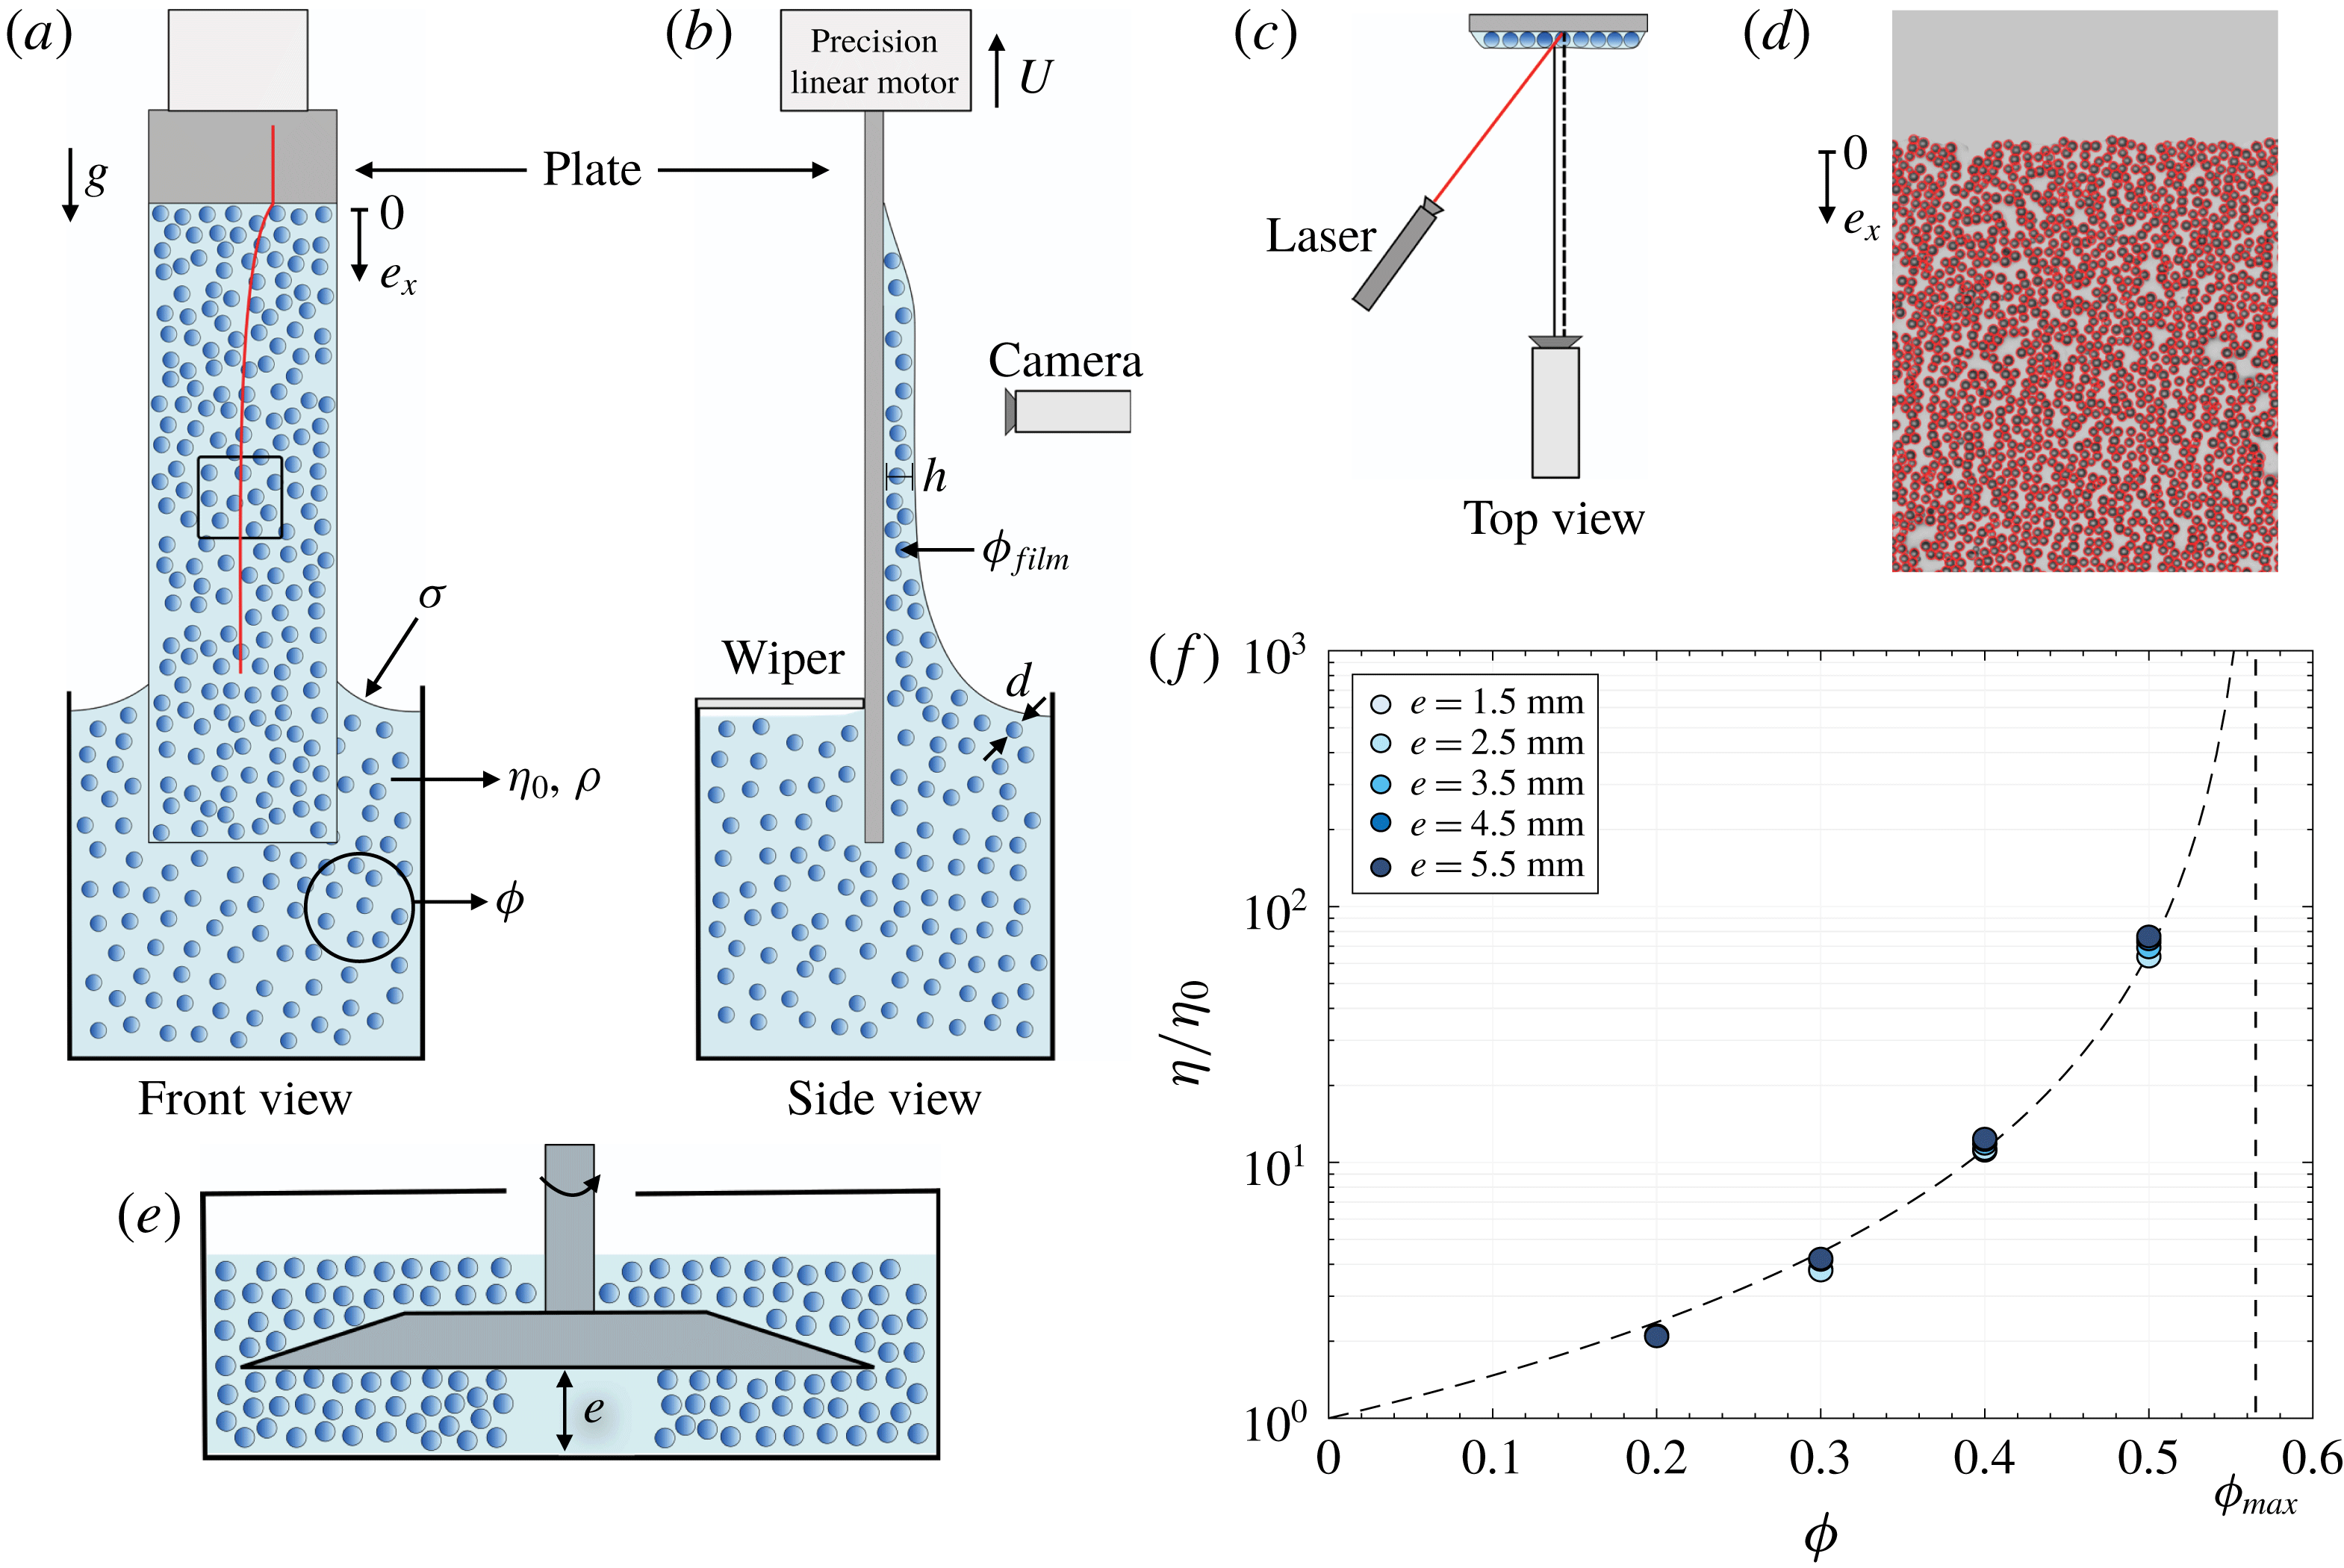
(a–c) Schematics of the experimental set-up and laser profilometry measurement technique used for ‘thick’ films (
 $h\gtrsim d$
). (d) Snapshot illustrating the particle tracking used to count the particles in ‘thin’ films (
 $h\sim d$
). (e) Schematics of the large gap plate/plate shear cell used to measure the shear viscosity of the suspension. (f) Relative effective shear viscosity
 $\unicode[STIX]{x1D702}/\unicode[STIX]{x1D702}_{0}$
of the suspensions measured for different values of the cell gap
 $e$
(
 $d=145~\unicode[STIX]{x03BC}\text{m}$
,
 $\unicode[STIX]{x1D702}_{0}=100~\text{mPa}~\text{s}$
). The dashed line indicates the correlation
 $\unicode[STIX]{x1D702}/\unicode[STIX]{x1D702}_{0}=(1-\unicode[STIX]{x1D719}/\unicode[STIX]{x1D719}_{max})^{-2}$
(Guazzelli & Pouliquen Reference Guazzelli and Pouliquen2018) with
 $\unicode[STIX]{x1D719}_{max}\approx 0.57$
.

The experimental set-up is sketched in figure 1. It consists of a bath of a viscous suspension of solid and neutrally buoyant particles, from which a plate is withdrawn vertically with a controlled velocity. The particles are spherical polystyrene particles (Dynoseeds TS, Microbeads) with a mean diameter
 $d=80$
, 145 or
 $550~\unicode[STIX]{x03BC}\text{m}$
and a low relative standard deviation in size (
 ${\leqslant}8\,\%$
) obtained by repeated sieving. The liquid is a water solution of PEGPG (
 $3.9~\text{kg}~\text{mol}^{-1}$
poly(ethylene glycol-ran-propylene glycol)-monobutyl-ether by Sigma-Aldrich) and 4 wt% zinc chloride, which matches the particle density (
 $\unicode[STIX]{x1D70C}=1050~\text{kg}~\text{m}^{-3}$
) and wets the particles totally. Its viscosity
 $\unicode[STIX]{x1D702}_{0}$
is varied between 2 mPa s and 100 mPa s by adjusting the PEGPG concentration (from 4 wt% to 45.5 wt%), whereas its surface tension
 $\unicode[STIX]{x1D70E}$
varies only weakly between
 $38~\text{mN}~\text{m}^{-1}$
and
 $47~\text{mN}~\text{m}^{-1}$
. The particle volume fraction
 $\unicode[STIX]{x1D719}$
of the suspension is varied between 0.10 and 0.50. For all the experiments, the Reynolds number
 $\unicode[STIX]{x1D70C}hU/\unicode[STIX]{x1D702}_{0}$
(based on (1.1)) remains lower than
 ${\sim}0.1$
and the capillary number
 $Ca$
is varied between
 $10^{-4}$
and
 $10^{-1}$
.
The suspension is prepared and homogenized by immersing the particles in small quantities and mixing thoroughly, but slowly, to avoid air entrapment, before it is poured up to the top of the dipping container. The plate is a smooth glass plate having a width of 26 mm and a thickness of 1.2 mm, which is well wetted by the suspending liquid (the receding and advancing contact angles are
 ${\approx}5^{\circ }$
and
 ${\approx}35^{\circ }$
, respectively, for all the liquids). Above the particle-entrainment threshold we also use a PMMA plate, which allows a sampling of the coated film (see § 3.4), without any observable difference on the coating. The plate is held and displaced vertically with a precision translation stage (M414.1PD, PI), while the bath remains in a fixed position. It is slowly dipped in the suspension bath over a length of 50 mm and withdrawn with a constant vertical velocity
 $U$
, which is varied between
 $0.03~\text{mm}~\text{s}^{-1}$
and
 $13~\text{mm}~\text{s}^{-1}$
. Before each dipping, the plate is cleaned and dried, and the suspension is re-homogenized by gentle stirring.
The coating of the plate is monitored from a front view with a digital camera and 60 mm macrolens, resulting in a spatial resolution down to
 $35~\unicode[STIX]{x03BC}\text{m}$
. Depending on the opacity of the coating we measure either the average film thickness using a laser profilometry technique or the particle surface concentration from the tracking of each particle. Both techniques provide local and instantaneous measurements. This allows one to characterize the coating in situ, without any edge effect or influence of the postcoating drainage. The first technique uses the transverse displacement of the intersection between an inclined laser sheet and the coating film surface (see figure 1
a–c). It yields a measurement of the average coating thickness (independently of its solid content) with a precision of the order of the laser sheet thickness (
 $\simeq 35~\unicode[STIX]{x03BC}\text{m}$
) or a fraction of the particle size, and is mainly used for thick coatings. The second technique consists in detecting each particle entrained on the front side of the plate from shadowgraph pictures obtained with a cold backlighting – the rear side of the plate is kept free of particles with the help of a wiper, see figure 1(b,d). It is available for coatings thinner than two particle diameters and only gives access to the solid content of the coating. To obtain information about both the liquid and solid content, these two techniques are complemented with sampling and weighing measurements of the coating, which will be detailed in §§ 3.2 and 3.4.
Finally, the effective shear viscosity of each suspension is measured with a rotating rheometer (Anton Paar MCR 501) in a plate/plate device allowing a large cell gap
 $e\gg d$
, which is varied between 1.5 mm and 5.5 mm (see figure 1(a) and details in Château & Lhuissier (Reference Château and Lhuissier2019)), at the same temperature (
 $24\,^{\circ }\text{C}$
) as the coating experiments. Figure 1(f) presents the measurements of the relative shear viscosity
 $\unicode[STIX]{x1D702}/\unicode[STIX]{x1D702}_{0}$
for the different particle volume fractions we have used. They are found to be independent of the gap
 $e$
and consistent with values reported in the literature (Guazzelli & Pouliquen Reference Guazzelli and Pouliquen2018).
3 Results
3.1 General observations
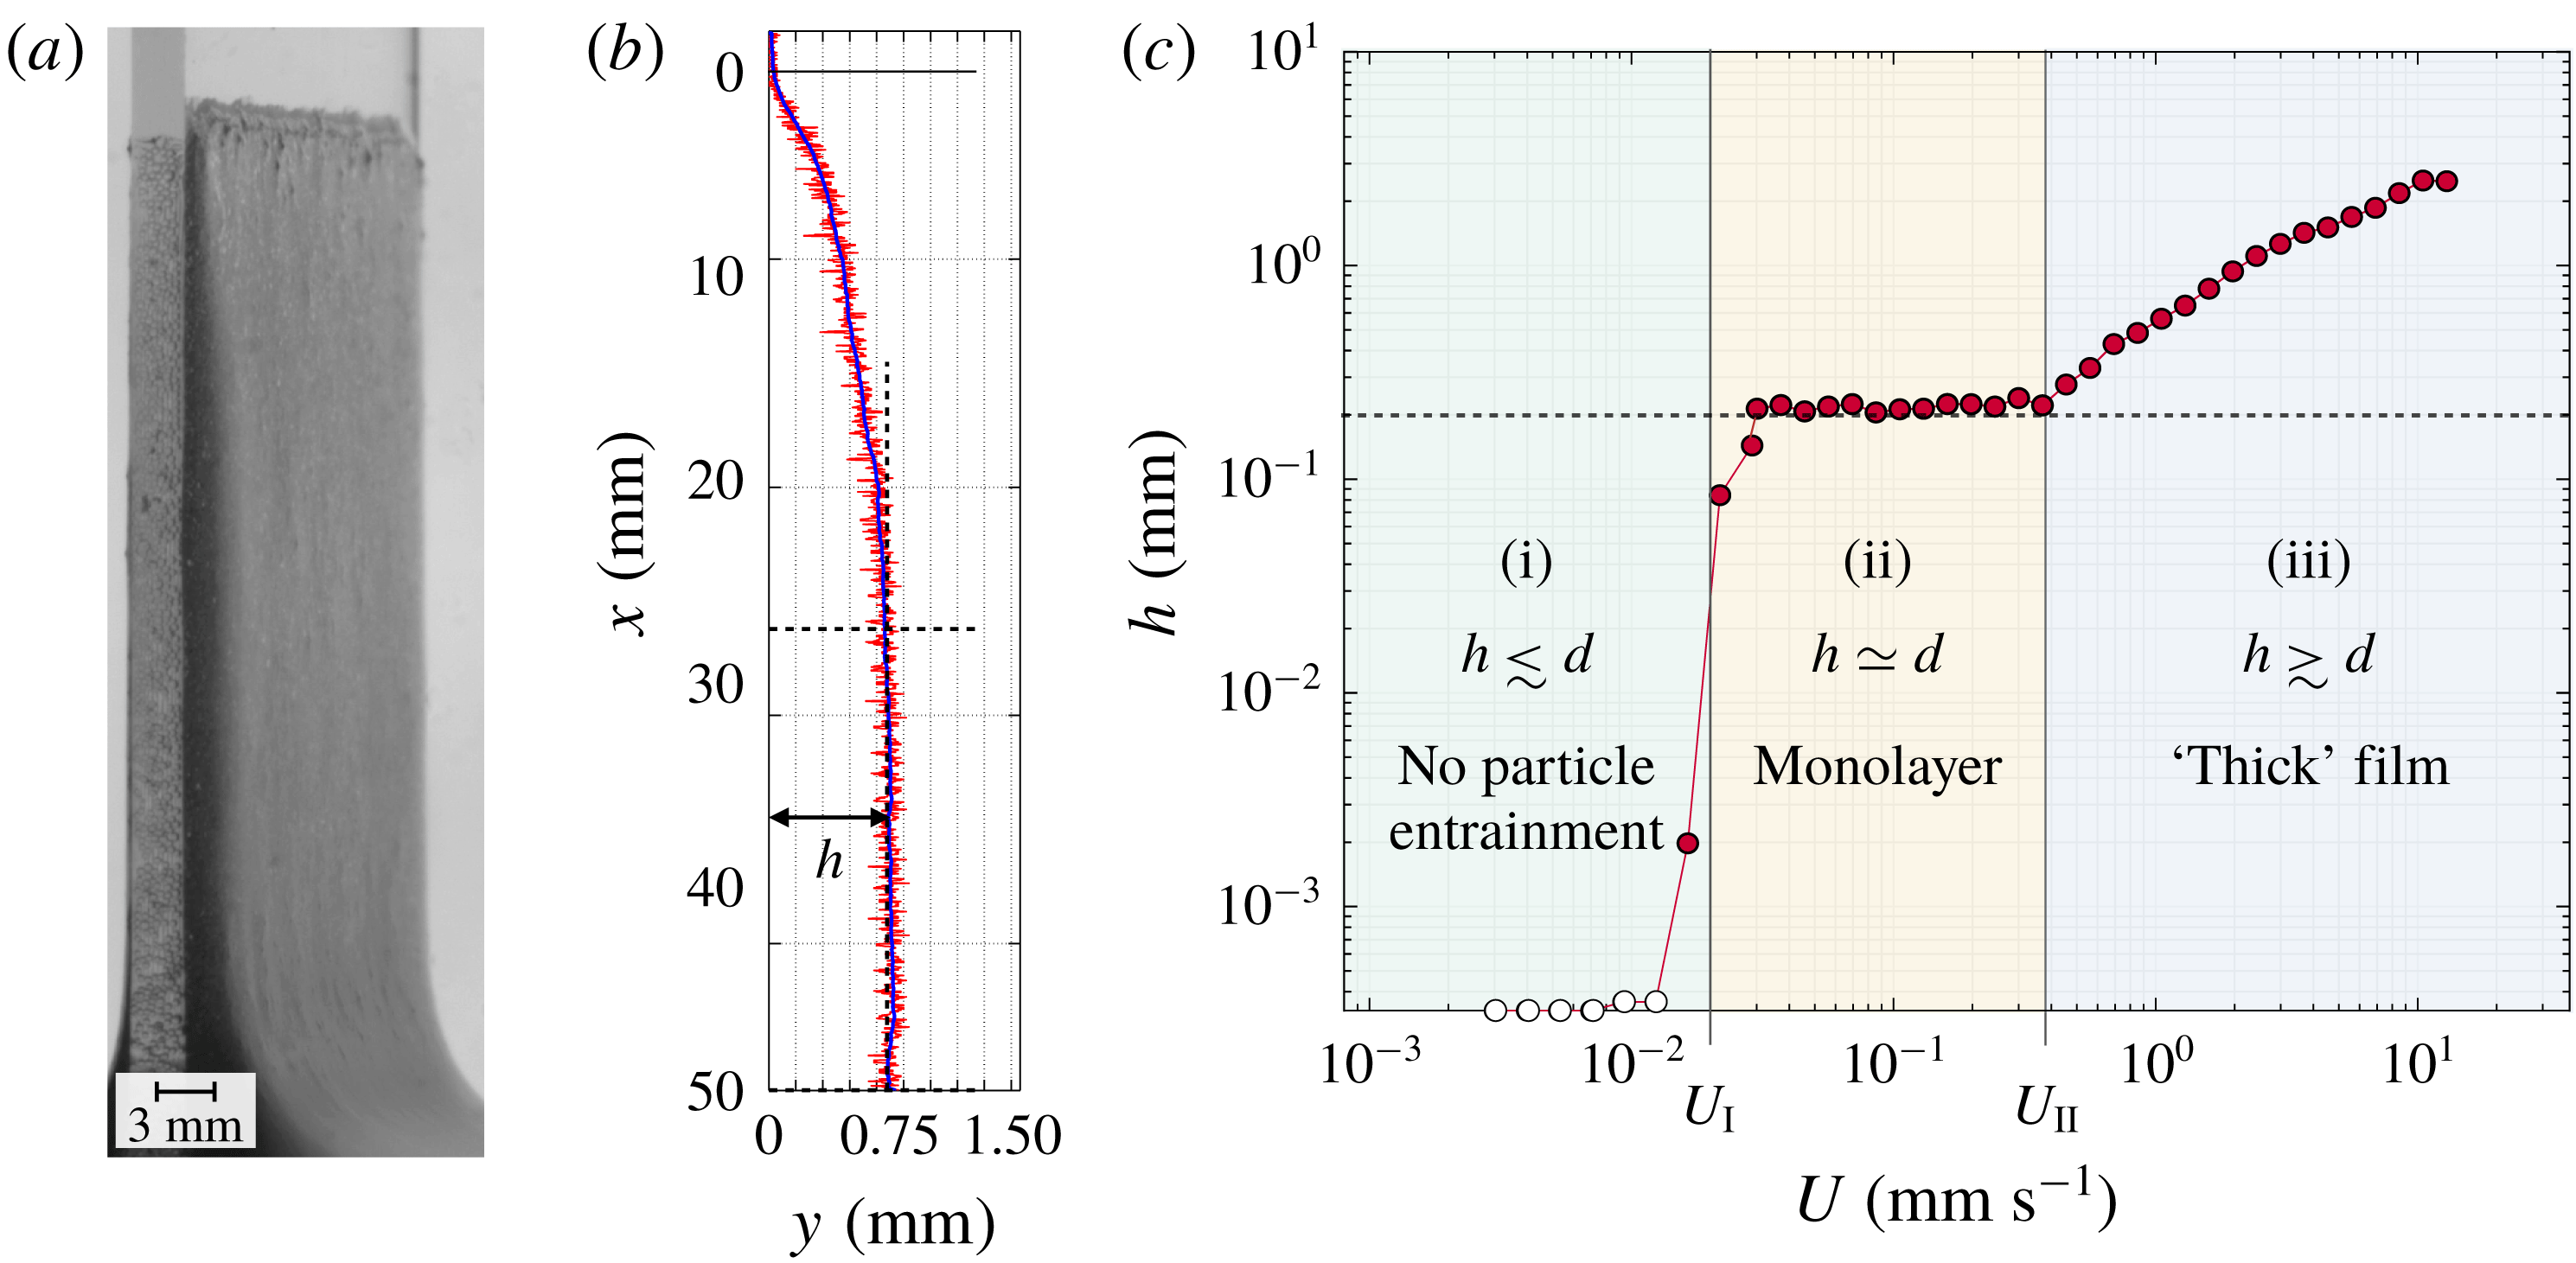
Figure 2(a) shows a typical coating film observed for a concentrated suspension (
 $\unicode[STIX]{x1D719}=0.40$
,
 $d=145~\unicode[STIX]{x03BC}\text{m}$
) and a velocity
 $U$
much larger than the entrainment threshold. A typical film thickness profile obtained with the laser profilometry is shown in figure 2(b). The liquid/plate triple line is essentially pinned (at
 $x=0$
) and a slowly draining suspension film is entrained from the onset of the motion. As for a pure liquid with
 $Ca\ll 1$
, the film is uniform at a sufficient distance from the triple line. To characterize the coating we consider the steady-state entrainment thickness of the film,
 $h$
, which we measure by averaging the thickness over the plateau close to the suspension bath (see figure 2
b). Figure 2(c) reports the evolution of
 $h$
with the withdrawal velocity for the same suspension. From low to high velocities, it reveals three distinct coating regimes, as also reported very recently by Gans et al. (Reference Gans, Dressaire, Colnet, Saingier, Bazant and Sauret2019): (i) a ‘no-particle-entrainment’ regime, where the film is much thinner than
 $d$
, (ii) a ‘monolayer’ regime, where the film thickness is of the order of the particle diameter
 $(h\simeq d)$
and is essentially independent of
 $U$
, and (iii) a ‘thick-film’ regime, where the film thickness is much larger than the particle size (
 $h\gtrsim d$
) and increases with increasing
 $U$
. These three regimes determine two boundary velocities
 $U_{I}$
and
 $U_{II}$
separating (i)/(ii) and (ii)/(iii), respectively.
(a) Typical coating observed in the thick-film regime (
 $d=145~\unicode[STIX]{x03BC}\text{m}$
,
 $\unicode[STIX]{x1D719}=0.40$
,
 $\unicode[STIX]{x1D702}_{0}=100~\text{mPa}~\text{s}$
,
 $U=6~\text{mm}~\text{s}^{-1}$
). (b) Typical coating thickness profile measured from laser profilometry in the thick-film regime (
 $d=145~\unicode[STIX]{x03BC}\text{m}$
,
 $\unicode[STIX]{x1D719}=0.40$
,
 $\unicode[STIX]{x1D702}_{0}=100~\text{mPa}~\text{s}$
,
 $U=0.9~\text{mm}~\text{s}^{-1}$
, the plate withdrawal length is 50 mm, and
 $x=0$
labels the initial position of the triple line on the plate). The red and blue lines represent the raw and smoothed signals, respectively. The dashed lines delimit the thickness plateau over which the average steady-state thickness
 $h$
is measured. (c) Steady-state thickness versus withdrawal velocity (same suspension as in (b)) illustrating the three different coating regimes. From low to high velocities: (i) no-particle-entrainment regime (
 $h\lesssim d$
), (ii) monolayer regime
 $(h\simeq d)$
, and (iii) thick-film regime (
 $h\gtrsim d$
).
 $U_{I}$
and
 $U_{II}$
denote the transition velocities between the regimes. The dashed line indicates
 $h=d$
.

3.2 Thick-film regime (iii)
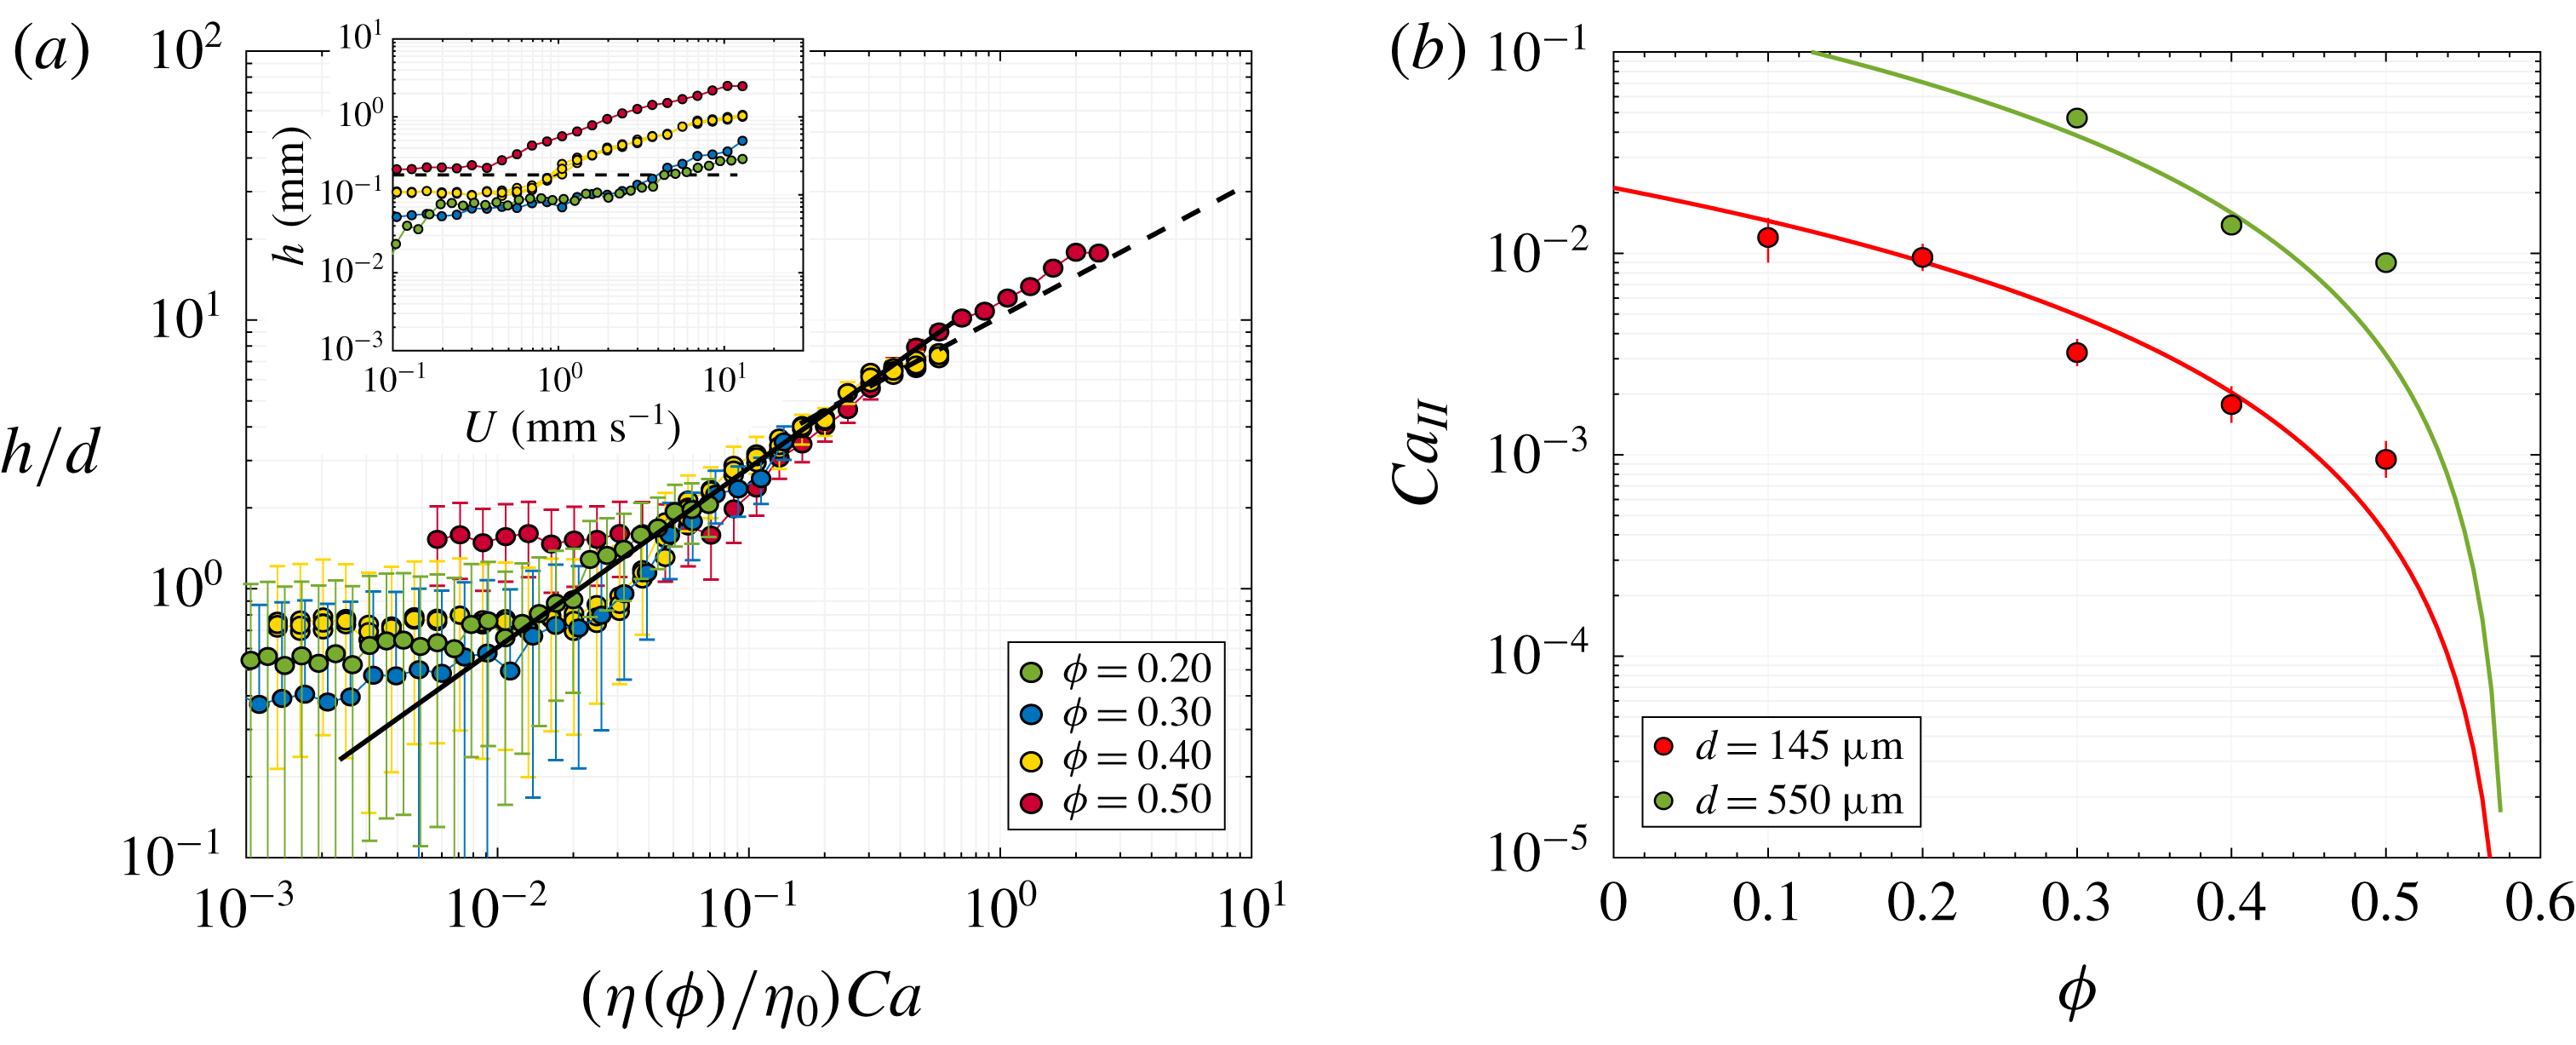
We consider first the thick film observed for large velocities. The inset of figure 3(a) presents the steady-state film thickness
 $h$
as a function of the withdrawal velocity
 $U$
for a particle volume fraction ranging from 0.20 to 0.50 and the same particles and liquid as in figure 2 (
 $d=145~\unicode[STIX]{x03BC}\text{m}$
and
 $\unicode[STIX]{x1D702}_{0}=100~\text{mPa}~\text{s}$
). The reproducibility of the coating is illustrated by the three series of measurements presented for
 $\unicode[STIX]{x1D719}=0.40$
. On the right-hand side of the graph, where
 $h\gtrsim d$
, the thickness
 $h$
is found to increase with increasing
 $U$
, as for a pure viscous liquid, but also with increasing
 $\unicode[STIX]{x1D719}$
. These two trends are consistent with the effective bulk rheology of a suspension, valid for large-scale flows (
 $\gg d$
) and low Reynolds numbers, in which the relative viscosity
 $\unicode[STIX]{x1D702}/\unicode[STIX]{x1D702}_{0}$
of the suspension increases with the particle volume fraction (Guazzelli & Pouliquen Reference Guazzelli and Pouliquen2018). Therefore, it is natural to represent the thickness
 $h$
as a function of the capillary number
 $\unicode[STIX]{x1D702}U/\unicode[STIX]{x1D70E}$
, based on the effective shear viscosity
 $\unicode[STIX]{x1D702}$
of each suspension, which is measured independently in the shear cell (see § 2). In this representation, shown in figure 3(a), the experimental film thicknesses for the different volume fractions collapse and agree well with the Landau–Levich–Derjaguin (LLD) model
 $$\begin{eqnarray}h\simeq 0.95\ell \left(\frac{\unicode[STIX]{x1D702}(\unicode[STIX]{x1D719})U}{\unicode[STIX]{x1D70E}}\right)^{2/3}=h_{0}\left(\frac{\unicode[STIX]{x1D702}}{\unicode[STIX]{x1D702}_{0}}\right)^{2/3},\end{eqnarray}$$
over the thick-film range,
 $h\gtrsim d$
, and provided
 $(\unicode[STIX]{x1D702}/\unicode[STIX]{x1D702}_{0})Ca$
remains smaller than 1 (as also reported by Gans et al.
Reference Gans, Dressaire, Colnet, Saingier, Bazant and Sauret2019). This suggests that, for the present case of fully wetted particles and for the range of particle volume fraction considered, the global surface stresses that limit the entrainment of the suspension are not very different from those expected from the surface tension of the pure suspending liquid. Finally, for
 $(\unicode[STIX]{x1D702}/\unicode[STIX]{x1D702}_{0})Ca$
larger than 1, the effective behaviour persists: the thickness agrees with the purely viscous regime
 $h\sim \sqrt{\unicode[STIX]{x1D702}U/\unicode[STIX]{x1D70C}g}\sim \ell (\unicode[STIX]{x1D702}Ca/\unicode[STIX]{x1D702}_{0})^{1/2}$
(Derjaguin Reference Derjaguin1943).
(a) Dimensionless thickness
 $h/d$
versus effective capillary number
 $\unicode[STIX]{x1D702}(\unicode[STIX]{x1D719})U/\unicode[STIX]{x1D70E}$
for different particle volume fractions
 $\unicode[STIX]{x1D719}$
. The error bars indicate the resolution of the laser profilometry (see § 2). The solid line is (3.1). The dashed line is the Derjaguin asymptotic regime
 $h=0.67\,\ell (\unicode[STIX]{x1D702}(\unicode[STIX]{x1D719})U/\unicode[STIX]{x1D70E})^{1/2}$
expected for
 $\unicode[STIX]{x1D702}(\unicode[STIX]{x1D719})U/\unicode[STIX]{x1D70E}\gg 1$
(Kizito et al.
Reference Kizito, Kamotani and Ostrach1999). The inset shows the raw data and indicates the particle size
 $d=145~\unicode[STIX]{x03BC}\text{m}$
. The three series of measurements presented for
 $\unicode[STIX]{x1D719}=0.40$
illustrate the coating reproducibility. (b) Transition capillary number between the thick-film (
 $h\gtrsim d$
) and the monolayer regime (
 $h\simeq d$
) versus particle volume fraction for various particle sizes. The solid lines represent (3.3).

The above measurements concern the total quantity of suspension entrained and do not distinguish between the solid and liquid contents. To complete the characterization of the coating in the thick-film regime, additional dip-coating experiments have been carried out to measure the particle volume fraction in the film. Five different withdrawal velocities have been considered for a fixed particle volume fraction of the bath,
 $\unicode[STIX]{x1D719}=0.40$
. The measurement procedure is as follows. Immediately after the plate has been fully withdrawn from the bath following the standard protocol, the whole of the suspension that has been entrained with the plate is weighed, rinsed, cleaned and dried thoroughly before being weighed a second time in order to measure the quantity of particles it contains. The ratio of the latter to the former weights yields the average particle volume fraction in the coating, denoted
 $\unicode[STIX]{x1D719}_{film}$
. For the five effective capillary numbers (
 $5.1\times 10^{-3}\leqslant \unicode[STIX]{x1D702}U/\unicode[STIX]{x1D70E}\leqslant 3.1\times 10^{-2}$
) we obtain
 $\unicode[STIX]{x1D719}_{film}=0.398\pm 0.003$
, without significant variation with
 $U$
. This shows that particle migration effects are negligible in the present case. The solid volume fraction of the coating is essentially the same as that of the bath:
 $$\begin{eqnarray}\unicode[STIX]{x1D719}_{film}\simeq \unicode[STIX]{x1D719},\end{eqnarray}$$
which is consistent with the use of the effective viscosity of the bath in equation (3.1).
3.3 Transition from thick-film to monolayer regimes (II)
The experimental data from figures 2 and 3 show that the LLD effective trend of the thick-film regime stops for small withdrawal velocities. The transition is rather sharp and occurs when the average film thickness plateaus at a value which is of the order of the particle diameter. Making use of the LLD effective law (3.1) and of the thickness
 $h\simeq d$
observed at the transition, one can readily express the transition capillary number
 $Ca_{II}\equiv \unicode[STIX]{x1D702}_{0}U_{II}/\unicode[STIX]{x1D70E}$
according to
 $$\begin{eqnarray}Ca_{II}\simeq \frac{\unicode[STIX]{x1D702}_{0}}{\unicode[STIX]{x1D702}}\left(\frac{d}{0.95\ell }\right)^{3/2},\end{eqnarray}$$
and as also proposed by Gans et al. (Reference Gans, Dressaire, Colnet, Saingier, Bazant and Sauret2019).
The value of the transition velocity
 $U_{II}$
can be extracted from the profilometry measurements. Figure 3(b) shows the experimental transition capillary number as a function of the particle volume fraction for a viscosity
 $\unicode[STIX]{x1D702}_{0}=100~\text{mPa}~\text{s}$
and two different particle sizes,
 $d=145$
and
 $550~\unicode[STIX]{x03BC}\text{m}$
. Over the whole range of
 $\unicode[STIX]{x1D719}$
, equation (3.3), which is represented by the solid lines, is in good agreement with the data.
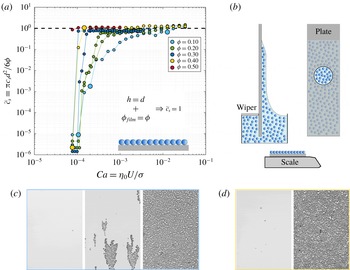
(a) Dimensionless particle surface concentration versus capillary number for
 $\unicode[STIX]{x1D719}$
ranging from 0.10 to 0.50 and
 $d=145~\unicode[STIX]{x03BC}\text{m}$
. The value
 $\tilde{c}_{s}\equiv \unicode[STIX]{x03C0}c_{s}d^{2}/6\unicode[STIX]{x1D719}\equiv h\unicode[STIX]{x1D719}_{film}/d\unicode[STIX]{x1D719}$
equals 1 for a monolayer with a flat liquid interface and the same particle volume fraction as in the bulk (as sketched in the inset). The two independent data series for
 $\unicode[STIX]{x1D719}=0.20$
and 0.30 show the reproducibility of the transition. (b) Schematics of the sampling technique using a plate with a removable circular central part to measure the liquid content of the monolayer by weighing. (c,d) Typical coating structure observed across transition I for
 $\unicode[STIX]{x1D719}=0.10$
(c) and
 $\unicode[STIX]{x1D719}=0.40$
(d). The pictures correspond to the large symbols in (a), with withdrawal velocity increasing from left to right.

3.4 Monolayer regime (ii)
Below
 $U_{II}$
, the profilometry measurements indicate that the average film thickness remains of the order of
 $d$
over an extended range of velocities. This is consistent with direct observations revealing that the particles form a monolayer. In this regime, the particle surface concentration
 $c_{s}$
becomes a relevant quantity to characterize the coating, which also has the advantage of being experimentally accessible with a great accuracy from single-particle tracking (see, for example, figure 1
d). Figure 4(a) presents the dependence of
 $c_{s}$
upon
 $U$
and
 $\unicode[STIX]{x1D719}$
in the steady-state coating regime, as measured by averaging over a central zone of the plate of
 $20\times 30~\text{mm}^{2}$
located 5 mm above the bath surface. We use the non-dimensional form
 $\tilde{c}_{s}\equiv \unicode[STIX]{x03C0}c_{s}d^{2}/6\unicode[STIX]{x1D719}\equiv h\unicode[STIX]{x1D719}_{film}/d\unicode[STIX]{x1D719}$
, which is by definition equal to 1 for a film having a thickness
 $h$
and the same particle volume fraction
 $\unicode[STIX]{x1D719}$
as the bath. For the smallest volume fraction,
 $\unicode[STIX]{x1D719}=0.10$
, the surface concentration decreases regularly with decreasing
 $U$
below the transition velocity
 $U_{II}$
. However, for higher volume fractions, the dimensionless surface concentration
 $\tilde{c}_{s}$
collapses on
 $1$
(i.e.
 $h\unicode[STIX]{x1D719}_{film}/d\unicode[STIX]{x1D719}\simeq 1$
) over a significant range of velocities, which further extends towards lower velocities for higher values of
 $\unicode[STIX]{x1D719}$
. This suggests that over this plateau
 $h\simeq d$
and
 $\unicode[STIX]{x1D719}_{film}\simeq \unicode[STIX]{x1D719}$
. However, since other combinations of
 $h$
and
 $\unicode[STIX]{x1D719}_{film}$
also yield
 $\tilde{c}_{s}=1$
we have conducted additional measurements to determine unambiguously the solid and liquid contents of the coating. To this end, we have used a PMMA plate with a removable circular portion (with diameter 12 mm and removed when it is 35 mm above the bath surface), which allows one to collect and weigh a sample of the steady-state coating and to determine its volume fraction
 $\unicode[STIX]{x1D719}_{film}$
from the comparison of its weight and the number of particles obtained from particle tracking. For a fixed bath volume fraction
 $\unicode[STIX]{x1D719}=0.40$
and different withdrawal velocities (
 $3.0~\text{mm}~\text{s}^{-1}\leqslant U\leqslant 10.5~\text{mm}~\text{s}^{-1}$
) we obtained
 $\unicode[STIX]{x1D719}_{film}=0.389\pm 0.003$
without a significant dependence on
 $U$
, which means that the monolayer regime observed at high particle volume fractions is characterized well by
 $$\begin{eqnarray}h\simeq d\quad \text{and}\quad \unicode[STIX]{x1D719}_{film}\simeq \unicode[STIX]{x1D719}.\end{eqnarray}$$
3.5 Transition from monolayer to no-particle-entrainment regimes (I)
Finally, we consider the transition from the monolayer regime to the no-particle-entrainment regime, labelled I, which represents the threshold for the steady entrainment of particles in the film. This transition shows in the measurements of figure 4(a) (for
 $d=145~\unicode[STIX]{x03BC}\text{m}$
and various
 $\unicode[STIX]{x1D719}$
) as the dimensionless surface concentration drops from
 $\tilde{c}_{s}\simeq 1$
to
 $\tilde{c}_{s}\simeq 0$
with decreasing entrainment velocities. For high particle volume fractions the transition is sharp, whereas for low
 $\unicode[STIX]{x1D719}$
it is broad – extending over almost two decades for
 $\unicode[STIX]{x1D719}=0.10$
– and shifted towards higher entrainment velocities. The typical structure of the coating across the transition is illustrated in figure 4(a,b) for a low (
 $\unicode[STIX]{x1D719}=0.10$
) and a high (
 $\unicode[STIX]{x1D719}=0.40$
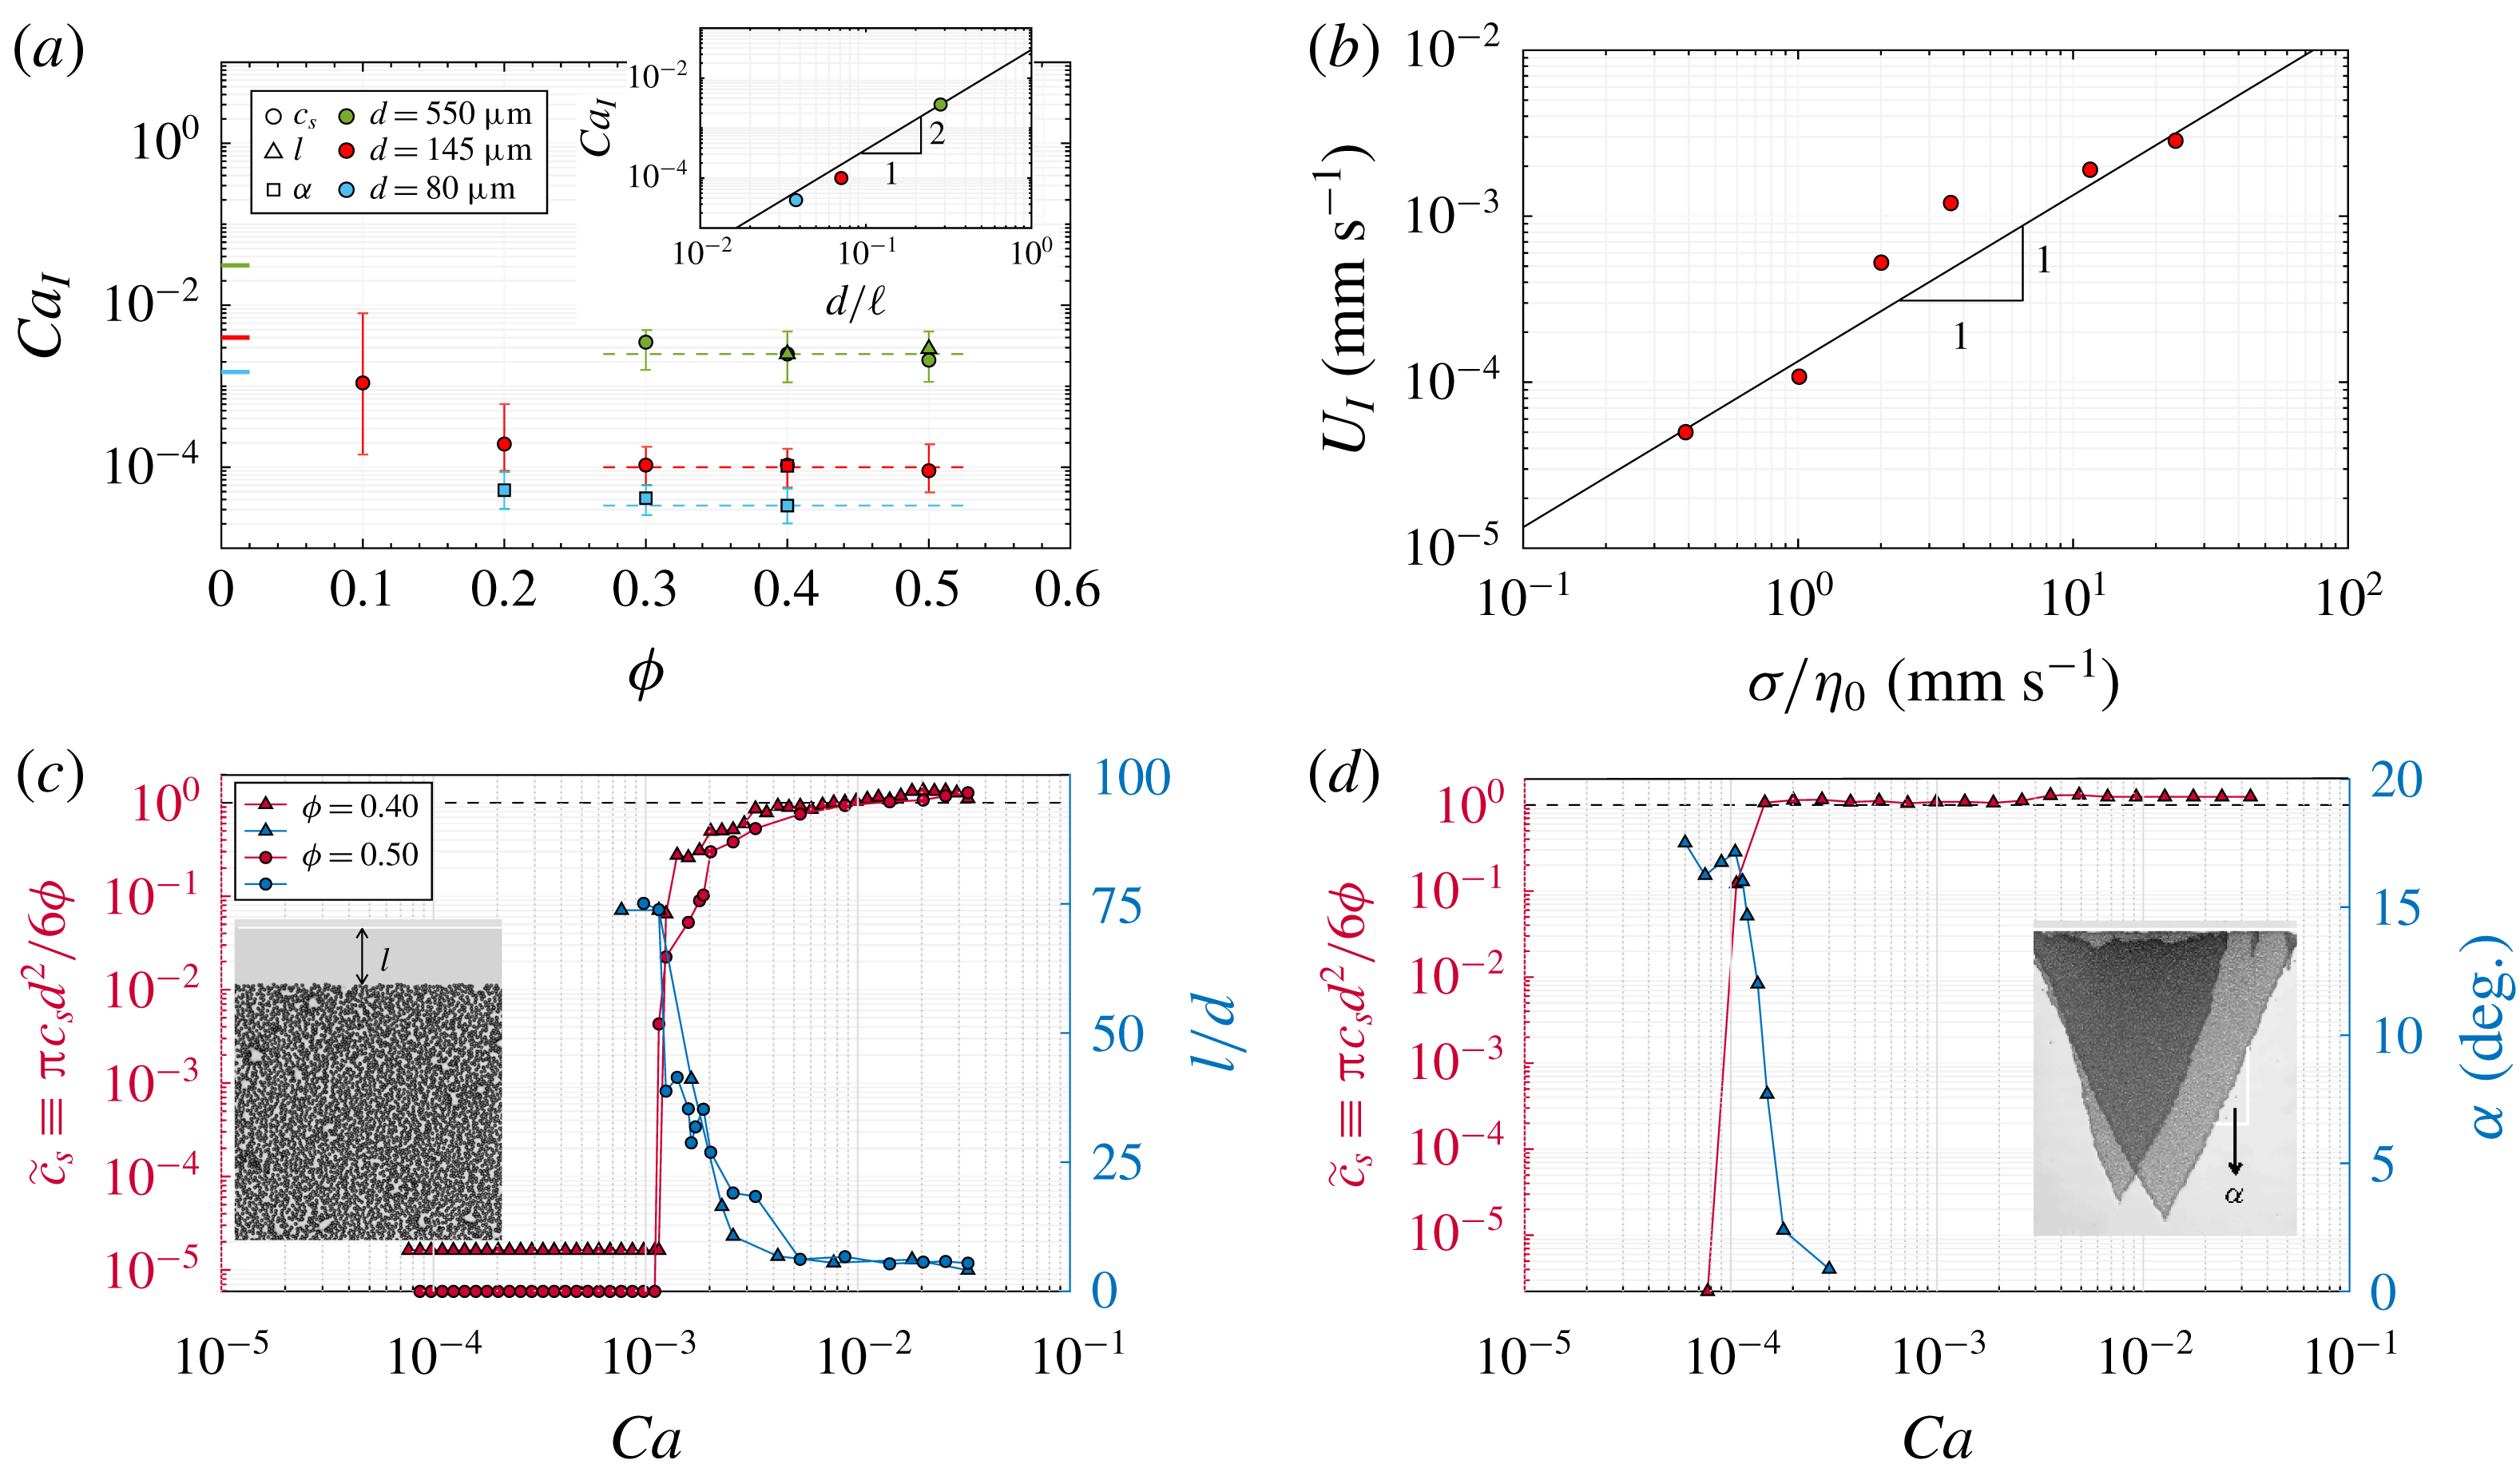
) volume fraction. Close to the monolayer regime the coating is uniform for both diluted and concentrated suspensions. However, close to the lower end of the transition, isolated clusters of particles form, which can be more easily observed for diluted suspensions because of the broadness of the transition. These evolutions are summarized in figure 5(a), which presents the capillary number
 $Ca_{I}\equiv \unicode[STIX]{x1D702}_{0}U_{I}/\unicode[STIX]{x1D70E}$
, around which the transition occurs, as a function of
 $\unicode[STIX]{x1D719}$
. As shown in figure 5(b) the raw transition velocity
 $U_{I}$
varies as the inverse of the suspending liquid viscosity
 $\unicode[STIX]{x1D702}_{0}$
, which suggests that for a given particle size and volume fraction it is relevant to express the transition in terms of
 $Ca_{I}$
. Experimentally, we define the latter as the geometrical mean of the ends of the range over which
 $\tilde{c}_{s}$
varies significantly (
 $10^{-6}\lesssim \tilde{c}_{s}\lesssim 1$
), whereas the vertical bars show the range itself (which is much broader than the typical variability in the measurements, see the repeated measurements in figure 4
a). It is found to decrease with increasing
 $\unicode[STIX]{x1D719}$
below 0.30. These measurements at low
 $\unicode[STIX]{x1D719}$
are consistent with the entrainment threshold expected in the diluted limit
 $\unicode[STIX]{x1D719}\simeq 0$
. Indeed, in this limit particles should not interact with each other and the criteria
 $h\sim \ell {Ca_{I}}^{2/3}\sim d$
, i.e.
 $Ca_{I}\sim (d/\ell )^{3/2}$
, derived by Colosqui et al. (Reference Colosqui, Morris and Stone2013) for an isolated particle should apply. The latter limit, indicated in figure 5(a), is found to be in line with our measurements for
 $\unicode[STIX]{x1D719}\leqslant 0.30$
.
Conversely, for higher volume fractions,
 $Ca_{I}$
plateaus and becomes almost independent of
 $\unicode[STIX]{x1D719}$
. For a given particle size, all concentrated suspensions (
 $\unicode[STIX]{x1D719}\geqslant 0.30$
) are found to have a very similar particle-entrainment velocity threshold. This contrasts sharply with the evolution of
 $U_{II}\propto 1/\unicode[STIX]{x1D702}$
, which depends strongly upon
 $\unicode[STIX]{x1D719}$
, in particular close to the critical volume fraction
 $\unicode[STIX]{x1D719}_{max}$
, where it is expected to vanish (Guazzelli & Pouliquen Reference Guazzelli and Pouliquen2018). The value, denoted
 $Ca_{I,\unicode[STIX]{x1D719}\geqslant 0.30}$
, of this high-
 $\unicode[STIX]{x1D719}$
plateau is determined as the mean of
 $Ca_{I}$
over the range
 $0.30\leqslant \unicode[STIX]{x1D719}\leqslant 0.50$
(over which the relative standard deviation is smaller than 7 % for each value of
 $d$
). It increases with increasing particle size, which means that, similarly to the diluted case, small particles are more easily entrained than large particles. As shown in the inset of figure 5(a), this dependence of
 $Ca_{I}$
on
 $d$
is found to be pronounced. For
 $d$
ranging from
 $80~\unicode[STIX]{x03BC}\text{m}$
to
 $550~\unicode[STIX]{x03BC}\text{m}$
, the value of
 $Ca_{I,\unicode[STIX]{x1D719}\geqslant 0.30}$
increases by two decades, which suggests a dependence close to
 $Ca_{I,\unicode[STIX]{x1D719}\geqslant 0.30}\propto d^{2}$
, as highlighted in the inset of figure 5(a). Although no model could be derived to explain these experimental results, the latter suggest that the dependence of
 $Ca_{I}$
on
 $d$
at high
 $\unicode[STIX]{x1D719}$
is stronger than for the diluted case (
 $Ca_{I}\propto d^{3/2}$
). Also, in the present case where a liquid film is always observed below
 $U_{I}$
(see § 3.6), the same transition velocity (
 $U_{I}$
) is obtained whether the plate is made of PMMA or glass.
(a) Transition capillary number between the monolayer and no-entrainment regimes versus
 $\unicode[STIX]{x1D719}$
for different particle sizes. The shape of the symbols indicates from which measurements (
 $c_{s}$
,
 $l$
or
 $\unicode[STIX]{x1D6FC}$
) the transition capillary number is determined. The vertical bars represent the range over which
 $\tilde{c}_{s}$
varies significantly (
 $10^{-6}\lesssim \tilde{c}_{s}\lesssim 1$
), whereas the symbols indicate the geometrical mean of the range limits. The coloured ticks at
 $\unicode[STIX]{x1D719}=0$
indicate the entrainment threshold
 $Ca_{I}\approx (0.35d/\ell )^{3/2}$
derived by Colosqui et al. (Reference Colosqui, Morris and Stone2013) for isolated particles. The dashed lines indicate the plateau value of
 $Ca_{I,\unicode[STIX]{x1D719}\geqslant 0.30}$
observed for
 $\unicode[STIX]{x1D719}\geqslant 0.30$
. Inset:
 $Ca_{I,\unicode[STIX]{x1D719}\geqslant 0.30}$
versus
 $d/\ell$
. The solid line shows
 $Ca_{I,\unicode[STIX]{x1D719}\geqslant 0.30}\sim (d/\ell )^{2}$
. (b) Evolution of
 $U_{I}$
with the suspending liquid viscosity for
 $d=145~\unicode[STIX]{x03BC}\text{m}$
and
 $\unicode[STIX]{x1D719}=0.40$
. The solid line represents the capillary number
 $Ca_{I}\simeq 1.0\times 10^{-4}$
reported in (a). (c) Co-evolution of the dimensionless surface concentration
 $\tilde{c}_{s}$
and the particle-free length
 $l$
(defined in the inset) with
 $Ca$
for
 $d=550~\unicode[STIX]{x03BC}\text{m}$
and
 $\unicode[STIX]{x1D719}=0.40$
and 0.50 (
 $\unicode[STIX]{x1D702}_{0}=100~\text{mPa}~\text{s}$
). (d) Co-evolution of
 $\tilde{c}_{s}$
and the narrowing angle
 $\unicode[STIX]{x1D6FC}$
(defined in the inset) with
 $Ca$
for
 $d=145~\unicode[STIX]{x03BC}\text{m}$
and
 $\unicode[STIX]{x1D719}=0.40$
(
 $\unicode[STIX]{x1D702}_{0}=12~\text{mPa}~\text{s}$
). The insets present typical pictures of the transients (each of the two triangular coatings in (d) is on a different side of the plate).

So far, the content of the coating has been characterized and discussed on the basis of averaged measurements performed at a large distance (
 ${\sim}30~\text{mm}$
) from the initial position of the triple line on the plate (
 $x=0$
). However, further qualitative information about the no-particle-entrainment transition can be obtained by observing the structure of the film that is formed at the onset of the plate withdrawal. As illustrated in the insets of figure 5(c,d), transition I is actually found to proceed differently depending on the particle size. For the largest particles (
 $d=550~\unicode[STIX]{x03BC}\text{m}$
), a transitory film containing no particles is observed close to
 $x=0$
, whose length
 $l$
increases as
 $U$
decreases around
 $U_{I}$
. By contrast, for smaller sizes (
 $d\leqslant 145~\unicode[STIX]{x03BC}\text{m}$
), the first line of particles appears to be pinned at
 $x\simeq 0$
. As a consequence a transitory entrainment of particles is observed even below
 $U_{I}$
, but this entrainment is not steady for
 $U<U_{I}$
: the width of the particle monolayer shrinks with
 $x$
with a characteristic angle
 $\unicode[STIX]{x1D6FC}>0$
depending on
 $U$
(see the inset of figure 5
d). The reason for this transitory entrainment is not known. It might be related to differences between the static and dynamic shapes of the meniscus, but we cannot exclude influences of slight evaporation at the triple line for the few seconds the plate is immobile before it is withdrawn. Nevertheless, although the transitory coating actually differs between different particle sizes, it is consistent in all cases with the particle content observed at large distances (large
 $x$
). As shown by comparison with the measurements of the dimensionless surface concentration
 $\tilde{c}_{s}$
in figure 5(c,d), both the particle-free length
 $l$
and the narrowing angle
 $\unicode[STIX]{x1D6FC}$
increase abruptly around the value of
 $U_{I}$
determined previously (figure 5
a), which explains why
 $\tilde{c}_{s}$
vanishes at large distances for low withdrawal velocities.
3.6 No-particle-entrainment regime (i)
The no-particle-entrainment regime has not been characterized quantitatively, but an important remark has to be made. In all the cases studied a continuous liquid film was formed below the no-particle-entrainment transition (
 $U$
slightly lower than
 $U_{I}$
). This observation suggests that the no-particle-entrainment transition discussed above is not directly related to the threshold velocity for the wetting of the plate by the suspending liquid (de Gennes Reference de Gennes1985; Bonn et al.
Reference Bonn, Eggers, Indekeu, Meunier and Rolley2009; Snoeijer & Andreotti Reference Snoeijer and Andreotti2013).
4 Conclusions
Three regimes of coating have been observed experimentally as a plate is withdrawn from a bath of a particulate suspension. For an increasing withdrawal velocity (i) no particles, (ii) a monolayer of particles, and (iii) a thick film of suspension are successively entrained with the plate.
In regime (iii), the particle size is unimportant. The coating has the same particle content as the bath, and its thickness follows the Landau–Levich–Derjaguin law, provided the dependence of the suspension bulk viscosity on
 $\unicode[STIX]{x1D719}$
is considered (1.1). This conclusion has also been drawn very recently by Gans et al. (Reference Gans, Dressaire, Colnet, Saingier, Bazant and Sauret2019) and suggests that the net interfacial stresses experienced by a suspension of totally wetted and neutrally buoyant particles are not very different from the Laplace pressure experienced by a pure liquid, as also reported for other types of capillary flow (Furbank & Morris Reference Furbank and Morris2004; Bonnoit et al.
Reference Bonnoit, Bertrand, Clément and Lindner2012; Mathues et al.
Reference Mathues, McIlroy, Harlen and Clasen2015; Château, Guazzelli & Lhuissier Reference Château, Guazzelli and Lhuissier2018; Château & Lhuissier Reference Château and Lhuissier2019).
Naturally, the particle size
 $d$
determines the transition velocities to regimes (ii) and (i). As also reported very recently by Gans et al. (Reference Gans, Dressaire, Colnet, Saingier, Bazant and Sauret2019), the transition II between (ii) and (iii) simply occurs when the film thickness
 $h/\ell \sim (\unicode[STIX]{x1D702}(\unicode[STIX]{x1D719})U/\unicode[STIX]{x1D70E})^{2/3}$
given by (1.1) is equal to
 $d$
and, thus, always depends on
 $\unicode[STIX]{x1D719}$
. Conversely, the particle entrainment threshold velocity
 $U_{I}$
separating (i) and (ii) is found to depend on
 $\unicode[STIX]{x1D719}$
only for sufficiently low volume fractions (
 $\unicode[STIX]{x1D719}\lesssim 0.30$
). These measurements are consistent with the entrainment criteria for an isolated particle (Colosqui et al.
Reference Colosqui, Morris and Stone2013), which is expected to describe the diluted limit (
 $\unicode[STIX]{x1D719}\simeq 0$
). The observation of a plateau in
 $U_{I}$
at high
 $\unicode[STIX]{x1D719}$
(
 ${\gtrsim}0.30$
) suggests that the bath volume fraction becomes unimportant for the entrainment threshold and that the latter could be related to a local accumulation of particles in the meniscus. Nevertheless, the value of this plateau and its experimental dependence
 $\propto \,d^{2}$
on the particle size remain to be rationalized from first principles. Further work is also required to address the case of other types of suspension, such as suspensions of partially wetted or non-spherical particles.
Acknowledgement
This work has been financially supported by the Agence Nationale de la Recherche through grant ANR-14-ACHN-0019-01.