

1. Introduction
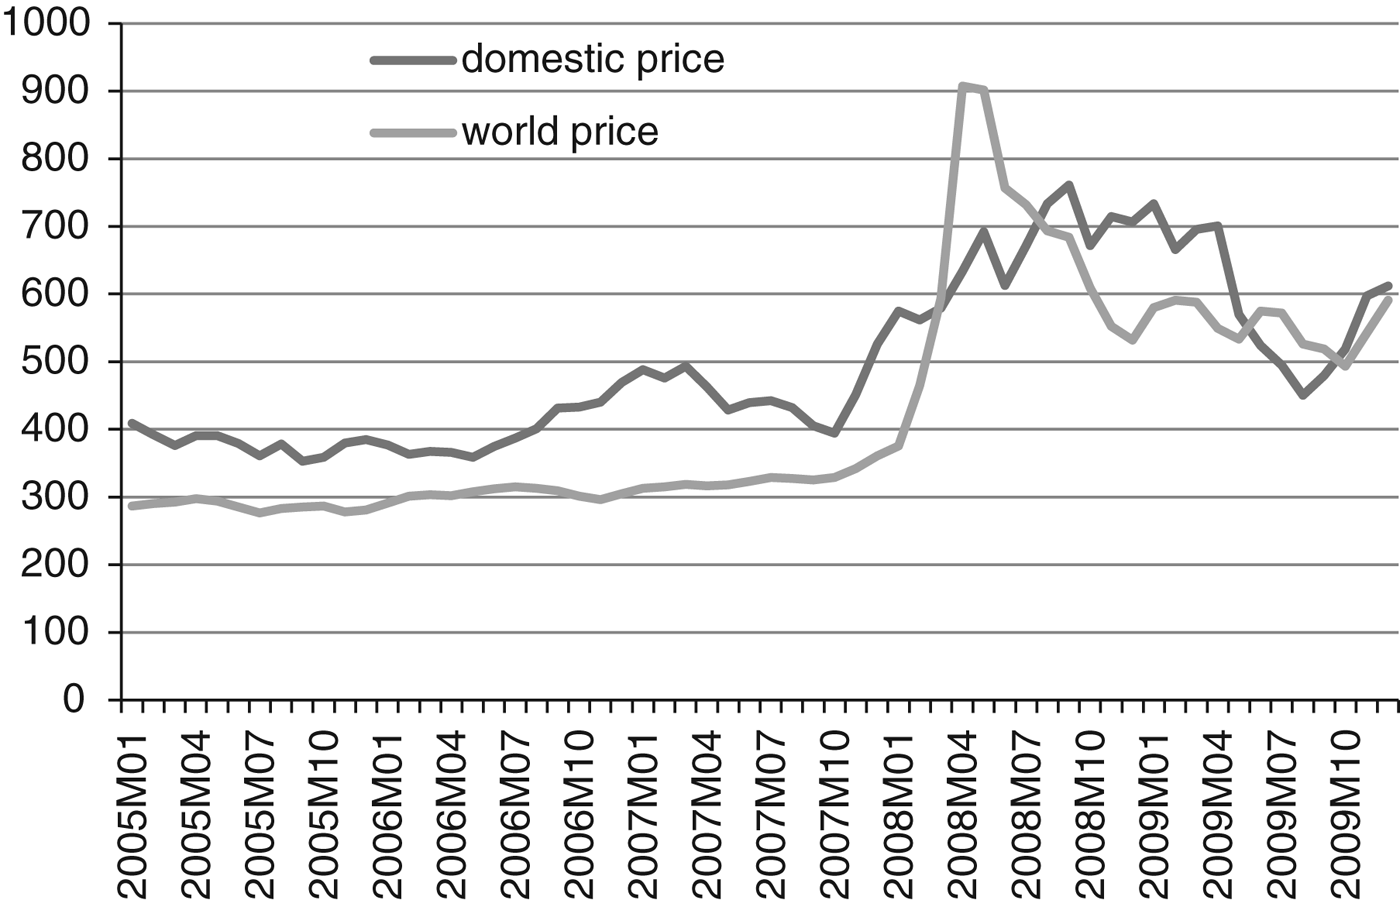
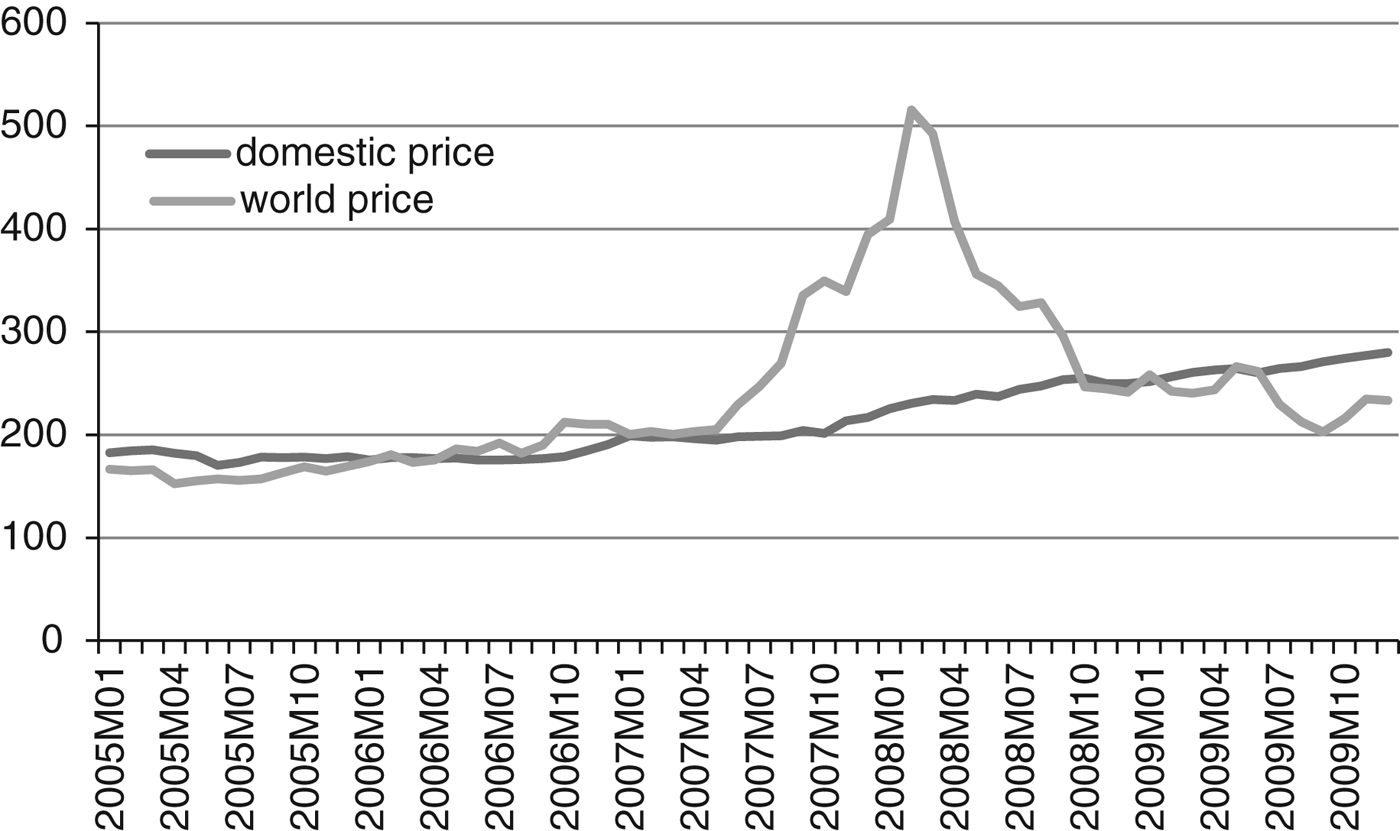
During the 2007/8 world food price crisis, world market as well as domestic market prices for agricultural commodities increased dramatically. These price rises threatened the livelihood of poor consumers in many developing countries. Consequently, many national governments chose to implement various policy interventions to moderate domestic market price rises and to secure domestic supply (Demeke et al., Reference Demeke, Pangrazio and Maetz2008). In China, the government instituted a series of very active trade policy interventions at the border to stabilize domestic prices, especially for grains and soybeans. These policy interventions include eliminations of export tax rebates, impositions of export taxes, and temporary reductions of import tariffs for grains and soybeans (OECD, 2009a; Jones and Kwiecinski, Reference Jones and Kwiecinski2010). All these border measures should have helped reduce export supply, boost domestic supply, and ultimately shield the Chinese domestic market from the instabilities in the world market and stabilize domestic market prices. Clearly, the foremost policy objective during that time was to maintain affordable food prices for domestic consumers, especially the poorer segment of consumers. At least in the crisis period, these policy actions – together with China's primary reliance on domestic grain supply – had seemingly achieved the goal of moderating rises in domestic prices, as actual grain price rises in China were far below those observed elsewhere in the world for the same period, as illustrated in Figures 1a and 1b for rice and wheat, respectively.Footnote 1
Domestic and world market prices of rice: January 2005 to December 2010

Domestic and world market prices of wheat: January 2005 to December 2010
While higher food prices pose a threat to the livelihood of poor consumers, if they are allowed to be fully transmitted to the domestic market, they can nevertheless create incentives for producers to produce and supply more to the market. By severing/limiting the transmission of price signals to the domestic market, the incentives for producers/suppliers to produce/supply more are then greatly diminished. Clearly, a first best response would be for producers to respond to the price signals and increase their supply and for the national governments to address potential poverty and hunger issues with targeted safety net mechanisms.Footnote 2 Therefore, the welfare costs in terms of decreased production efficiencies arising from reduced supply responses should not be ignored in evaluating the effectiveness of the border policy measures applied by many national governments around the world, including that of China.
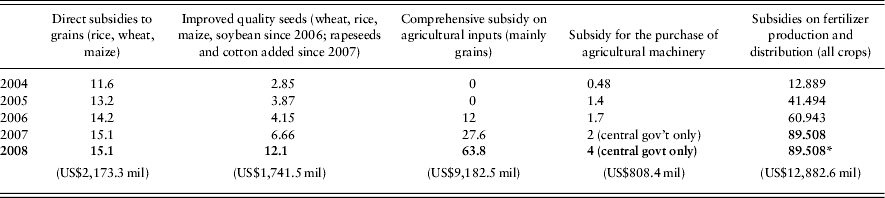
In the Chinese case, the efficiency costs associated with reduced supply responses are further compounded by the fact that there are existing (and longer term) domestic policy measures aiming at increasing producer incentives. These include direct payments to grain production and subsidies to fertilizer and other inputs.Footnote 3 Lower domestic market prices (as compared to the prevailing world market prices) clearly undermine the objective of existing domestic policy measures in increasing farm income and boosting agricultural production. In fact, in conjunction with the border measures, in 2008 the Chinese government strengthened existing domestic policy measures by increasing direct payments to grain farmers, increasing subsidies for adopting improved seeds, increasing minimum procurement prices for wheat and rice, and, perhaps most importantly, significantly raising spending on subsidizing purchased inputs (mainly fertilizers) and on subsidizing the production and distribution of fertilizers (see Table 1 and 2 for details of these measures; for a more complete introduction to China's domestic support measures, see OECD, 2009a and 2009b). In addition, export tax on fertilizers was also introduced in 2008. All these measures should have the effects of reducing producers’ costs and/or increasing outputs, thereby offsetting the negative output effects of the short-term border measures on producers.
In the recent literature on the 2007/8 food price crisis, focuses have generally been on the causes of the crisis (see for example papers surveyed by Abbott et al., Reference Abbott, Hurt and Tyner2009; and Headey and Fan, Reference Headey and Fan2008) and how export restricting and price insulating government policy mitigates the negative effects of high world market prices on domestic markets and/or exacerbates the instability on the world market, thereby creating negative externalities (see for example Abbott, Reference Abbott2012; Anderson and Nelgen, Reference Anderson and Nelgen2012; Bouet and Laborde Debucquet, Reference Bouët and Laborde Debucquet2012; Ivanic et al., Reference Ivanic, Martin and Mattoo2011; and Martin and Anderson, Reference Martin and Anderson2012). The complex interactions between the short-term trade policy measures and existing domestic support measures – as suggested above – have not been explored.Footnote 4 In the Chinese case, to our best knowledge, the only study that touches upon these interactions is a partial equilibrium analysis provided by Hansen et al. (Reference Hansen, Tuan and Somwaru2011) showing that China's export taxes and domestic subsidies provide offsetting effects. Yet, that study is limited in its coverage in the various policy instruments applied by China and the interactions between the border and existing domestic measures are not formally explored. For this reason, a more comprehensive study focusing squarely on the interactions of the two types of policy measures is warranted. Analyzing this recent experience will no doubt provide useful inputs into the debate on how China should best respond to this complicated challenge. A better understanding of the Chinese experience can also provide useful insights into dealing with similar challenges in other developing countries.Footnote 5 Thus, the relevance and timeliness of the issue constitute the second motivation of the paper.
Based on detailed policy information on China's major policy measures applied at the border and domestically in combating the food price crisis for the year 2008, this paper aims at examining how these policy measures individually and jointly affect domestic market prices, domestic supply, farm income, and trade flows into and from China. To consistently capture the inter-linkages across the different policy measures and different farm sectors, as well as the interrelations between the domestic and world markets, a global computable general equilibrium modeling framework incorporated with the policy details for China is adopted for the current analysis. The rest of the paper is organized as follows. Section 2 provides an overview of the policy measures adopted by China and their expected domestic market effects. Section 3 introduces the modeling framework and the scenarios to be simulated and analyzed. Section 4 analyzes the main results. The last section concludes with a summary of the main findings and their implications.
2. Trade and domestic policy measures applied by China in 2008
2.1 Border policy measures and their expected effects
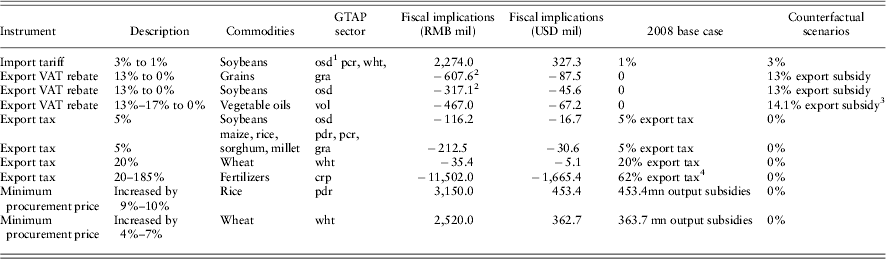
A host of contingent border policy measures were used by China in 2008 to insulate its domestic market from the world market, including removing export Value Added Tax (VAT) rebates, imposing export taxes and licenses on certain grain products, restricting ethanol exports and productions, imposing restrictions on exports of fertilizers, and temporarily removing tariffs on food imports, etc.Footnote 6Table 1 reports some of the most important trade/border policy measures adopted by China in 2008, and it is clear that export restriction policies are the most visible tools adopted and these restrictions are not only on grains and soybeans but also on chemical fertilizers which have been used intensively in producing grains and other agricultural products in China.Footnote 7
Short-run trade policy measures and domestic procurement price measures adopted in China in 2008
Notes: This table is based on Appendix table A.4 on pp. 66–7 of Jones and Kwiecinski (Reference Jones and Kwiecinski2010), information from the General Administration of Customs of China, our own calculations based on data from UN COMTRADE database, and the GTAP concordance between GTAP sectors and the HS system (www.gtap.org). The exchange rate for converting the value from RMB yuan to US dollar is 6.948 RMB per US dollar, according to the IMF.
1 UN COMTRADE database shows that most OSD imports into China in 2008 were soybeans and a significant portion of its OSD exports was also soybeans.
2 Jones and Kwiecinski (Reference Jones and Kwiecinski2010) report the fiscal savings from reducing the tax rebate for grains and soybeans in 2008 are 916 million RMB. Our calculations based on data from UN COMTRADE database suggest a total saving of RMB 924.7 million on both grains and soybeans.
3 The average rebate rate is calculated by using trade data from UN COMTRADE.
4 The 62% average export tax rate is obtained by using the total export tax revenue levied on chemical fertilizer products and the corresponding value of exports. To compute the total export tax revenue, we use the monthly export data at 8-digit level obtained from the Chinese Customs and match them with the corresponding export tax rates.
Export restrictions placed on grains and soybeans consisted of the removal of export VAT rebates at a range of 13–17% and imposition of export taxes of between 5% and 20%. These actions are estimated to generate government savings – in the form of reduced government spending on VAT rebates and increased export tax revenue – by about RMB 1.8 billion.Footnote 8 On the other hand, temporary reduction of import tariffs on soybeans reduced tariff revenue by about RMB 2.3 billion, which more than offset the savings achieved through the export restrictions.
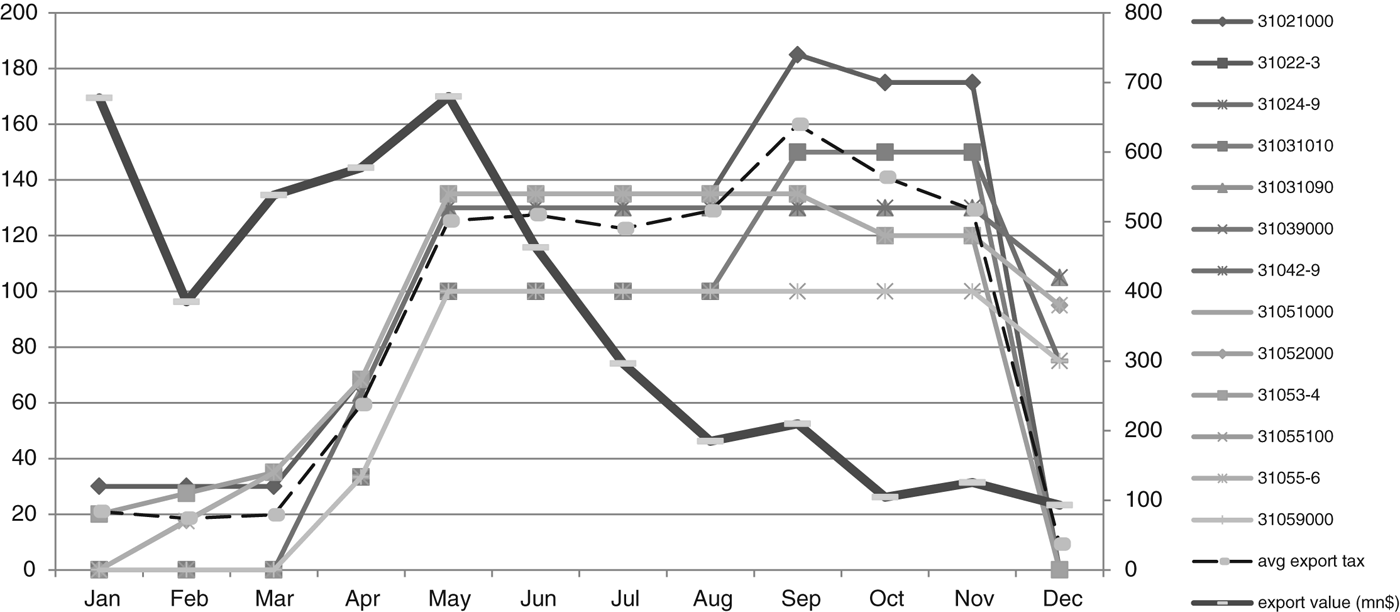
From a fiscal implication point of view, however, the most dramatic export policy action was the export tax placed on fertilizers, as shown in Figure 2. For the year 2008, this export tax was adjusted six times (General Administration of Customs of China, 2008), leading to tax rates as high as 185% for certain fertilizer products at 8-digit level in September 2008.Footnote 9 Based on detailed monthly export data at HS-8 level and detailed policy announcements by the General Administration of Customs of China, we estimate the average export tax rate for fertilizer for the whole year of 2008 – weighted by the corresponding monthly fertilizer exports from China at HS-8 level – to be about 62%! Against this average export tax rebate, China still exported around 9.276 million tons of fertilizers valued at 4.323 billion US dollars in 2008, implying export tax revenue of 1.665 billion US dollars (or RMB 11.502 billion).
China's fertilizer export taxes by selected HS8 code (%; left axis) and export values (million USD; right axis) in 2008
From a fiscal perspective, taken together, the Chinese government had a net revenue of about RMB 11 billion due to the above-mentioned border measures in 2008. The actual trade restrictiveness as well as the domestic market implications of these policies also need to be estimated, which is precisely the objective of this study. While these measures might have the desirable effect of securing the short-run domestic supply and reducing foreign demand, they nevertheless create disincentives for the needed expansion of agricultural production, and exert negative externalities on the world market. For example, when world market prices are rising, reductions in import barriers help moderate domestic price hikes through increasing supply to the domestic market; however, increased import supply dampens domestic producers' incentives to produce and supply more to the domestic market and increases demand on the world market. Increasing export taxes has much the same domestic market effects: it makes Chinese products more expensive on the world market, thereby shifting supply to the domestic market and dampening domestic market prices, thus hurting producers' incentives.Footnote 10 Reducing export VAT rebate rates is similar to a reduction in export subsidies. Therefore, it has the same domestic market effect as increasing export taxes.
2.2 Increased spending on domestic policy measures and their interactions with border measures
At the same time as introducing the above border measures, the Chinese government also strengthened existing domestic policy measures, mainly to encourage domestic grain production.Footnote 11 As shown in Table 2, specific measures adopted include increased support for purchasing farm machinery; increased subsidies for purchasing farm inputs, such as fuels, fertilizers and seeds; increased direct payments to grain producers; and new pilot insurance schemes for crop and livestock producers. Most notable among these measures are the increased subsidies on inputs: RMB 12.1 billion on seeds (about RMB 8 billion higher than the pre-crisis spending level in 2006), RMB 63.8 billion on purchased subsidies under the comprehensive subsidy program (about RMB 42 billion higher than the spending recorded for 2006), and nearly RMB 90 billion on fertilizer production and distribution (about RMB 29 billion higher than the 2006 spending level). In addition, the minimum procurement prices for wheat and rice were also increased with the increased government expenditure reaching RMB 5.7 billion (see the last two rows in Table 1).
Major agricultural domestic subsidies in China: 2004–2008 (billion RMB)
Note: *Subsidies to fertilizer producers in 2008 are not available and in this paper we use the 2007 figure.
Source: OECD (2009) and various documents from the websites of Ministry of Finance, China. The exchange rate for converting the value from RMB yuan to US dollar is 6.948 RMB per US dollar, according to the IMF.
Clearly, strengthening existing domestic support policy measures should have created further incentives for agricultural producers to expand agricultural production or at least to prevent significant decreases. For example, output subsidies in the form of increased minimum procurement prices for wheat and rice help increase producer's prices by creating a gap between producers' prices and the corresponding domestic market prices. Direct payments to grain farmers likely increase the return to land and increase grain supply; subsidies to purchased inputs, seeds and machineries reduce producers' costs and boost outputs.Footnote 12 In addition, export taxes on inputs such as fertilizers push down domestic market prices for farm inputs by reducing foreign demand, which in turn reduces producers' costs of production and increases agricultural production. In short, these domestic support measures are likely to generate the opposite effect to export taxes on agricultural outputs.
When domestic market prices for grains are pushed down (or kept below the level of the corresponding world market prices) by border measures, producers' prices will be necessarily dropping for any given level of domestic support measures. With reductions in producer's prices, incentives for agricultural production will be reduced.Footnote 13 Although in the very short run, agricultural production decisions, such as planting areas and product choices, cannot be altered, farmers and other stockholders still have the option to increase their stockholding and reduce their supply to the market when domestic prices are kept artificially low. In addition, farmers can also observe the prevailing market price signals for making decisions on variable inputs such as labor hours, fertilizers, and pesticides, which ultimately influence agricultural outputs. Therefore, in the presence of border policy induced artificially low domestic market prices (relative to the corresponding world market prices) and soaring costs for key agricultural inputs (due to the oil price shocks in the same period), higher spending on existing agricultural domestic support measures would be desirable for achieving a desirable level of commodity supply on the domestic market and supporting farmers' income. The experience of China in 2008 clearly lends support to this reasoning, as tight export controls on grains and fertilizers coincided with increased spending on existing domestic measures.
3. Methodology and scenarios
3.1 Model and database
We adopt and modify the well-known computable general equilibrium model GTAP (Hertel, Reference Hertel1997) with agricultural sector policy details for modeling and analyzing the 2008 border policy and agricultural domestic support policy adopted by China. We have made significant changes to the standard GTAP modeling structure to accommodate the observed domestic support and border policy measures of China and characteristics of the Chinese agricultural economy.
The effects and the interactions of the border policy measures and existing domestic policy measures are examined through a series of counterfactual simulations with the modified GTAP model. We base these simulation exercises on the GTAP database version 8 pre-release, which has 2007 as its base year and covers 112 countries/groups of countries and 57 sectors.Footnote 14 For the purposes of this study, we aggregate the original database to a manageable size of 12 regions (i.e. China, the European Union, USA, Canada, Brazil, Japan, India, Oceania (Australia and New Zealand), South Africa, as well as Rest of Latin America, Rest of Africa, and Rest of the World) and 40 sectors (including all 19 agriculture and food sectors originally listed in the disaggregated GTAP database).Footnote 15
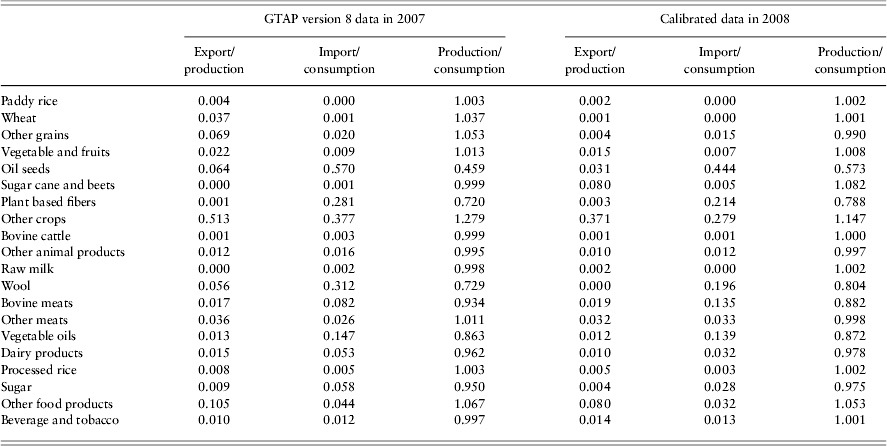
Since the GTAP version 8 pre-release reflects the macroeconomic situation in 2007, it does not include agricultural trade and production values for China in 2008. Both the short-term agricultural trade policy measures and domestic policy measures adopted by China in 2008 are not presented in the pre-release database. Part of the data effort underpinning this study is to gather this information and systematically calibrate it to the database to form a realistic agriculture baseline for China for the year 2008. This carefully calibrated base case for reflects everything that we know about 2008 in terms of China's agricultural domestic support policy, agricultural trade policy, agricultural production and trade patterns for China, and agricultural price levels in China.Footnote 16 China's agricultural trade flows and key differences between the original GTAP database and the calibrated database are shown respectively in Appendix tables 1 and 2.
It is worth noting that fertilizer is not a separated GTAP commodity as it is included in the ‘chemical, rubber and petroleum’ (CRP) category. In order to capture the effects of the aforementioned export policies on fertilizer (which differ significantly from trade policies applied to CRP in general), we use a GTAP database program named SplitCom (Horridge, Reference Horridge2008) to create a new fertilizer sector in our aggregated GTAP database. In carrying out the split, we target both the trade flows for fertilizer as well as the total domestic production values of fertilizers in China. Without further information on the cost structure of the newly created fertilizer sector, we allow it to mirror that of the original CRP sector. However, shares of fertilizer uses in China's agricultural sectors are reasonably represented with the new fertilizer sector, given the fact that both fertilizer production value and agricultural production values are explicitly targeted in the calibrated database. Moreover, since most of the CRP outputs used in agricultural production in China are in fact fertilizers, this split greatly reduce the intensity of CRP use in agriculture. The resulted new database otherwise maintains all other information in the original GTAP database. After the SplitCom procedure, the specific trade policies for fertilizer are imposed in the new database to establish the base case of this study.
Counterfactual policy scenarios aiming at estimating the individual and joint effects of the short-term border policy measures and the existing domestic subsidy programs will then be simulated by using the 2008 base case.
3.2 Calibration of the 2008 base case
Regarding the agricultural trade and domestic policy measures, this requires firstly mapping the policy instruments to the relevant variables in the model and then calibrating the observed fiscal spending (or revenue) on the domestic support and trade policy measures into the accompanying database. Some of the more important policy measures are discussed below.
Output subsidy captures the difference between a product's producer price and the corresponding domestic market price. This instrument is used to model the reported increase in China's minimum procurement prices for rice and wheat in 2008, which normally raises producer price and reduces market prices for the two products. Since it reduces these products' market prices facing both processors (intermediate inputs) and consumers (final consumption), this output subsidy can also be understood as a consumption subsidy. The reported spending of RMB 3.15 billion for rice and RMB 2.53 billion for wheat are calibrated to the 2008 base case.
Intermediate input subsidy captures the difference between farmers' (users') purchasing price and the corresponding market price of a specific intermediate input. The main input subsidies in agriculture used by China are the so-called ‘comprehensive subsidies on agriculture inputs’ (namely, fertilizers, pesticides, and other purchased farm inputs; RMB 63.8 billion in 2008; see Table 2) and subsidies on ‘improved quality seeds’. Subsidies on purchased inputs in recent years have been mainly given to grain production and as such are associated with input use in grains only, whereas seeds subsidies are attached to the use of grains seeds, rapeseed seeds, and cotton seeds in the respective sectors. In addition to the input subsidies, producers of fertilizers in China also receive subsidies to compensate for the lower market prices at which they sell to fertilizer users. These are captured in the model and database as the differences between producers' prices and the market prices of fertilizers. Unlike the comprehensive input subsidies, these subsidies apply to fertilizers used by all crops.
Land (or capital)-based agricultural subsidy measures the difference between farmers' (users') rental price and the corresponding market rental price of land (or capital). Several different payments/programs fall into this category. Direct subsidies to grain production are generally considered to be attached to arable land for grain production and are modeled as land subsidies, whereas subsidies for purchasing agricultural machineries are treated as subsidies to capital.
The relevant border protection measures, mainly export restriction measures, are modeled as price wedges between relevant domestic and world market prices. More specifically, export tax implies that the domestic market price falls below the corresponding free on board (FOB) export price. On the other hand, export VAT tax rebates are treated as a de facto export subsidy, implying that the domestic price exceeds the FOB export price when the rebate rate is positive. Therefore, eliminating export VAT rebates has the same qualitative effect as increasing export tax. These export restrictions mainly concern grains, soybean, and fertilizers.
It needs to be noted that the standard GTAP model typically treats the above policy instruments as ad valorem tax wedges. To make sure that the budget outlays associated with the various instruments discussed above are correctly represented in the modified GTAP database, we choose to target the budget outlays while allowing the tax wedges to adjust in the calibration processes. As mentioned earlier, the targeted budgetary implications associated with these measures are reported in Tables 1 and 2.
3.3 Construction of alternative scenarios
Against the 2008 baseline, we first simulate a counterfactual scenario in which all the border measures adopted by China in 2008 – as summarized in Table 1 – are removed (e.g. export taxes) or restored to the pre-crisis levels (e.g. export VAT rebates and import tariffs). In this scenario (named scenario S0), we also reduce the government spending on key domestic support programs to their pre-crisis levels (i.e. in 2006), as shown in Table 2. The resulted new equilibrium (referred to as ‘2008 baseline without policy’ hereafter) reflects a hypothetical 2008 situation without the border and domestic policy interventions of China. As such, the differences between this new equilibrium (the 2008 baseline without policy) and the original 2008 baseline (which we have calibrated) can be considered as the effects of removing the aforementioned policy interventions applied by China. However, to serve the purpose of discussing the effects of imposing – rather than removing – those policy interventions, the updated database characterizing the hypothetical 2008 baseline without policy is used as the new base case for simulating the reverse of the shocks contained in scenario S0 (i.e. the imposition of the trade and domestic policy shocks). The computed percentage change results then correctly capture the effects of imposing the policy interventions (as summarized in Tables 1 and 2).Footnote 17
More specifically, four scenarios are simulated against the 2008 baseline without policy for purposes of estimating the individual effects of imposing border measures on grains and soybeans (scenario S1), imposing export taxes on fertilizers (scenario S2), increasing minimum procurement prices for rice and wheat (scenario S3), and lowering spending on domestic support measures (scenario S4). Moreover, a final scenario (scenario S5) is also simulated to estimate the joint effects of imposing all the shocks contained in scenarios S1–S4. In other words, scenario S5 simply reverses all the shocks contained in scenario S0. Thus, the updated database from implementing S5 is exactly the original 2008 baseline (from which S0 is simulated) and the percentage change results obtained from S5 correctly capturing the joint effects of imposing all the policy interventions (as summarized in Tables 1 and 2). In Box 1, we summarize the computational procedures and details of each scenario.
While simulating the above scenarios generates valuable estimates on the market and welfare effects of the actual policy interventions, establishing counterfactual scenarios with alternative policy instruments may help to reveal the relative efficiency of these policy actions. For this purpose, we design an additional scenario (against the same 2008 baseline without policy) where the simulated changes in domestic outputs of grains and oilseeds from scenario S5 are targeted, with a product-specific output (consumption) subsidy on these products being the endogenous instrument.Footnote 18 Such a scenario (S5a for short) provides a simple yet useful benchmark against which the estimated impacts on market prices, farm income, economic welfare, and government spending of the observed policy interventions (as simulated in S5) can be compared.
Due to the short-run nature of the policy responses to the food price crisis, a short-run perspective is assumed for all the above scenarios. In particular, we restrict the mobility of land across arable crops, permanent crops, and pastures, but do allow for imperfect mobility of land within each of the three agricultural activities (for example, in observing changes in domestic agricultural support measures). This is achieved by splitting land rents in the GTAP database across the three different land types and the different commodities according to land area data from the FAO. This split of the data then allows us to create three distinct land types as separate primary factors in the model and ensures that there is only one land type used for any given product. For each type of land, a constant elasticity of transformation function is used in the model to allocate that land type across different products. Capital is also assumed to be immobile to suit the short-run nature of the policy action taken by China in 2008. In particular, this assumption has particular relevance in the case of modeling export restrictions on input productions. For instance, China's fertilizer export tax policy was changed six times for 2008. It is unlikely that these policy changes triggered increased or reduced fertilizer production capacities in such short intervals.
4. Results
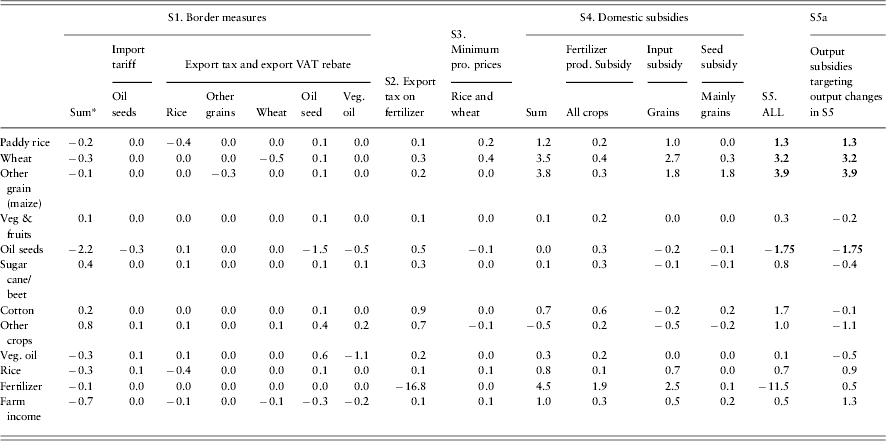
This section reports and analyzes the simulated individual and joint effects of the short-term trade policy responses and changes in the existing domestic support measures on domestic outputs, domestic market, and world market prices, and export quantities for key agricultural products (see Tables 3, 4, and 5, respectively). In addition, percentage changes in farm income are reported in the last row of Table 3 and welfare changes are reported in Table 6.
Simulated changes in agricultural outputs for selected products and chemical fertilizers (%)
Notes: *For scenarios with multiple policy measures, ‘sum’ refers to the total effects of imposing all the concerned instruments, while the subsequent columns in the same block provide a decomposition of the individual effects of individual policy measures according to the method developed by Harrison et al. (Reference Harrison, Horridge and Pearson2000).
Source: Simulation results.
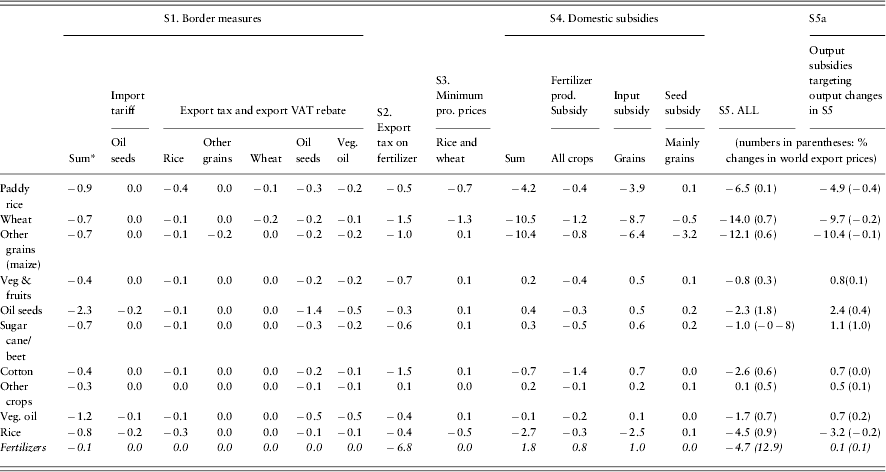
Simulated changes in domestic market prices for selected agricultural products and chemical fertilizers (\,percent)
Notes: *For scenarios with multiple policy measures, ‘sum’ refers to the total effects of imposing all the concerned instruments, while the subsequent columns in the same block provide a decomposition of the individual effects of individual policy measures.
Source: Simulation results.
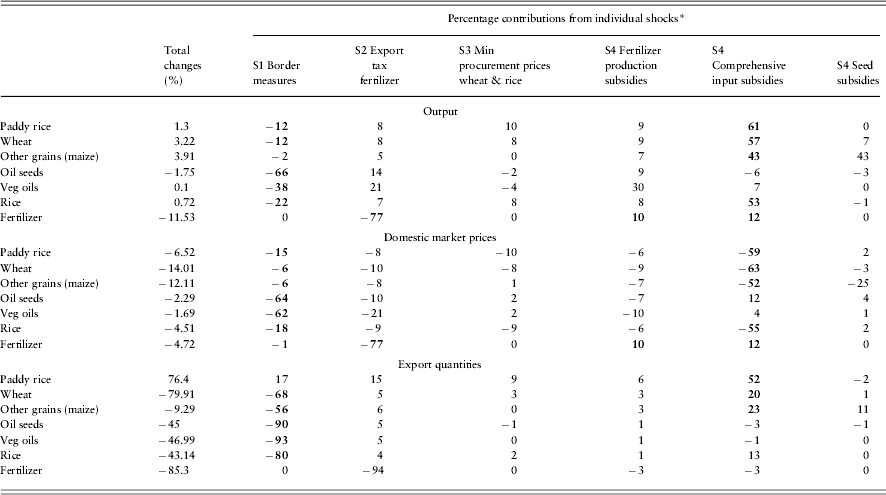
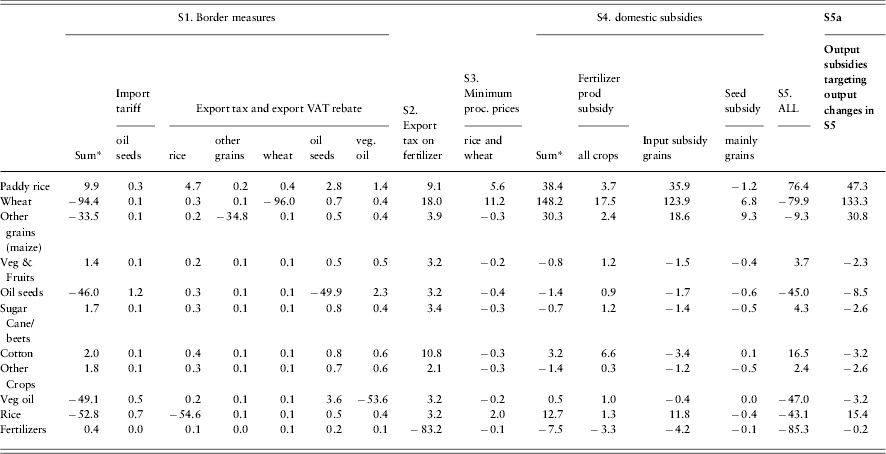
Percentage contributions to simulated changes in outputs, domestic prices and export quantities obtained from scenario S5
Notes: *Let us use x ij to denote the computed contributions (\,percentage changes) by shock j to output/market price/export quantity of product i, obtained by using the ‘subtotal’ routine developed by Harrison et al. (Reference Harrison, Horridge and Pearson2000). Use X i to denote the computed total changes for product i. Then X i=Σjxij. The normalized percentage contribution by individual shock j to product i is then computed as: 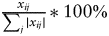 $\textstyle{{x_{ij}} \over {\sum _j |x_{ij}|}} *100\% $. The advantage of this normalization is that the sum of the absolute values of the normalized contributions is 100%. It also clearly illustrates how different instruments may offset the effect of each other.
Source: Authors' calculation based on simulation results.
Welfare changes (measured in equivalent variations, millions of US dollars)
Source: Simulation results.
S1. Effects of imposing export tax and eliminating export VAT rebates on grains and soybeans
The imposition of export taxes and elimination of export VAT rebates (which is similar to the removal of export subsidies) generally increase export prices, lower the corresponding domestic market prices, thereby reducing exports and dampening domestic outputs. Indeed, these measures are shown to significantly reduce exports of rice (processed), wheat, other grains (maize), and oil seeds (soybeans) by about 53%, 94%, 34%, and 46%, respectively (see Appendix table 3).
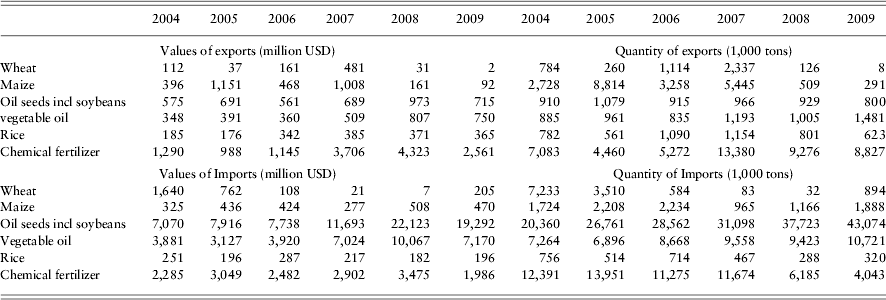
These changes in agricultural exports influence their domestic outputs (Table 3). In particular, domestic outputs of oil seeds drop the most by 2.2%, followed by more modest output reductions of rice, wheat, and other grains (maize) at respectively 0.3%, 0.3%, and 0.1%. In contrast to the estimated changes in exports for these products, the estimated output changes seem to be quite modest. This is because except for soybeans, most of these commodities are not traded (either imported or exported) heavily by China and exports as a share of domestic use remain quite small at around 1% (see Appendix Table 1 for imports and exports of major agricultural commodities into and from China in recent years).
Accompanying the estimated reductions in domestic outputs, domestic market prices are also estimated to be lowered by these export measures (Table 4), ranging from reductions of about 0.8% for rice (processed), to 0.7% for wheat, and 2.3% for oil seeds (soybeans). The lowered oil seeds price (by 2.3%) corresponds to about 1.2% reduction in domestic market price for vegetable oils. The increased export taxes (of 5%) and eliminations of export tax rebates (from the levels of 13–17%) on oil seeds and vegetable oil each contributes half a percentage point of the estimated decrease in vegetable oil price.Footnote 19 These lowered prices and reduced outputs lead to 0.7% reduction of farm income, with the export restrictions on oil seeds, vegetable oils, and rice being the main contributors. Clearly, while the export measures result in lower domestic market prices which benefit consumers, it also places a cost on producers and in particular, farm income drops as a result of lowered agricultural outputs and reduced domestic market prices. In terms of economic welfare, these are indications of production efficiency costs of the export measures examined in this scenario.
S2. Effects of imposing export tax on fertilizers
In contrast to the export measures on agricultural products, export taxes placed on agricultural inputs such as fertilizers have different intentions and lead to different effects: they reduce domestic costs of these inputs and therefore contribute to lowering domestic market prices of agricultural outputs; however, by lowering domestic input prices, they also discourage domestic input production. The exact effects on agricultural production and domestic market price depend on the intensities of these inputs in producing individual products. Simulation results from scenario S2 show that outputs of major agricultural products such as paddy rice, wheat, cotton, and other crops rise marginally. These modest changes in outputs can be justified by the estimated reductions in domestic market prices for essentially all agricultural products, most notably on wheat (1.5%) and other grains (1%). As a result of rising domestic outputs and decreasing domestic prices, agricultural exports also increase marginally. On balance, the effect of lowered input cost is nearly offset by the lowered domestic market prices, leading to slightly higher farm income.
Compared to the above discussed effects on agricultural outputs, fertilizer export restrictions affect fertilizer production, exports, and prices in a more pronounced way. Simulation results show that the 62% average export tax on fertilizer reduces China's fertilizer exports by over 83%, which implies nearly 17% reductions of domestic fertilizer outputs in the short run.Footnote 20 Domestic market price for fertilizer also drops by nearly 7%.
In summary, the objective of restricting fertilizer exports for keeping input costs low for producers seems to be realized as these export taxes lead to small increases in domestic agricultural outputs and more noticeable decreases in their domestic market prices. However, these export taxes certainly discourage domestic fertilizer production by greatly limiting their supply to the world market. As will be discussed in Scenario 4, in conjunction with the export restrictions on fertilizers, China ended up increasing its domestic subsidies on fertilizers, which moderates the disincentives placed by these export restrictions on fertilizer production.
S3. Effects of increasing minimum procurement prices for wheat and rice
Simulation results show that the increased fiscal spending of RMB 5.7 billion due to increased minimum procurement prices for wheat and rice indeed reduces domestic market prices for rice and wheat (0.7% and 1.3% respectively) but only slightly increases producer prices by less than 0.2%. In responding to slightly increased producer prices, outputs of wheat and rice are increased marginally by 0.3% and 0.2%, respectively. As such, farm income is actually slightly higher (0.1%). Therefore, this market price measure partially offsets the negative effects on rice and wheat production and farm income caused by the export measures discussed in scenario S1.
S4. Effects of increasing domestic subsidies to agricultural inputs and fertilizer production
Scenario S4 focuses on the increased spending on three domestic measures, namely, the comprehensive input subsidy program, the improved seed program for grains, and the production/distribution subsidies on fertilizers used for all crops.Footnote 21 All these subsidies contribute to lowering production costs, moderating rises of domestic market prices, and increasing outputs of grains. Domestic outputs increase the most for other grains (maize) at 3.8%, followed by wheat at 3.5%, and paddy rice at 1.2%. Domestic market prices drop more: 4.2% for paddy rice, 10.5% for wheat, and 10.4% for other grains (maize). Due to lowered domestic market prices, even with the presence of export taxes, in this case China would be able to increase its exports to the world market most notably for wheat, and then rice and other grains. Farm income is estimated to increase by nearly1.1% due to the increased spending on these subsidies, which more than compensates the estimated farm income losses resulting from the short-term export measures (0.7%, as reported for scenario S1).
Among the three types of domestic support measures considered, the comprehensive input subsidies on fertilizers, pesticides, and other chemicals and fuels seem to generate the largest output expansion and price reduction effects for grains. For instance, more than 1 percentage point of the 1.2% increase in paddy rice output and 2.7 percentage points of the 2.9% increase in wheat output are due to the increased spending in the comprehensive input subsidy program; whereas 3.9 percentage points of the 4.4% reduction in paddy rice price and 8.7 percentage points of the 10.5% reduction in wheat price are caused by the increased spending in the same program. Despite the reductions in grain market prices, increases in grain outputs and reduced input costs actually lead to increased farm income at about 1.1%, around half of which is due to the increased comprehensive input subsidies. This result is quite understandable as the change in spending on this program between 2006 and 2008 is the largest (valued at nearly RMB 52 billion) among all the domestic support measures considered here. Another reason is that unlike the production and distribution subsidies given to fertilizers (which reduce production costs for all agricultural products), the comprehensive subsidies mainly benefit grain productions by design.
In the case of fertilizers, increased spending on both the comprehensive input subsidies and fertilizer production subsidies leads to higher domestic fertilizer outputs at 2.5% and 1.9% respectively, and jointly they contribute to the 4.5% increase in fertilizer production. At the same time, these subsidies lead to higher fertilizer prices due to increased demand triggered by these subsidies. These positive domestic output and market price effects for fertilizers are in stark contrast to the negative output and price effects caused by the fertilizer export taxes discussed in scenario S2. However, the large increase in the input-based domestic subsidies (to the tune of about RMB 73 billion) only offsets less than one-third of the negative price and output effects for fertilizers caused by the export taxes.
In summary, while the increase in domestic input-based subsidies helps boost grain outputs and moderate rises in grain prices, they are nevertheless quite expensive, especially considering the very small increase in farm income achieved and how these subsidies are used to offset the negative consequences on input production caused by fertilizer export taxes.
S5. Joint effects of short-term trade policy measures and increasing domestic subsidies
When all the short-term trade policy measures and domestic support policy measures examined in S1–S4 are considered jointly, the combined effects of all these policy measures are obtained. Results from scenario S5 summarize these joint effects, which are reported in the next to last columns in Tables 3–5. Results reported for the previous scenarios in these tables can be seen as an indicative decomposition of the results for scenario S5, while an exact decomposition of the contributions from individual shocks to the cumulative results obtained from S5 is offered in Table 5, where for presentation purposes contributions from individual shocks are normalized such that the sum of the absolute values of all shocks amounts to 100% (see Table 5 note).Footnote 22
On aggregate, the combined forces of all the policy measures have the joint effects of boosting outputs for many agricultural products up to nearly 4%, indicating that the extra spending on existing domestic support measures is able to compensate for the negative output effects due to the short-term border measures (Table 3). In particular, grain outputs are estimated to increase: 1.3% for paddy rice, 3.2% for wheat, and 3.9% for other grains (maize). The only key product that is estimated to be negatively influenced by all these measures is oil seeds (soybeans) with an estimated 1.8% decrease in outputs. This is partially due to the joint effects of the reduced import tariff and increased export restrictions on soybeans outweighing the incentives offered through the input-based subsidy programs. The more favorable input subsidies on grains (which are not provided to oil seeds production) also divert intermediate inputs and mobile primary factors away from oilseeds production, as can be seen from the negative effects of the instruments used for other products in scenarios S3 and S4 on oil seeds in Table 3. Finally, export restrictions on vegetable oils also lower export demand for oilseeds.
The relative importance of the individual policy actions explored in scenarios S1–S4 in contributing to the joint output effects (as reported above) can be obtained by inspecting the top panel of Table 5. For the three major grain products, it is clear that the comprehensive input subsidies generate dominant positive effects and contribute near or more than half of the output increases of these products. Fertilizer production subsidies and seed subsidies also increase agriculture outputs, but their effects are generally dwarfed by those caused by the comprehensive input subsidies. In contrast, border measures explored in scenario S1 universally reduce grain outputs, but their negative output effects are far less than the positive effects due to the comprehensive input subsidies. In the case of the export tax on fertilizer, it is clear that this tax marginally increases all agricultural outputs but drastically reduces fertilizer outputs.
Since both sets of policies generally reduce domestic market prices – as discussed in scenarios S1–S4 – the price stabilizing effects are mutually strengthening between the two types of policies (see Table 4). On aggregate, domestic market prices for grain are lowered by between 6.5 for paddy rice to 14% for wheat (as compared to the situation where these policy measures are absent), and between 1% and 3% for other agricultural products. According to China's statistical yearbook (National Bureau of Statistics of China, 2009), the year-on-year retailing price index and producers’ price index for grains in 2008 are respectively 7% and 7.1%.Footnote 23 Relative to these official price indexes, our estimated domestic market price effects due to the policy measures are quite large, suggesting that in the absence of these policy measures, grain prices would have increased to much higher levels.
The middle panel of Table 5 presents the normalized percentage contributions to the above price effects by individual policy actions. It is clear that as compared to the short-term border measures, the domestic policy measures contribute more to the reductions of domestic market prices for grains, with near or more than two-thirds of the price reductions attributable to the increased spending on these domestic subsidies. Again, the comprehensive input subsidies prove to be the dominant force in stabilizing domestic market prices for grains. While almost all policy instruments contribute to reducing market prices for grains, it is clear that the comprehensive input subsidies given to grains actually increases market prices for oil seeds (soybeans) and vegetable oils. This is because the comprehensive input subsidies reduce production costs for grains and increase their outputs, the latter of which leads to competition for resources (arable land and labor) previously used in oil seeds production.
In the case of fertilizers, while export restrictions are estimated to severely reduce their domestic outputs and market prices (16.8% and 6.8% respectively), increased domestic subsidies only partially offset these negative consequences and lead to lower reductions in fertilizer outputs and market prices (11.5% and 4.7% respectively). Again, these negative effects on input producers need to be considered when evaluating the costs of these policy responses to food price rises.
On the trade side, although the world market price effects of these policy measures are not the focus of the current paper, China's policy actions do affect the world market through reduced exports and increased imports in the case of oil seeds (soybeans). Reduced exports are most pronounced in relative terms for wheat, rice, and oil seeds, and other grains (maize). However, other than soybean, China has not been a large exporter/importer for grains in recent years and both imports and exports of grains constitute a very small share of China's domestic production and use of these products (see Appendix table 2). So the extent to which China's action contributed to the food price crisis can be exaggerated, as pointed out by Abbott (Reference Abbott2009) and certainly supported by results from the current study which suggests that China's policy action contributed to less than 1% increase in world market prices for grains (see numbers listed in parentheses in the next to last column in Table 4).Footnote 24
Lastly, farm income is estimated to increase by half of a percentage point. As reported in scenarios S1–S4, while the short-term border measures reduce farm income, increased spending on the domestic measures helps increase farm income which more than offsets the negative farm income effect caused by the border measures. Nevertheless, the joint farm income effect is very small, especially considering the size of increased spending on the domestic measures.Footnote 25
S5a. Market and welfare effects of alternative policy instrument: output subsidies
When a direct output subsidy is provided (as simulated in scenario S5a) to generate the same levels of domestic outputs of grains and oilseeds in China as in scenario S5, lower domestic market prices for these products – ranging from nearly 5% for paddy rice and more than 10% for other grains – are achieved (last column in Table 4). Although these decreases in grain prices appear to be somewhat smaller than those obtained from the scenario S5 (next to last column in Table 4), they nevertheless ensure the same levels of domestic supply by design of the scenario. Furthermore, as domestic grain supply is secured and no export restrictions are imposed, China would not have contributed to increased world grain prices (see numbers in parentheses in the last column of Table 4). Lastly, when the fertilizer policies are not used, fertilizer outputs are estimated to increase slightly (an increase of 0.5% vs. a decrease of 11.5% in scenario S5; see Table 3). By creating gaps between producers’ and market prices of grains, these output subsidies also push up prices received by producers of paddy rice and wheat (by 2% and 1% respectively) and lead to a small decreases of producers’ price of other grains (by –2.2%). These results greatly contrast with those obtained from scenario S5 where changes in producers’ prices generally follow those of the corresponding market prices. As a result of increased grain outputs and increased or slightly reduced producers’ prices, farm income improves by 1.3%, as compared to the 0.5% increase simulated in S5 (last row in Table 3).
How much would these output subsides cost the Chinese government? The endogenously determined output subsidy rates are respectively 7.3%, 11.8%, and 9.2% for paddy rice, wheat, and other grains. The implied government spending on these output subsidies is about RMB 65 billion. Taking into consideration the savings from not implementing the domestic policy interventions in 2008, the net saving of government spending on agriculture domestic support is estimated to be nearly RMB 28 billion. Since scenario S5a also assumes away the border measures simulated in scenario S5 (see Table 1) which increased government revenue by nearly RMB 11 billion, the total net saving of government revenue would be about RMB 17 billion when using the output subsidy instruments to replace the observed border and domestic policy interventions.
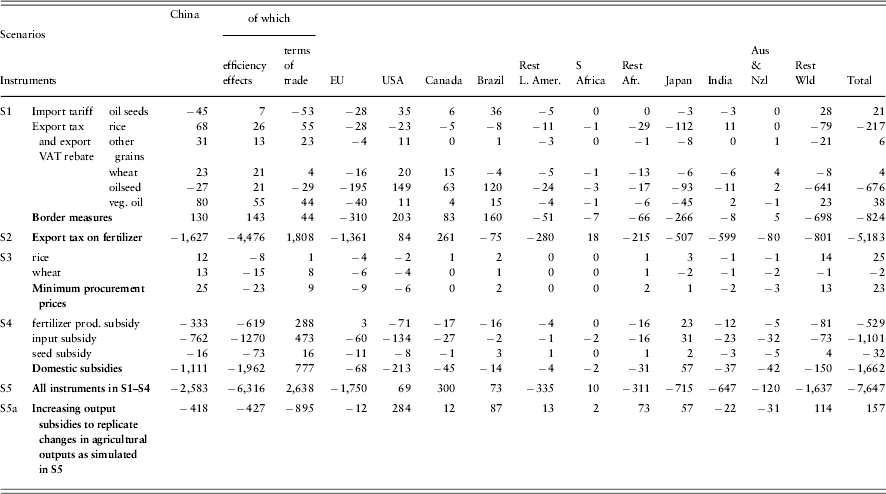
To evaluate the welfare consequence of this alternative approach, we now turn to results on welfare changes measured in equivalent variations, as presented in Table 6. Scenario S5 results in a large reduction of welfare for China, measured at nearly US$ 2.6 billion. This is mainly due to a very large allocation efficiency loss (of US$ 6.3 billion) which is only partially offset by a terms of trade gain of more than US$ 2.6 billion. The main contributors to the efficiency loss are the export tax on fertilizers which severely limited domestic production of fertilizers and the various domestic input subsidies. The sizable terms of trade gain is mainly associated with the fertilizer export tax (because it increases world market prices of fertilizers) and the various domestic subsidies. In contrast, in the alternative scenario S5a, both allocation efficiency and terms of trade effects are estimated to be quite moderate and the aggregated welfare loss (taking into consideration of the other elements of the welfare function) is only one-sixth of the estimated loss from Scenario 5. Since the terms of trade for the rest of the world are not as adversely impacted by the output subsidies, the welfare effects for the rest of the world are found to be almost neutral on aggregate.
To sum up, with a smaller government expenditure on the direct output subsidy, the Chinese government could have achieved – as compared to scenario S5 with the observed policy interventions in 2008 – the same levels of domestic grain outputs, similar effects on moderating rises of domestic market prices, higher farm incomes, and a small welfare loss that is only a fraction of that of scenario S5. Moreover, the negative externalities of China's policy actions on the rest of the world could have been avoided using the alternative instrument.
5. Conclusions and discussions
Few studies in the existing literature have investigated the complex interactions among the domestic and trade policy measures many national governments adopted to combat the 2007/8 global food price crisis. This paper provides a first quantitative assessment on the individual and joint effects of China's short-term trade policy actions and existing domestic support measures on domestic market prices, outputs, trade flows, and farm income in China. The analysis is based on a global CGE model characterized by detailed and up-to-date policy information for China in the year of 2008. A base case characterizing the agricultural trade and production situation and the associated policy environment for China is constructed for that year and is used for establishing and simulating five counterfactual scenarios to estimate the individual and joint effects of China's policy actions in 2008.
A series of interesting results emerge from these quantitative exercises. First, grain outputs in China are estimated to be boosted by up to 4 percentage points due to all the policy interventions, with the extra government spending on key input-based subsidy programs in 2008 (over and above the pre-crisis level in 2006) being more than enough to compensate for the lowered outputs due to the short-term border measures. Second, while both the short-term trade policy measures and increased spending on existing domestic measures are able to reduce domestic market prices, more than two-thirds of the reductions of grain prices are due to the increased spending on the domestic measures. Third, export tax on fertilizers and more importantly the increased comprehensive input subsidies (especially on fertilizers) are important contributors to the above output and domestic market price effects. However, these two measures generate offsetting output and price effects on fertilizer itself. Fourth, the domestic market price reduction effects of the observed policy measures are shown to be large and significant, relative to the observed agriculture and food price indexes in China in 2008, indicating that in the absence of these policy actions, the domestic market price could have risen much more. Lastly, while China seems to be quite successful in tackling food price inflation using a combination of policy measures, the fiscal and efficiency costs are not negligible, especially if one considers the extra government spending on the input subsidies seemingly necessitated by insulating trade and border policy measures. Our results indicate that the increased spending on the domestic measures generated very little increase in farm income. If instead all border and domestic policy interventions were replaced by a single direct output subsidy on grains – as simulated in our alternative scenario – more efficient market and welfare outcomes would be realized with less overall government spending.
These results suggest that the short-run insulating trade policy measures aiming at protecting poor consumers at the time of high food prices undermine the longer-term domestic policy measures designed for maintaining incentives for agricultural production, especially grain production in the case of China. Ironically, it has been suggested that maintaining agricultural production incentives should be the long-term solution to tackling future price volatilities. Facing this dilemma, in 2008 the Chinese government increased its spending on existing domestic programs, which are shown to be able to compensate for the losses in agricultural production incentives due to the short-term trade policy measures. This clearly illustrates the expensive nature of the policy actions aimed at balancing short-term and long-term policy goals during the world food price crisis. It is also worth noting that the three domestic support programs considered in this paper are all input-based measures, with two of them being tied to fertilizer and other purchased inputs. Our estimates show that these fertilizer-based subsidies dominate both the domestic output and market price effects for grains. As the intensity of fertilizer use in Chinese agricultural has already been very high, the continued emphasis on fertilizer subsidies as both a short- and long-run solution for maintaining stable domestic grain production and supply should be re-evaluated, especially with respect to the potential environmental consequences and the long-term sustainability of China's agricultural resource base.
Appendix
China's agricultural trade flows, selected products: 2004–2009
Export/production, import/production and production/consumption ratios in China's agricultural and food sectors: GTAP 8 database and the Calibrated database
Simulated changes in export quantities for selected agricultural products and chemical fertilizers (percent)