Introduction
The Luoping Biota within the Guanling Formation in Yunnan Province, China, is the most recently discovered and most diverse of Triassic faunas in the region documenting the recovery of communities following the end-Permian extinction event (Fig. 1.1). The truly remarkable number of specimens collected, well over 20,000 to date, and the variety of taxa recently have been summarized and interpreted by Hu et al. (2010) and Benton et al. (Reference Benton, Zhang, Hu, Chen, Wen, Liu, Huang, Zhou, Xie, Tong and Choo2013). Arthropods comprise the most numerous members of the fauna, and studies of them are ongoing. Zhang et al. (Reference Zhang, Zhou, Lü, Xie, Luo, Liu, Sun, Huang and Zhao2009) described a new genus and species of horseshoe crab, and Fu et al. (Reference Fu, Wilson, Jiang, Sun, Hao and Sun2010) recognized a new species of isopod. Decapod crustaceans have been the subject of recent studies with lobsters being reported by Feldmann et al. (Reference Feldmann, Schweitzer, Hu, Zhang, Zhou, Xie, Huang and Wen2012) and shrimp studied by Schweitzer et al. (Reference Schweitzer, Feldmann, Hu, Huang, Zhou, Zhang, Wen and Xie2014). Millipedes, cycloids, thylacocephalan, and mysidacean crustaceans are currently under study by the Sino-American joint team. Conchostracans and ostracods are yet to be described. The remainder of the invertebrate fauna, including bivalve and gastropod mollusks, crinoid and echinoid echinoderms, and inarticulate brachiopods encountered in this study are unstudied.
(1) Locality map of China and Yunnan Province showing location of Luoping Biota localities with respect to Kunming and Luoping. (2) Stratigraphic column of Guanling Formation, showing stratigraphic position of layers mapped in this study. Modified from Hu et al. (Reference Hu, Zhang, Chen, Zhou, Lü, Xie, Wen, Huang and Benton2010).

The remarkable abundance of arthropods in the Luoping Biota prompted the present inquiry into the spatial distribution of organisms within the unit with special attention to the decapods, thylacocephalans, and mysidaceans. The biota is present on numerous bedding layers within the Guanling Formation; however, many of the fossils were removed from the quarries so that it is currently not possible to inventory fossil occurrences from all the layers. Fortunately, some layers have not been extensively collected and are exposed over a great enough area to permit evaluation of faunal diversity and spatial distribution on these levels. Five such levels were selected for detailed mapping (Fig. 1.2) with the purpose of evaluating and interpreting the interrelationship of organisms preserved on single horizons. That is the purpose of this work.
Stratigraphic and environmental setting
The Guanling Formation, approximately 1010 m thick, is subdivided into two members. The part of the sequence containing the Luoping Biota and studied in the present work lies within the middle of Member II (Fig. 1.2). In this part of the section, the rocks consist of dark, fine-grained limestones exhibiting parallel, thin (<1 mm) alternating light and dark grey layers. The interface between layers typically is gradational. A few are separated by even thinner, black, rippled layers, possibly algal or microbial laminates (Hu et al., Reference Hu, Zhang, Chen, Zhou, Lü, Xie, Wen, Huang and Benton2010). The generally uniform layering suggests that the sediment was deposited in a quiet-water setting and that there was little or no subsequent bioturbation. Isotopic analyses of carbon (Sun et al., Reference Sun, Liu, Lü, Xu, Zhang, Lou and Jiang2009, p. 1112) indicate a negative carbon excursion, δ13C of approximately −4‰, in this part of the section that was interpreted by the authors as signaling a reducing environment. This interpretation was further supported by geochemical analyses (Zhou et al., Reference Zhou, Qiyue, Hu, Lü and Bai2010), which indicated that the seafloor was anoxic. Hu et al. (Reference Hu, Zhang, Chen, Zhou, Lü, Xie, Wen, Huang and Benton2010) acknowledged this interpretation and expanded the interpretation of the conditions as dysoxic or anoxic. Coupled with the observations of the sediment composition and structure as well as the paucity of benthic organisms, discussed below, the interpretation of inhospitable bottom conditions seems quite well supported.
Oxygen isotopic analyses (Sun et al., Reference Sun, Liu, Lü, Xu, Zhang, Lou and Jiang2009, p. 1112) yielded values between δ18O of −2.5% to −1‰. Based upon those values, they concluded that water temperature was approximately 29°C, presumably at or near the surface. Using geochemical indicators of Jing et al. (Reference Jing, Zhang and Lin2005), Zhou et al. (Reference Zhou, Qiyue, Hu, Lü and Bai2010) concluded that the Luoping rocks were deposited on a marginal platform slope in deep water. Benton et al. (Reference Benton, Zhang, Hu, Chen, Wen, Liu, Huang, Zhou, Xie, Tong and Choo2013) positioned the Luoping occurrences in a shallow marine setting near the margin of the Nanpanjiang Basin.
Summarizing the relevant information on the paleoenvironment in which the Luoping Biota was deposited, sediments were deposited in a quiet water, offshore, oxygen-deficient environment. Bioturbation of the rocks on the surfaces that were studied and mapped was limited to non-existent. The water over the depositional site was warm.
Methods
Two sites within the Guanling Formation known to expose the Luoping Biota were examined to determine the specific horizons that would be suitable for studying aerial distribution of fossils. Within the primary quarry (Quarry 1), N24°46' 46.8''N, 104°19'40.6''E, a single large bedding surface was selected (Figs. 2.1, 2.2). The surface, which was over 31 m long and more than 14 m wide, extended nearly the entire length of the quarry (Fig. 2.2). Other surfaces in Quarry 1 were either too small or did not expose enough fossils to warrant a quantitative study. In the secondary quarry (Quarry 2), N24°46'12.4'', E104°18'44.5'', four surfaces were identified, exposing sufficient fossil material over a large enough area to yield a useful sample (Fig. 2.3, 2.4). Each of these layers was smaller than that at Quarry 1. The actual selection of surfaces to be mapped was based upon exposure of sufficient surface area and evidence that few, if any, fossils had been collected previously from the level.
(1) Overview of Quarry 1, showing all levels and layers. View from Northwest. (2) Layer 1 of Quarry 1, facing approximately due southwest. Layer 1 is largest flat surface in the image. (3) Overview of mapped portion of Quarry 2; conical hill is approximately due east. (4) Layer 3 of Quarry 2, showing grid and numbering. Due north is in upper left corner of image. Umbrella and pack (upper right) are sitting on Layer 2.
On each of the quarry surfaces to be mapped, a 0.5 m2 grid was used to construct the base maps. The grids were laid out in a north-south orientation and were marked on the bedding surface either by using a 0.5 m2 frame constructed of PVC tubing or by using lines struck using a carpenter’s chalk line. Each grid was numbered and corresponding grids were drawn and numbered in a field notebook for recording observations (Fig. 2.4). All observations were made on dry surfaces to assure uniform opportunity for recognizing fossil material. Surfaces wetted by rainfall took on a very different appearance, and fossils were difficult to recognize.
Each gridded quarry surface was examined by at least two team members, and the position of all recognized fossil material, including coprolites and burrows, was plotted in the notebook. Each fossil was identified, assigned an appropriate abbreviation, and located on the notebook grid map. When identifying specimens, care was taken to ensure that specimens were identified in the relevant categories, although identification to the level of genus or species was not attempted. In fact, many of the specimens were partial and precise identification could not be made. Based upon the exposure and degree of fragmentation of fossils, it was not possible to place most of the fossils into a family-level or lower category. Arthropods were placed within six categories: shrimp, lobsters, thylacocephalans, mysids, isopods, and cycloids. Fish were combined into a single category, although a few were complete enough and well enough preserved to be identified to genus. Molluscs were identified as either bivalves or gastropods, and echinoderms were mapped as either crinoids or echinoids. In addition to these forms, one brachiopod, Lingula; algae; non-fish bone; and trace fossils were recognized.
The location of fossils could readily be assigned to one of nine quadrants within the 0.5 m2 grid so that the location of each specimen could be positioned within the grid with an accuracy of less than 16 cm. The maps were transformed into digital format using a combination of Adobe Photoshop and Illustrator, and all body and trace fossils were located using the same abbreviations assigned in the field. It was judged that, for the purposes of this study, the position of coprolites, whose origin is not clear, was not relevant.
Examination of the sediment associated with the fossils and the cuticle of the mysidaceans was conducted using an AMRAY 1600 turbo scanning electron microscope (SEM) for imaging. Elemental dot mapping of selected areas and elemental spectral analyses employed a Phoenix EDAX Imaging/Mapping system and an Orion version 6 high resolution image grabbing system for Windows coupled with the SEM. Transverse sections of the sediment were studied, including the layer in which the mysids were abundant as well as the surface on which the fossils were exposed. Cuticle from a single specimen of mysidacean was examined to determine the nature and extent of diagenetic alteration. Images of specimens were made with a Leica Macroscope with Z6APO lens system and a Diagnostic SpotFlex digital camera and imaging software or a Nikon D3100 digital camera with 60 mm AF-S Micro Nikkor lens.
Results
Mapped surfaces
A total of five surfaces were mapped in the study. Their relative position stratigraphically was located in reference to a key marker bed within the studied sections (Fig. 1.2). This marker bed was a thick, massive, white limestone that could be recognized in both quarries permitting correlation between the two study sites.
Quarry 1
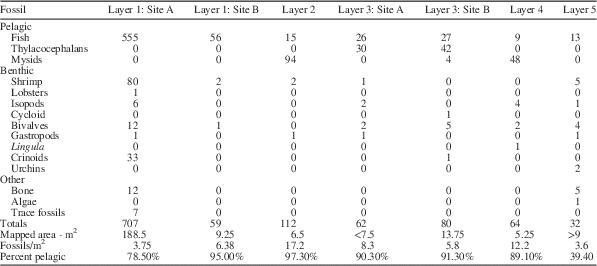
The lowermost surface, the large surface in Quarry 1, was 171cm below the base of the limestone. On this surface, it was possible to map 754 one-half square-meter grids, representing 188.5 m2 (Figs. 3–5). Seven hundred seven specimens arrayed within nine taxonomic categories (Table 1) were located within the mapped area. The density of fossils, excluding coprolites, was 3.75 fossils/m2. A second mapped area on the same bedding surface measured 9.25 m2 and 59 fossils were recognized, resulting in a density of 6.38 fossils/m2. This surface revealed only three types of fossils: fish, shrimp, and bivalves. In both areas, fish dominated the fossil content. The combined area on level 1, 197.75 m2, yielded 80% fish, 10.7% shrimp, and 4.3% crinoids, in addition to a lobster, isopods, bivalves, and other components. The fish comprised the only pelagic organisms mapped, so that 20% of the assemblage was benthic.
Index map for subunits of mapped surface of Quarry 1, shown in Figure 2, showing how subunits fit together in space.
Layer 1 mapped in Quarry 1, four subunits. Scales and abbreviations as indicated.
Layer 1 mapped in Quarry 1, six subunits. Scales and abbreviations as indicated.
Abundance of fossils in stratigraphic order.
Quarry 2
All the mapped levels stratigraphically above the layer forming the main quarry floor in Quarry 1 were exposed in Quarry 2 (Fig. 6). The lowermost of these layers (Layer 2) was 157 cm below the base of the limestone marker bed. Twenty-six 0.5 m2 grids representing 6.5 m2 of area yielded 112 fossils in four taxonomic categories. The density of fossils was 17.2 fossils/m2. This level was overwhelmingly dominated by mysidacean shrimp (Fig. 7.1), 84% of the fossils recognized, with fish (Fig. 7.4) comprising another 13.4% of the assemblage. Shrimp (Fig. 7.3) and bivalves were the only other organisms recognized. In excess of 97% of the specimens identified on this surface were pelagic.
Layers 2–5 of Quarry 2. Scales and abbreviations as indicated.
Arthropods and most abundant fish on the mapped layers of the Guanling Formation. (1) Mysidacean crustacean, (2) thylacocephalan crustacean; rare arthropod fossils but common in this study, (3) shrimp, and (4) fish. Scales as indicated. Coins in (3) and (4)=10 mm.
The next higher level (Layer 3 and 3A), 41 cm below the base of the limestone marker was mapped as two separate areas on the same bedding level. The combined area was 21.25 m2 on which 142 fossils were mapped. One of the areas had a density of 8.3 fossils/m2 and the other had a density of 5.8 fossils/m2. Both were dominated by thylacocephalans (Fig. 7.2) (50.7%), with fish comprising the next most abundant element (37.3%). Mysids, shrimp, isopods, and the sole cycloid identified in the study together comprised 5.6% of the total, with bivalves, one gastropod, and one crinoid as the only other components of the assemblage, 6.3%. Pelagic components, primarily thylacocephalans, fish, and a few mysids, accounted for more than 88% of mapped organisms.
Thirty centimeters above the top of the marker limestone, the next highest level (Layer 4) was 5.25 m2 and contained 64 fossils yielding a density of 12.2 fossils/m2. The assemblage was dominated by mysids (75%), with fish (14%) as the next most common component. Other than the mysids, isopods (6.3%) were the only other arthropods. Bivalves (3.1%) and a single linguloid brachiopod were the only other components of the assemblage. Eighty-nine percent of the assemblage was pelagic.
The uppermost mapped level (Layer 5), 190 cm above the top of the limestone layer, was more than 9 m2, had 32 fossil specimens, and had a density of approximately 3.6 fossils/m2. Fish were the most common fossils (40.6%) with the remainder of fossils including shrimp, isopods, bivalves, gastropods, urchins, algae, and non-fish bone. This level was dominated by benthic organisms.
Sediment and cuticle analysis
SEM examination of a cross section of the rock layer containing the mysids on Layer 2 in Quarry 2 revealed extremely thin, parallel laminated beds (Fig. 8.1). Elemental analysis of the layers, using energy-dispersive spectroscopy (EDS) analysis , recorded strong calcium and oxygen peaks indicative of the CaCO3 bulk composition of the sediment (Fig. 8.2), also documented by testing with dilute hydrochloric acid. Lesser amounts of magnesium, aluminum, and silicon were also noted. Examination of the surface of the rock specimen on which the mysids were preserved showed an irregular surface consisting of small bulbous masses resulting in a cloud-like appearance (Fig. 8.3). EDS analysis of that surface revealed strong oxygen, aluminum and silicon peaks (Fig. 8.4). In opposition to the analysis of the cross-section, calcium was greatly reduced. The composition of the surface, which upon megascopic examination was light grey, appears to be a clay-rich weathering surface.
SEM and EDS analysis of rock layer from which mysidacean crustacean was collected from Quarry 2. (1) SEM image of layers, fossil occurs on the uppermost layer; (2) energy-dispersive X-ray elemental spectrum of layers shown in (1). (3) SEM image of upper surface showing weathering residue. (4) Energy-dispersive X-ray elemental spectrum of layers shown in (3). Scale bars represent 0.1 mm.
Examination of a small fragment of the pleon of a mysidacean with SEM documented the presence of cuticular material (Fig. 9.1). Elemental analysis of the cuticle and some of the adjacent rock surface indicated a marked increase in phosphorous (Fig. 9.2) as compared to the spectrum for the whole rock (Fig. 9.3). Elemental dot mapping of the scanned surface illustrated an increase in concentration of calcium in the areas of exposed cuticle (Fig. 9.4) and a strong concentration of phosphorous in that same area (Fig. 9.5). The analysis supports the contention that the cuticle had been altered to apatite, CaPO4.
(1) SEM image of a fragment of the pleon of a mysidacean crustacean. (2) Energy-dispersive X-ray elemental spectrum of cuticle surface showing increase in relative amounts of phosphorous. (3) Energy-dispersive X-ray elemental spectrum of layers just below fossiliferous layer for comparison with Figure 2. (4) Elemental dot map showing the distribution of calcium over the scanned area. Note the elevated concentration in the area of the cuticle. (5) Elemental dot map showing the distribution of phosphorous over the scanned area. Note the elevated concentration in the area of the cuticle. Scale bar represents 1 mm.
A second sample of cuticle was examined in cross-section. The sediment above and below the cuticle varied from light to dark grey, but no difference was noted in the spectral analysis. Carbon coating of the sample precludes evaluation of variation of that element; in all likelihood, the color variation in the sediment reflects varying amounts of carbon.
Interpretations
Overview
The specimens collected on the five layers that were mapped were arrayed into three categories: pelagic, benthic, and other (Table 1). Pelagic organisms included fish, thylacocephalans, and mysids. The remainder of the fauna used in subsequent analyses was assigned a benthic lifestyle. Forms considered “other” included non-fish bone fragments, algae, and trace fossils.
Pelagic component
The pelagic component in this study consists solely of organisms interpreted to be nektonic. Reference to that element of the fauna as “pelagic” is intended to distinguish those organisms living within the water column as opposed to those living on, or in, the substrate. Although historically there has been some debate regarding whether thylacocephalans were pelagic, the preponderance of morphological evidence now favors a swimming lifestyle. When first recognized, Pinna et al. (Reference Pinna, Arduini, Pesarini and Teruzzi1982) named the class Thylacocephala and interpreted the animals to be benthic organisms resting on the substrate or buried slightly within it. At almost the same time, and independently, Briggs and Rolfe (Reference Briggs and Rolfe1983) named the order Concavicarida for specimens in Australia, and Secretan (Reference Secretan1983) proposed the class Conchyliocarida for material from France. Reconstructions by Pinna et al. (Reference Pinna, Arduini, Pesarini and Teruzzi1982, fig. 4) of the organisms not only illustrated a benthic lifestyle but also suggested that the large, bulbous structure now considered to be an ocular surface was situated in the substrate with the posterior extended above the substrate. Secretan (Reference Secretan1985, p. 389) recognized the possibility that these three newly named groups might be closely related. That position has been sustained by subsequent workers (Rolfe, Reference Rolfe1985; Schram, Reference Schram1990; Schram et al., Reference Schram, Hof and Steeman1999; Vannier et al., Reference Vannier, Chen, Huanbg, Charbonnier and Wang2006; Charbonnier et al., Reference Charbonnier, Vannier, Hantzpergue and Gaillard2010).
Subsequent to the work of Pinna et al., the lifestyle of thylacocephalans has been the subject of much discussion. Secretan (Reference Secretan1985) reversed the position of the animals with respect to Pinna’s reconstruction, considering the bulbous structures to be large compound eyes. She concluded that the animals illustrated by Pinna were large—carapace approximately 4 cm long—and massive, maintaining that they were benthic predators typically lying partially buried in the substrate. Secretan (Reference Secretan1985, p. 389) concurred with Roger (Reference Roger1946) that the Cretaceous forms from Lebanon were likely pelagic, a position supported by Schram et al. (Reference Schram, Hof and Steeman1999). Thus, she introduced the possibility that both benthic and pelagic lifestyles were possible. Rolfe (Reference Rolfe1985) proposed a mesopelagic lifestyle for thylacocephalans based upon possession of such large eyes and the possible development of photophores. Whether the organisms occupied a mesopelagic realm or were inhabitants of shallower water, recent workers agree that thylacocephalans were pelagic predators (Schram et al., Reference Schram, Hof and Steeman1999; Vannier et al., Reference Vannier, Chen, Huanbg, Charbonnier and Wang2006; Charbonnier et al., Reference Charbonnier, Vannier, Hantzpergue and Gaillard2010). Thus, we assign this group to the suite of pelagic organisms. The studies conducted to date on the thylacocephalans document a long geological range and a broad geographic range.
The other two groups of organisms placed within the pelagic realm are less contentious. Fish are typically nektonic, and the small fish that are most abundant on the mapped surfaces, probably eugnathids (Hu et al., Reference Hu, Zhang, Chen, Zhou, Lü, Xie, Wen, Huang and Benton2010), have a body form typical of small, schooling fish.
Mysids are also typically pelagic, although Hessler (Reference Hessler1969) noted that some extant forms may live close to the substrate and some burrow into the substrate during the day (1969, p. R364). Schram (Reference Schram1986) and Taylor et al. (Reference Taylor, Schram and Yan-Bin2001) suggested a benthic lifestyle for some mysids based upon possession of “ambulatory” pereiopods (Taylor et al., Reference Taylor, Schram and Yan-Bin2001, p. 313) and relatively short pleopods. However, in contrast, the presence of long, filamentous pleopods and long, natatory pereiopods would support the interpretation that the mysids from Luoping are swimmers. Thus, it seems most parsimonious to consider the sole mysid currently recognized from the Luoping Biota, ?Schimperella sp., to be a pelagic organism. This interpretation is based upon the apparent adaptation of the pereiopods and pleopods for swimming. Although not conclusive, the observation that where they were mapped, they occurred in large swarms, further reinforces this conclusion.
Benthic component
The benthic assemblage recognized on the bedding surfaces that were mapped includes shrimp, lobsters, isopods, and cycloids among the arthropods. Other groups are bivalve and gastropod mollusks; the inarticulate brachiopod, Lingula; and crinoid and echinoid echinoderms. Detailed systematic work on groups other than the arthropods has not been undertaken; therefore, they are generally identified solely to class level. In addition, fossils classified as “Other” include non-fish bone, algae, and trace fossils. This latter group was not listed with the benthic organisms simply because their identity is unknown, and, particularly with the trace fossils, might be evidence of activity of one of the identified benthic animals.
The only representative of the benthic community that requires comment is the shrimp. Shrimp are known to exhibit both benthic and pelagic lifestyles. Based on functional morphological criteria, the dendrobranchiate shrimp family Aegeridae, to which the Luoping specimens are assigned, are considered to inhabit benthic settings. A trace fossil, Ramosichnus nusplingensis Schweigert and Dietl, Reference Schweigert and Dietl2007, preserves scratch marks made on the surface of the Jurassic Nusplinger Plattenkalk sediments by the spinose or setose thoracic appendages of Aeger Münster, Reference Munster and Zu1839. Schweitzer et al. (Reference Schweitzer, Feldmann, Hu, Huang, Zhou, Zhang, Wen and Xie2014) supported the position that members of Aegeridae were benthic on the basis that the thoracic appendages bore setae or spines that served to scour the substrate for food. Schweigert (personal communication) reaffirmed his conclusion that the Aegeridae were benthic creatures.
Fossil distribution
As illustrated in Table 1, the numerical abundance of fossils in general varies greatly and the average density of specimens on the mapped surfaces varies from 3.75 to 17.2 specimens/m2 (Table 1). More striking is the observation that the percentage of pelagic organisms varies from 39.4% to 97.3% (Table 1), and that a clear pattern of species diversity was evident in the distribution (Fig. 10). Layers 1 and 5 had the lowest percentages of pelagic organisms. All mapped layers had large numbers of fish preserved, but the dominant pelagic organisms were mysids on layers 2 and 4. Layer 3 was dominated by thylacocephalans (Fig. 11). The presence of such a high percentage of pelagic organisms on all the surfaces suggests that the animals lived in schools or swarms and died over a brief time, quite possibly as a result of a single event. Close examination of the bedding surfaces on which the specimens are preserved supports a short interval of deposition of the layers. However, the exact distribution of pelagic fossils on the surfaces is an accident of just where they were in the water column and has nothing to do with the distribution of benthic creatures. Within the mapped 0.5 m2 grids, the thylacocephalans and the mysids rarely occurred without other thylacocephalans or mysids within the same or adjacent 0.5 m2 grids, and where they did, they often occurred with other pelagic organisms such as fish (Fig. 11, Layer 3A). This strongly suggests that they were in fact pelagic and that they did live in schools or swarms. The general paucity of benthic organisms in these associations (Fig. 12) supports the conclusion that the substrate was generally inhospitable, probably dysaerobic or anaerobic (Hu et al., Reference Hu, Zhang, Chen, Zhou, Lü, Xie, Wen, Huang and Benton2010). Fish were clearly the dominating pelagic organism in all mapped levels. When shrimp were examined individually, all but one shrimp (98% or 78 of 79 individuals) occurred associated with fish in at least an adjacent quadrant.
Faunal elements of all five layers, both pelagic and benthic arrayed by layer (1) and by faunal element (2). Fish dominate all layers, but each layer has a different array of faunal elements.
Pelagic fauna of all five layers arrayed by layer (1) and by faunal element (2). Fish are present in all layers, but each layer has a different array of faunal elements and fish do not necessarily dominate.
Benthic fauna of all five layers arrayed by layer (1) and by faunal element (2). No one element is present in all five layers, and there is considerable variation in diversity among layers.
Greater significance lies in the observation that two of the surfaces were overwhelmingly dominated by mysids and one surface was dominated by thylacocephalans. The accumulation of such a large number of just one type of organism strongly supports the hypothesis that they were killed by a severe, short-term event. Hu et al. (Reference Hu, Zhang, Chen, Zhou, Lü, Xie, Wen, Huang and Benton2010, p. 2) reported thin ash beds within Member II of the Guanling Formation, the sequence in which the fossiliferous layers were mapped (Fig. 1.2); however, the precise relationship between the mapped surfaces and the ash beds is not known. Examination of the surfaces using SEM imaging and energy dispersive X-ray (EDAX) (Fig. 8) shows no evidence of volcanic material and the silica peak is very low, so that there is no clear evidence that the accumulation of pelagic components on the bedding surfaces resulted from that cause. Alternatively, it is possible that some short-term event in the water column resulted in conditions that killed a large number of pelagic organisms. An algal bloom introducing toxic substances or depleting the water column of oxygen might be one such event that would not leave any evidence in the rock record. The distribution of fish does not follow any clear pattern in that fish remains are distributed widely over all the surfaces mapped. They represent a biotic overprint, probably representing high productivity in a food-rich water column.
The distribution of benthic organisms on all the layers is sparse, suggesting that the seafloor may not have been an hospitable setting (Table 1) (Fig. 12). However, when examining the shrimp individually, 62% of individuals, or 49 of 78, occurred associated with another shrimp in at least an adjacent 0.5 m2 grid. The shrimp occupied an epibenthic niche and may provide some evidence that the dysoxic or anoxic conditions were confined almost solely to the substrate. This suggests that, whereas density of most benthic organisms was extremely low, the shrimp may have clustered by species. Density of benthic animals varied from 0.5/m2 on Layer 2 to 2.1/m2 on Layer 5. The substrate was comprised of carbonate mud, which did not provide a firm surface for attachment, and, indeed, all but two taxa exhibit a vagrant epifaunal lifestyle.
Among echinoderms present, crinoids are relatively common. Crinoids, all but one of which are found on Layer 1, are usually sessile epifaunal creatures, although some are vagrant. Without specific information, we presume the Luoping crinoids are stalked and attached. On that layer, several of the crinoids are preserved in small aggregations of two to four specimens (Fig. 4, Layer 1.1 and Fig. 5, Layer 1.5). This may suggest that the substrate in those areas may have been slightly firmer than the surrounding sediment or they may have attached to bioclasts, so that secure attachment was more likely. The only other echinoderm encountered was documented by presence of echinoid spines on Layer 5 (Fig. 6), possibly a fragment of a cidaroid echinoid (Hu et al., 2011, fig. 5i). Cidaroida is the only order of echinoderms known in the Middle Triassic (Durham, Reference Durham1966, p. U282).
The brachiopod Lingula is sessile and infaunal in habit. Although only one specimen was mapped on Layer 4 (Fig. 6), it does provide some information. Lingulids are capable of occupying a variety of sediment types; however, they are generally excluded from very coarse sediment and fine sediment containing more than 30%–40% material finer than 63 μm (Emig, Reference Emig1983). Even though the sediment in which they burrow may be oxygen deficient, they are capable of maintaining an oxygenated halo around their burrow (Emig Reference Emig1997). Thus, even though linguloids are rare constituents of the benthic fauna on the layers mapped, they help to constrain bottom conditions, at least on Layer 4.
Molluscs in the assemblage include bivalves and a few gastropods. The bivalves in the assemblage are rather arbitrarily assigned to a vagrant epifaunal lifestyle. They have not been identified below class level so that whether they were epifaunal or infaunal remains undocumented. The gastropods observed are high spired forms typical of vagrant epifaunal organisms. As with the other non-arthropod invertebrates, they have not been studied systematically so that their place in the food web cannot be determined at this time. Additional material collected in the field season of 2014 in the newly opened Quarry 3 will propel study of the molluscan fauna.
Isopods, which were identified on four of the five layers, are here interpreted to be members of the marine assemblage. Fu et al. (Reference Fu, Wilson, Jiang, Sun, Hao and Sun2010) noted that the previously described Mesozoic representatives of the Phreatoicidea, to which the sole species from the Luoping Biota was assigned, were freshwater inhabitants. They did note, however, that Schram (Reference Schram1974, Reference Schram1977) named Hesslerella shermani from the Pensylvanian Essex fauna in Illinois, U.S.A. Schram (Reference Schram1974, p. 118) interpreted the species as being marine. As a result, Fu et al. (Reference Fu, Wilson, Jiang, Sun, Hao and Sun2010) were reluctant to categorically consider Protamphisopus baii Fu et al., Reference Fu, Wilson, Jiang, Sun, Hao and Sun2010, to be a freshwater species. Indeed, according to their paleogeographic map modified from Wang and Zhong (Reference Wang and Zhong1994) and Feng et al. (Reference Feng, Bao and Li1997), the Luoping site is situated nearly 50 km from the nearest coastline. The specimens that formed the basis for this species were complete corpses and showed no indication of extensive transport. Thus, the most parsimonious interpretation is that these isopods were marine forms. The presence of some terrestrial plant material in the Luoping Biota suggests an alternative interpretation that the isopods may have been rafted into the depositional site on plants, but this seems far less likely in light of their widespread distribution on four of the mapped surfaces and the absence of their associated with plant material on the mapped surfaces.
The only other arthropod representative discovered on the mapped surfaces was a single cycloid on Layer 3 (Fig. 6). Where their ecology has been considered, cycloids have almost uniformly been considered vagrant benthic organisms. The tiny cap-shaped carapace and short, slender legs bearing ensiform dactyli strongly support this interpretation (Schram et al., Reference Schram, Vonk and Hoe1997). Müller (Reference Müller1955) offered an alternative interpretation, suggesting that they might be parasitic on fish. Gall and Grauvogel (Reference Gall and Grauvogel1967) interpreted them as being predators, whereas Schram et al. (Reference Schram, Vonk and Hoe1997, p. 279) suggested that they might be scavengers or herbivores. Schweigert (Reference Schweigert2007) favored the parasitic lifestyle for a species of cycloid described from the Posidonienshiefer Formation of Early Jurassic age based upon the abundance of pelagic organisms and the general paucity of benthic creatures in that formation. Certainly, the presence of large numbers of fish in the Luoping Biota and the generally sparse benthic fauna affords the possibility that this interpretation might be correct, although there is no direct, independent evidence to support this interpretation. For the present, we consider a vagrant benthic mode of life, probably as an opportunistic feeder, to be most reasonable.
Absent from the layers mapped are plants, large fish, reptiles, millipedes, horseshoe crabs, and starfish. All of these forms have been collected in the Luoping Biota (Hu et al., Reference Hu, Zhang, Chen, Zhou, Lü, Xie, Wen, Huang and Benton2010), presumably on layers that were not mapped. Perhaps most notable among the components absent from the layers mapped are the pelagic vertebrates, representative of the top predators. This poses the interesting question of whether the complex food web described by Hu et al. (Reference Hu, Zhang, Chen, Zhou, Lü, Xie, Wen, Huang and Benton2010) is universally applicable throughout the entire Member II of the Guanling Formation. Detailed mapping of discrete layers within the formation captures snapshots of events, but no one layer can be taken to represent the entire structure of the ecosystem nor does description of a composite trophic scheme represent the array of organisms at all sites within the formation. This means that the description of an assemblage captured on a single layer, recognizing that the actual diversity is muted by taphonomic processes, represents one small patch within a much larger seascape. Recognizing the patchiness of organisms at all scales, it is probably not surprising that the layers mapped in this project cannot capture all elements living in the area.
Synthesis and conclusions
The Luoping Biota is composed of a composite of taxa preserved on multiple layers within the quarry exposures. The surfaces that were selected for mapping in this project were those that were extensively exposed and not previously sampled to any significant degree. Arthropods have previously been recognized as the most abundant group of Luoping organisms with the mysids and thylacocephalans dominating the count. Shrimp were the next most common arthropod, although relatively few of them were mapped on the five surfaces studied. Because the total diversity of organisms in the biota was not represented in this study, the question arises whether all the organisms did, in fact, interact with one another or whether different ecological assemblages might be represented on other bedding surfaces. To test the breadth of the associations, it would be necessary to assay every fossiliferous bedding surface. However, many of the surfaces were extensively collected and delicate fossils were conserved without recording the precise level from which they were taken. Nonetheless, it is probable that the distribution of fossils mapped on the five levels in this study do not fully reflect the full biotic array that would have been present at the time of deposition. Rather, the very high percentage of pelagic organisms, particularly the mysids and thylacocephalans, would seem to document short term, remarkable events that periodically swamped the fossil record. A mass kill would account for this fossil distribution. Although there is little evidence that the benthic communities preserved in the Luoping Biota were ever particularly robust, those organisms that probably did exist at the time of deposition of the mapped surfaces are undoubtedly underrepresented.
The proximal cause of the inferred mass kill remains circumstantial. Examination of the lithology of the bedding surfaces both on the outcrop and by binocular examination does not reveal significant differences between the layers containing an abundance of pelagic arthropods and the suprajacent and subjacent layers. The accumulating sediment and the general paucity of sessile benthic organisms throughout the section surrounding the event beds is a reflection of the dysoxic or anoxic conditions at the sediment-water interface. That conclusion is further reinforced by isotopic (Sun et al., Reference Sun, Liu, Lü, Xu, Zhang, Lou and Jiang2009) and geochemical (Zhou et al., Reference Zhou, Qiyue, Hu, Lü and Bai2010) analyses. It is probable that the conditions responsible for the death of large numbers of small, pelagic arthropods occurred well up in the water column and was not reflected in any obvious way in the sediments burying the fossils. Massive algal blooms or other events that might introduce toxins or starve the water of oxygen are possible causes of the mass deaths (Stachowitsch, Reference Stachowitsch1991, Reference Stachowitsch1992). SEM and EDAX analyses provide no evidence for volcanism as a cause. As pointed out in previous studies, and corroborated in this work, the benthic organisms are largely vagrant forms such as shrimp, lobsters, and isopods. Very few sessile benthic animals were recognized. It is likely that the water column above the sediment-water interface was sufficiently oxygenated to permit vagrant forms to occupy the area. Furthermore, the absence of algal mats on the mapped surfaces supports the contention that living conditions were tolerable, if not ideal.
Thus, it is concluded that the three mapped surfaces dominated by small, pelagic arthropod remains represent unusual conditions within the water column that rapidly killed large numbers of the organisms swarming in the area. An algal bloom, starving the water of oxygen, may have been the cause. Generally sparse benthic assemblages on these and the other mapped surfaces probably is a reflection of the dysoxic conditions that limited colonization by sessile organisms and restricted the number and variety of vagrant forms.
Acknowledgments
Correspondence with G. Schweigert, Staatliches Museum für Naturkunde, Stuttgart, Germany, provided useful insight into the lifestyle of the fossil shrimp. The work was supported by the Chinese Geological Survey (no. 12120114068001 and 1212011140051). Research and travel to China was funded by NSF OISE 1126137 to R.M.F. and C.E.S. and National Geographic Society 9128-12 to R.M.F. Comments by anonymous reviewers substantially improved the manuscript, and our thanks to them and the editors.