The Antarctic Ice Sheet is one of the largest geographic features on Earth. Its origins and history have been intrinsically interesting since those in the Heroic Era of exploration a hundred years ago considered it might have been many millions of years old (e.g. Taylor Reference Taylor1922; Wright & Priestley Reference Wright and Priestley1922). They even speculated that it might have expanded during the warm Pliocene period before the Northern Hemisphere Ice Ages. In recent decades, interest in its history has deepened because of what it might tell us about the ice sheet's response to the warmer climates projected for future centuries.
This review traces efforts in recent decades in geology, geophysics, geomorphology and geochronology that in the 1980s led to two different views on the stability of the ice sheet prior to the Ice Ages. One favoured a persistent Antarctic Ice Sheet for the last 14 million years and the other argued there had been periods as recently as three million years ago, when the East Antarctic interior had inland seas, implying a much reduced ice cover. Resolving the issue was important, because if it could be shown that the East Antarctic Ice Sheet had been substantially reduced in size in the recent geological past, this would have demonstrated its instability even in a 21st-Century climate. As Sugden (Reference Sugden1992) observed “The problem is important because it concerns nothing less than the evolution of polar ice sheets and the global climate system. There are also serious implications for a world experiencing greenhouse warming.”
The treatment here is essentially chronological, tracking the thinking on both sides of the debate as new knowledge appeared. This may help in understanding what sustained this difference in views for three decades. It is worth noting that the debate reached an intensity that took it beyond the realm of science in the novel Antarctica by Kim Stanley Robinson (Reference Robinson1987). I should also record that while in the 1970s I shared the mainstream 1970s view of a stable East Antarctic ice sheet, I was convinced for over a decade (1983 to 1995) of the case for instability. I then became persuaded by the weight of evidence in favour of relative stability.
These two views, of a persistent East Antarctic Ice Sheet on one hand and an ice sheet that largely disappeared just three million years ago on the other, came from quite different lines of evidence; geomorphology and glacial geology in the case of the former and biostratigraphy in the case of the latter. From the International Geophysical Year (1955–57) to the 1980s, comprehensive topographic map coverage and aircraft support allowed science teams to map, observe and describe landscapes and the strata beneath in a way that was impossible in the past. The ‘geomorphologists’ focused more on topography and landforms than deposits, and were more familiar with time-scales of thousands to a few million years. The ‘biostratigraphers’ were more familiar with multi-million-year time scales and evidence based on fossils and superposition of strata, and tended to think from older to younger. They were also used to thinking in terms of mountains rising, basins sinking, and seas advancing and retreating over continents on long time scales.
The challenge in developing a robust history of the Antarctic Ice Sheet from the ice-covered continent itself is formidable because of its antiquity. In the 1960s, before this debate began, the Antarctic Ice Sheet was believed to have formed only a few million years ago, but after offshore drilling in the 1970s and 1980s, the first continental ice sheets were found to have formed around 34 million years ago at the Eocene–Oligocene boundary (Wise et al. Reference Wise, Breza, Harwood, Wei, McKenzie, Muller and Weissert1991). However, establishing the history of the ice sheet was difficult because there was little exposed rock or sediment suitable for dating sediments or landscape. Until the 1970s, the only evidence from continental Antarctica lay in a few recent fossiliferous deposits and volcanic cones, and scattered patches of older glacial sediments that were unfossiliferous.
This account begins with the early view of a persistent Antarctic Ice Sheet through Neogene times, and then covers the early days of the discovery of marine Pliocene diatoms in glacial deposits in the high Transantarctic Mountains. It was argued these could only have come from marine basins in the East Antarctic interior. This required a massive retreat of interior ice and invasion by inland seas to allow the diatoms to be deposited, followed by subsequent expansion of the ice to carry them to their present position. As the differences on this issue arise solely from deposits in the Transantarctic Mountains, this review will focus on that region (Fig. 1). Barrett (Reference Barrett, Florindo and Siegert2009) provides a broader view of the development of Antarctic ice sheet history.
(A) Map of the Ross embayment showing the main Sirius Group locations in the Transantarctic Mountains (filled circles) and other places mentioned in the text. MDV=McMurdo Dry Valleys. Modified from McKay et al. Reference McKay, Barrett, Harper and Hannah2008. (B) Inset map of Antarctica shows the region's setting and the ice-free bedrock topography of Antarctica (blue below sea level and green/brown above – isostatically compensated). Ice drainage basins are outlined in black. From Rignot et al. Reference Rignot, Mouginot and Scheuchl2011 (after Lythe et al. Reference Lythe and Vaughan2001). CCC/RightsLink/AAAS License Number 2794400768375.

1. The view from the 1970s – a persistent Antarctic Ice Sheet since the middle Miocene
Antarctic glacial history prior to the Ice Ages was largely speculative until the late 1960s, when expanding exploration of high latitude oceans by drilling and coring led to the realisation that Quaternary glaciation extended back into the Cenozoic (Turekian Reference Turekian1971). A hint of glaciation in Eocene and Oligocene times had come from quartz grains with glacial textures in cores from the Southern Ocean (Geitzenauer et al. Reference Geitzenauer, Margolis and Edwards1968; Margolis & Kennett Reference Margolis and Kennett1971). On-land evidence of pre-Quaternary glaciation was also scant. One of the two key records was a till-covered glaciated surface in the Jones Mountains of West Antarctica, dated by K/Ar on associated volcanic rocks as more than 7 Ma (Rutford et al. Reference Rutford, Craddock, White, Armstrong and Adie1972); and the other was a collection of Pliocene ages on unaltered volcanic cones and flows of the McMurdo Volcanics in Taylor Dry Valley (Armstrong et al. Reference Armstrong, Hamilton and Denton1968). These indicated that glacial excavation of the McMurdo Dry Valleys had been completed by 2.7 Ma.
By contrast, moraines and other deposits adjacent to modern glaciers in the McMurdo region had been mapped in some detail by glacial geologists. Relationships between moraines from outlet glaciers from the inland ice sheet, those from small cold glaciers within the mountains, and moraines from an expanded Ross Ice Shelf were well established, though ages beyond those of the Last Glacial Maximum were hard to determine (Nichols Reference Nichols and Adie1964). The fundamental difference between the larger East Antarctic Ice Sheet, grounded close to sea level, and the smaller West Antarctic Ice Sheet, grounded well below sea level, had also been recognised (Mercer Reference Mercer1968a). From this it was inferred that the larger land-based ice sheet must have formed prior to the smaller marine-based one. These advances, along with new knowledge of the main features of the ice sheet, were summarised in Denton et al. (Reference Denton, Armstrong, Stuiver and Turekian1971), who concluded “The possibility of large Tertiary ice sheets remains open … However, by 7 m.y. ago … a large ice sheet existed in West Antarctica and by at least 4 m.y … the huge ice sheet of East Antarctica had attained a full bodied condition.”
In the early 1970s, deep-sea drilling began providing stratigraphic records of ocean temperature and ice volume change interpreted in terms of Antarctic ice sheet history (Shackleton & Kennett Reference Shackleton, Kennett, Kennett and Houtz1975; Kennett Reference Kennett1977). The twin influences of temperature and ice volume on the new benthic oxygen isotope stratigraphy were well known, and the large positive shift at the Eocene–Oligocene boundary (then 38 Ma but now 34 Ma) was taken to represent a major cooling with development of sea ice. The subsequent large positive shift in the mid Miocene was interpreted as the development of an Antarctic ice sheet like that of today. At about the same time, seismic surveys and drilling on the Ross continental shelf revealed hundreds of metres of Oligocene and Miocene diamictite, the latter with diatomite interbedded. These indicated cold seas and an Antarctic Ice Sheet margin at times more extensive than today's, even in Oligocene times (Hayes et al. Reference Hayes and Frakes1975). However, Pliocene recovery offshore was so poor that little could be deduced. Drilling in the McMurdo Dry Valleys near the coast (McGinnis Reference McGinnis1981; Webb & Wrenn Reference Webb, Wrenn and Craddock1982) produced cored glacial and glaciomarine sediments that suggested a persistent cold arid coastal climate as far back as the late Miocene (5–10 m.y. ago). However, there was little to indicate the nature of the ice sheet inland of the Transantarctic Mountains.
Mercer (Reference Mercer1968a) was the first to recognise on-land deposits in East Antarctica that represented pre-Quaternary Antarctic glaciation. He discovered these at 86°S, on a ridge now named Tillite Spur, while mapping glacial deposits in the central Transantarctic Mountains (Fig. 1). They comprised 30 m of compact till (diamictite) on a granite platform at 3500 m asl, and Mercer considered they represented a local, warmer, wet-based ice cap some time prior to Quaternary glaciation, perhaps in Pliocene times. The character and setting of the till were plainly different from the loose gravelly moraines alongside the nearby Reedy Glacier ∼2000 m below.
Mercer subsequently mapped glacial deposits in the Beardmore Glacier area and there, as in the Reedy Glacier area, he recognised two groups of “glacial drift” (Mercer Reference Mercer and Adie1972). One comprised thin loose gravelly moraines deposited along the margins of glaciers in the present landscape, termed the Beardmore Drifts. The other comprised scattered compact till deposits up to 200 m thick, and seen as remnants of a more extensive sheet covering a now dissected former landscape. Mercer named the latter the Sirius Formation, from Mt Sirius (2300 m asl, Fig. 2), where the 100m-thick compact till includes boulders of dolerite with fragments of sandstone, shale and coal, resting on a glaciated dolerite surface.
View of Mount Sirius from the south. Light coloured cap is compact Sirius till resting on a dark brown Ferrar dolerite sill. Inset: view northwest from the till-capped summit across the Bowden Névé.
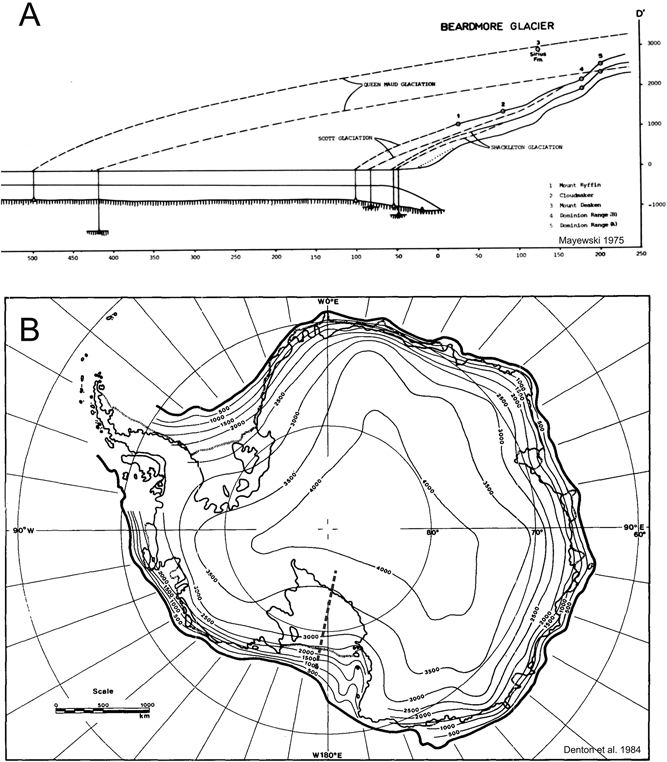
A comprehensive survey of similar deposits by Mayewski (Mayewski Reference Mayewski1972, Reference Mayewski1975; Mayewski & Goldthwait Reference Mayewski, Goldthwait, Turner and Splettstoesser1985), then a graduate student and, like Mercer, also based at Ohio State University, covered a 1300-km length of the Transantarctic Mountains. He recorded over 20 sites along the range, with similar compact till on ridges, benches or in pockets high above the present glaciers, with all but one over 1500 m in elevation. Mayewski agreed with Mercer that these were products of glacial deposition from warm-based ice, noting also in some places there were deposits of stratified conglomerate, sandstone and siltstone inferred to be proglacial in origin. These, like the deposits at Tillite Spur and Mt Sirius, were also set above the present day glacier surface. However, erosional features associated with the deposits indicated ice flow from the interior. He concluded these deposits were from the retreat phase of an early ice sheet, naming the event the Queen Maud Glaciation, which over-rode the Transantarctic Mountains. He argued this event was prior to 4.2 million years ago, the age of a volcanic cone formed after the glacial erosion of Wright Dry Valley (Fleck et al. Reference Fleck, Jones and Behling1972). Mayewski then used a simple model, based on the work of Hollin (Reference Hollin1962), to calculate the ice sheet to be around 850 m thicker than at present near the front of the Transantarctic Mountains, and 325 m thicker at its centre (Fig. 3A). He also thought this event took place after the main uplift of the mountains.
Reconstructions of an expanded East Antarctic Ice sheet overriding the Transantarctic Mountains, explaining the deposition of the Sirius Formation at high elevations: (A) cross-section down the Beardmore Glacier from the Polar Plateau to the Ross Ice Shelf (grey dashed line in B), showing the ice sheet thickening by a similar amount over the Transantarctic Mountains and the Ross Sea (from Mayewski Reference Mayewski1975. Reproduced by permission of P. A. Mayewski); (B) reconstruction for the youngest overriding event from Denton et al. Reference Denton, Prentice, Kellogg and Kellogg1984, showing a thicker central region with thick ice filling the Ross and Weddell embayments.
The view that the Transantarctic Mountains had been over-ridden by the inland ice sheet had also developed in the 1970s from more detailed mapping of landscapes and deposits in the Darwin Mountains and the McMurdo Dry Valleys, by geomorphologists working largely from the University of Maine. In a review of this work, Denton et al. (Reference Denton, Prentice, Kellogg and Kellogg1984) saw a more complex picture, concluding there had indeed been a first glacial phase with a temperate ice cap on the Transantarctic Mountains reshaping river valleys perpendicular to the trend of the range, but this was followed by two phases of over-riding by ice from the East Antarctic interior. These were recorded by geomorphic features and deposits from temperate ice and likely subglacial fluvial activity. The older phase took place before extensive glaciomarine till in the floor of the Wright Dry Valley, palaeontologically dated at between 9 Ma and 15 Ma. The younger over-riding event followed the till. However, the latter must have occurred before 4.2 Ma, prior to the eruption of unmodified basaltic cones on the valley floor (Armstrong Reference Armstrong1978). Denton et al. (Reference Denton, Prentice, Kellogg and Kellogg1984) concluded that the younger over-riding event must have been at least 500 m thicker than the highest deposits to allow for deposition from basal melting. This would have resulted in an ice sheet over 3000 m thick in the region of the McMurdo Dry Valleys and the Ross Ice Shelf, and reaching to the edge of the Antarctic continental shelf (Fig. 3B). Both Mayewski (Reference Mayewski1975) and Denton et al. (Reference Denton, Prentice, Kellogg and Kellogg1984) saw the Sirius Formation as having formed in the retreat phase of the postulated over-riding event(s).
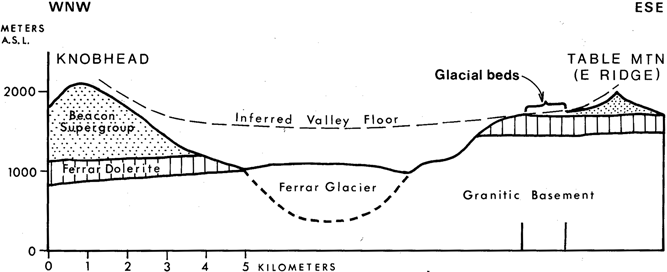
While geomorphologists focused on the landscape and valley floor glacial deposits, biostratigraphers reported on deposits at higher elevations. One was the patch of diamictite on a bench at 2500 m asl near the summit of Mt Feather, which they linked with a striated pavement at 2800 m asl on the summit plateau of Mt Brooke, 60 km to the north (Brady & McKelvey Reference Brady and McKelvey1979). They concluded these features were “..uplifted through ice prior to substantial uplift in southern Victoria Land, prior to the formation of the modern ice dome described by Drewry and prior to the Miocene to present-day ice-drainage pattern.” The other was a more extensive sheet of diamictite with interbedded fluvioglacial sand and gravel at Table Mountain (Barrett & Powell Reference Barrett, Powell and Craddock1982). Here, the geological setting indicated that the glacigenic strata were deposited near the floor of an ancestral Ferrar Valley (Fig. 4), a fragment of a relict landscape judged to be from mid-Cenozoic time.
Cross-section across Ferrar Valley from Table Mountain to Knobhead, showing the position of the Sirius Formation on a relict ancient valley floor. From Barrett & Powell Reference Barrett, Powell and Craddock1982. © 1982 by the Board of Regents of the University of Wisconsin System.
Issues of the day for the East Antarctic Ice Sheet were about its early history and the former periods of expansion, but the West Antarctic Ice Sheet (WAIS) was seen quite differently, best summarised in John Mercer's 1978 paper West Antarctic Ice Sheet and CO2: threat of disaster. Mercer (Reference Mercer1968b) had previously reasoned that the marine-based ice sheet would be inherently unstable. In 1978, he hypothesised that the WAIS was vulnerable to future collapse through polar warming and loss of ice shelves if CO2 emissions were to continue to rise. DSDP Leg 28 cores in the eastern Ross Sea had shown that the WAIS first developed around 25 m.y. ago (Hayeset al. Reference Hayes and Frakes1975), and shallow sea floor cores from the Ross Ice Shelf Project's J9 site 450 km inland from the barrier recovered marine diamict ∼14 m.y. old, based on marine palynomorphs (Brady & Martin Reference Brady and Martin1979; Webb et al. Reference Webb, Ronan, Lipps and DeLaca1979). The cores also contained white diatomite clasts several millimetres across, more fully described by Harwood et al. (Reference Harwood, Scherer and Webb1989), indicating ice-free conditions followed by ice expansion. Denton & Hughes (Reference Denton and Hughes1981), in their review The Last Great Ice Age, concluded that the West Antarctic Ice Sheet also collapsed during the Last Interglacial period. However, no-one queried the stability of the East Antarctic Ice Sheet.
2. A new view from the biostratigraphers – East Antarctic deglaciation in the Pliocene
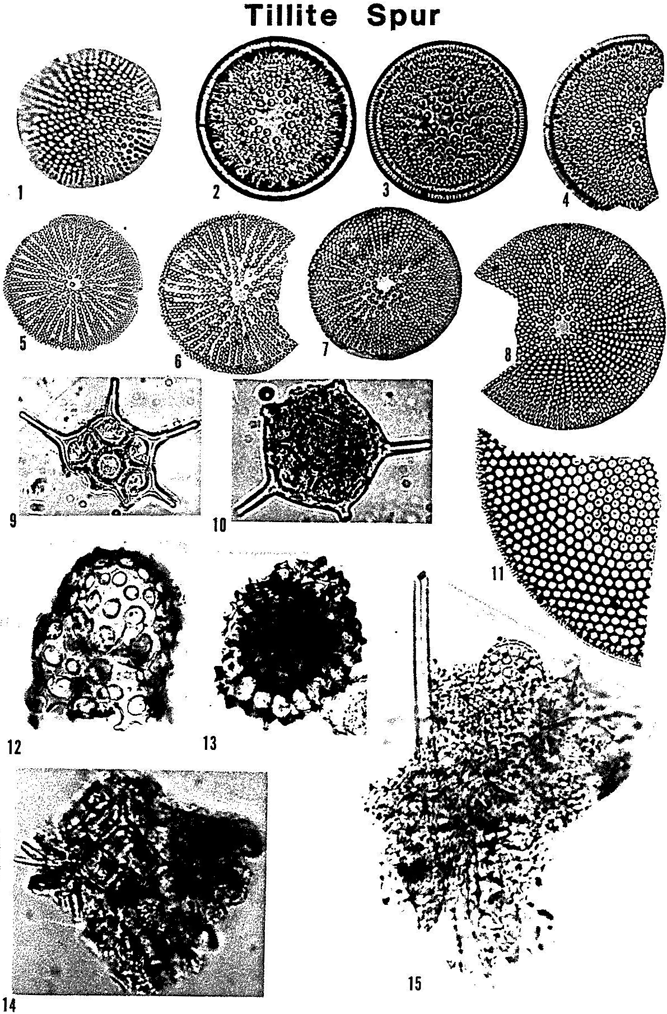
In December 1982, David Harwood, then a graduate student at Ohio State University with an interest in marine Cenozoic diatoms, was given a sample, collected and labelled 64 JHM 70 by John Mercer in 1964 from the Sirius Formation at Tillite Spur, to check for microfossils. He was surprised to find in this sample a diversity of diatoms (Fig. 5), with “assemblages from the lower Oligocene-uppermost Eocene, possible upper Oligocene, middle Miocene, upper Miocene-lower Pliocene and mid-upper Pliocene…” (Harwood Reference Harwood1986, p. 92). He went on to say “The Oligocene and Miocene diatoms commonly occur in clasts of indurated diatom-rich mud. Pliocene diatoms commonly occur in all preparations, whereas Oligocene diatoms were as abundant as the Pliocene component in only one preparation.”
Diatoms and clasts (bottom) from Tillite Spur (from Harwood Reference Harwood1986, plate 3, but reproduced at half size). The caption reads: “Sirius Formation Siliceous Microfossils from Tillite Spur. All specimens are from Sample 64 JHM 70”: (1) Coscinodiscus vulnificus Gombos,×350; (2) Actinocyclus ingens Rattray,×300; (3, 4) Actinocyclus ingens Rattray,×250; (5) Coscinodiscus margaritaceous Castrane,×200; (6–8) Coscinodiscus margaritaceous Castrane,×250; (9) Distephanus speculum (Ehrenburg) Haeckel,×250; (10) Distephanus quinquangellum Bukry and Foster,×250; (11) Coscinodiscus sp.,×250; (12) Radiolarian,×250; (13) Radiolarian,×500; (14) clump of diatomaceous sediment with Dichtyocha fibula Ehrenberg,×250; (15) clump of diatomaceous sediment with Rocella praenitida (Fenner) Fenner and Rhizosolenia sp.,×350.
This discovery prompted Harwood to investigate a further 80 samples from three main locations (Tillite Spur, Mount Sirius and Mount Feather), along with more limited sampling from eight other sites spread over a 1300-km length of the Transantarctic Mountains (Harwood Reference Harwood1983, Reference Harwood1986). Recovering diatoms from the till was a lengthy and complex process involving soaking, sonification, bubbling, heavy liquid separation and sieving through a 30-micron mesh. None of the samples yielded as many diatoms as the 345 specimens from 64 JHM 70, but a total of 34 samples were productive and, in all, 1250 specimens were recovered. Around three quarters of these came from just seven samples yielding 50 or more. Nevertheless, a total of ten samples from six localities were found to have marine Pliocene diatoms. Virtually all of the specimens were marine, but most terrestrial diatoms, being smaller and elongate, would have passed through Harwood's 30-micron sieve. Terrestrial species were also of less interest, being less useful in dating because they typically persist longer in time.
The project was led by Peter Webb, also at Ohio State University, with early results summarised in a paper by Webb, Harwood, McKelvey, Mabin and John Mercer in the May 1984 issue of Geology (Webb et al. Reference Webb, Harwood, McKelvey, Mercer and Stott1984). Harwood (Reference Harwood1986) subsequently provided a more comprehensive and detailed account.
The main points from the Geology paper were:
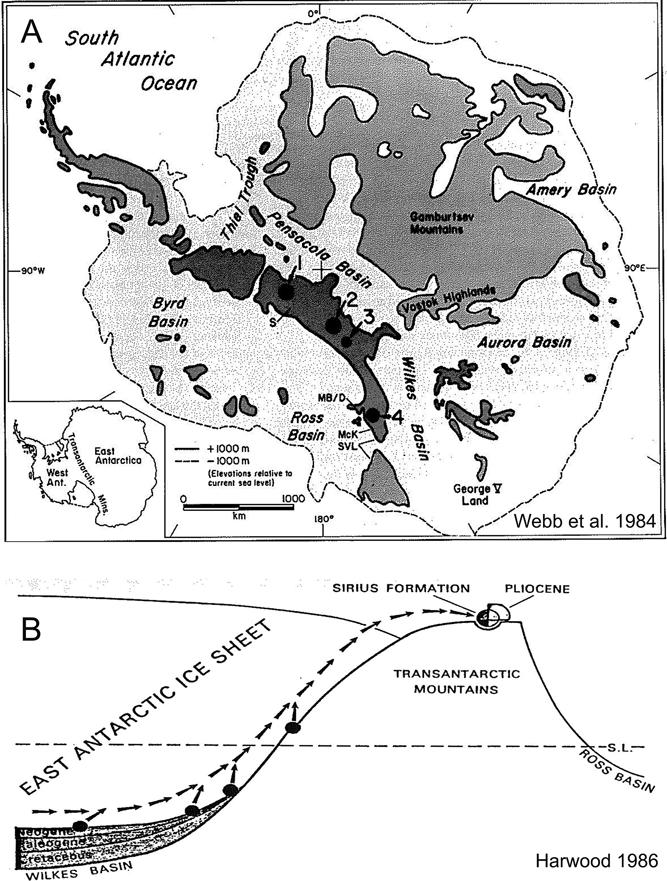
(i) Marine diatoms and other marine microfossils from Sirius deposits were deposited in open marine basins in the Antarctic interior resulting from ice sheet collapse (Fig. 6A);
Figure 6Map of Antarctica to explain the origin and age of Pliocene marine diatoms in the Sirius Formation: (A) map from Webb et al. Reference Webb, Harwood, McKelvey, Mercer and Stott1984, “showing topography after removal of all ice and the subsequent isostatic uplift (after Drewry 1983”. The continental margin is defined by the −1000 m contour and the basins by the +1000 m contour. Key localities are shown by numbers: 1=Wisconsin Range with Tillite Spur and Reedy Glacier; 2=Dominion Range and Beardmore Glacier; 3=Mt Sirius; 4=Mt Feather, Table Mountain and Ferrar Glacier in the McMurdo region. Reproduced by “Fair Use” permission of the Geological Society of America.; (B) cartoon explaining the origin of marine microfossils in the Sirius Formation. From Harwood Reference Harwood1986, fig. 6.
Reproduced by permission of David M. Harwood.
(ii) The most recent such event is dated by species with age ranges restricted to the Pliocene, and implying an age of less than ∼3 Ma for the youngest episode of inland ice over-riding the Transantarctic Mountains;
(iii) Diatoms from earlier time periods indicated previous flooding events by inland seas when the East Antarctic interior was largely free of ice (Fig. 6B).
The authors saw reworked diatoms as a new window into the history of the ice sheet.
They also note the recovery of other microfossils, including foraminifera, calcareous nannoplankton, silicoflagellates, radiolarians, sponge spicules, palynomorphs and ostracods of Late Cretaceous, Paleocene, Eocene, late Oligocene, late Miocene and Pliocene age. But most were long-ranging forms and much less common. More importantly, none had the potential for dating with the resolution offered by the diatoms, which became the single focus for dating the Sirius deposits. Harwood correctly gauged this potential for diatoms and, in the years that followed, led studies that, for example, calibrated 46 datums with a resolution of 0.1 m.y. by magnetostratigraphy and comparison with nannofossil and foraminifer datums in newly drilled cores from DSDP sites in the Southern Ocean (Harwood & Maruyama Reference Harwood and Maruyama1992).
A significant feature for the biostratigraphers in the use of the diatoms for dating was their presence not only as individuals, but also within diatom-bearing clasts or aggregates. Harwood (Reference Harwood1986, p. 128) provided an example from Mt Sirius, saying “… numerous, indurated fine-grained clasts up to 1 cm in diameter … yielded a rich assemblage of upper Oligocene to lower Miocene diatoms, plus silicoflagellates, radiolarians, and sponge spicules (Harwood Reference Harwood1986, plate 10). These sediment clasts apparently represent pieces of upper Oligocene sequences present beneath the East Antarctic Ice Sheet in the Pensacola subglacial basin.” Harwood (Reference Harwood1986) and Webb et al. (Reference Webb, Harwood, McKelvey, Mercer and Stott1984) argued that most diatoms were transported in this way, and were disaggregated during sample processing and concentration of the fossil material. However the only evidence of clasts presented in Harwood (Reference Harwood1986) beyond the description of the late Oligocene–early Miocene clasts from Mt Sirius lay in the images of diatomaceous microclasts measuring up to 100 microns across in his plate 3 (specimens 14 and 15, shown here as Fig. 5) and his plate 6 (specimens 1–8). None of these showed Pliocene diatoms, a critical link in the argument for their subglacial transport.
In the following two years, both biostratigraphers and geomorphologists went on to make new discoveries in Sirius deposits, with the most significant reported in the Antarctic Journal of the United States, a common practice of US researchers at the time, in the May 1986 issue. The previous summer, both groups had found pollen, leaves, stems and roots in glaciolacustrine and glaciofluvial interbeds within Sirius diamictite in the Dominion Range near the head of the Beardmore Glacier (Askin & Markgraf Reference Askin and Markgraf1986; Prentice et al. Reference Prentice, Denton, Lowell, Conway and Heuser1986; Webb et al. Reference Webb, Harwood, McKelvey, Mercer and Stott1986; Webb & Harwood Reference Webb and Harwood1987) (Fig. 7). The biostratigraphers focused on the Oliver Bluffs site, around 1700 m asl, where the diamictites, sand and silt indicated that warm-based East Antarctic ice had flowed over the Dominion Range, its margin retreating from time to time to allow soils to develop and a limited vegetation to grow (Fig. 8). It was clear from the new discoveries that this region of East Antarctica was not only lower when deposition took place, but was also substantially warmer, with a climate comparable with southern Chile today (Mercer Reference Mercer1986). A subsequent palaeobotanical study concluded that the mean annual temperature was close to −12°C, similar to much of the modern Arctic (Francis & Hill Reference Francis and Hill1996).
Oliver Bluffs near the head of the Beardmore Glacier (85°S), showing setting, facies and fossils: (A) view from above the Beardmore Glacier east across Oliver Bluffs to the Mill Glacier and Supporters Range; (B) diamictite at Oliver Bluffs with stratified fossiliferous interbeds of proglacial sand and mud from streams and ponds; (C) leaves ∼2 cm across of Nothofagus beardmorensis preserved in pond mud; (D) small shallow root ∼1 cm across in place and with bark preserved in a primitive soil.
At the same time, the geomorphologists had found scattered patches of diamictite at higher elevations on peaks and plateaus above 3000 m asl between the Dominion Range and Nimrod Glacier, associated with northeast-trending striae and glacial erratics (Fig. 9A) (Prentice et al. Reference Prentice, Denton, Lowell, Conway and Heuser1986). Plainly, the Transantarctic Mountains here had been over-ridden by inland ice, as had been found in the McMurdo Dry Valleys (Denton et al. Reference Denton, Prentice, Kellogg and Kellogg1984). However, these deposits contained no indication of their age relationship with the Sirius Formation of Oliver Bluffs in the middle of the Beardmore “Valley” at 1700 m asl (Figs 7, 9A).
Sirius deposits and other glacial features in relation to the topography of Beardmore Valley: (A) topographic section along the grey line in Figure 7 (viewed from east) (from Prentice et al. Reference Prentice, Denton, Lowell, Conway and Heuser1986), showing the range of glacial deposits and features at various elevations. Sirius features are highlighted (blue=basal till; red=striated bedrock surfaces). Note that apart from The Cloudmaker, all Sirius deposits are above 1500 m asl and glacially striated surfaces are as high as 4200 m asl. Reproduced by permission of Mike Prentice; (B) detailed geological cross-section for the Meyer Desert shown in topographic section A on the left (black box) and the underlying bedrock (from McKelvey et al. Reference McKelvey, Webb, Harwood, Mabin, Thompson, Crame and Thompson1991, fig 1B). Numbers identify stratigraphic sections described in the paper. View is to the southwest and upstream with respect to the present-day Beardmore Glacier (far right of diagram). Here the Sirius Group records at least two successive erosional/depositional events by an ancestral Beardmore Glacier.
The Sirius Formation at Oliver Bluffs was reviewed for the 6th International Symposium on Antarctic Earth Sciences in 1987 by McKelvey et al. (Reference McKelvey, Webb, Harwood, Mabin, Thompson, Crame and Thompson1991). They explicitly recognised the different facies and proposed the Sirius Formation be named a Group, so that different formation names could be applied to deposits in different topographic settings and likely different ages in different areas. While this did not address the concerns of those unable to accept that the Transantarctic Mountains could be over-ridden as recently as the late Pliocene, the authors did make clear the view that the Sirius Group could well comprise a range of ages. They also distinguished between deposits from over-riding ice on high plateaux, as reported by Prentice et al. (Reference Prentice, Denton, Lowell, Conway and Heuser1986), and the interbedded glacial/pro-glacial strata within the Beardmore “Valley”, as in the Dominion Range, where they could be seen as remnants of an older glaciation within the present landscape (Fig. 9B). In addition, the constraint of a late Pliocene age and the climatic implications from the plant-bearing Sirius strata at Oliver Bluffs led them to conclude there must have been c.1300 m of Quaternary uplift (McKelvey et al. Reference McKelvey, Webb, Harwood, Mabin, Thompson, Crame and Thompson1991). At the time this seemed reasonable to some.
In the late 1980s, the idea that the East Antarctic Ice Sheet might have collapsed in the Pliocene seemed unlikely to most earth scientists, but not impossible. The Pliocene was well known as the warm period prior to the Quaternary. Furthermore, in Reference Dowsett and Cronin1990 Dowsett and Cronin reported an estimate of 35±18 m for a mid-Pliocene high sea level, based on dated transgression recorded by the Orangeburg scarp in South Carolina, noting that it was consistent with the Webb et al. (Reference Webb, Harwood, McKelvey, Mercer and Stott1984) hypothesis. Even the idea that a huge ice sheet might then grow to over-ride the mountains was plausible, as Prentice & Matthews (Reference Prentice and Matthews1991) showed with their ‘Snow Gun’ hypothesis. As to the present high elevation of the deposits, and the cold temperatures that required, some argued, as will be seen in the next section, that the Beardmore Glacier sector of the Transantarctic Mountains might have risen rapidly after the ice sheet deposited the Dominion Range Sirius sediments at low coastal elevations.
3. Geomorphologists query age – biostratigraphers reply
The first substantive critical analysis of the biostratigraphers’ hypothesis for the age and origin of the Sirius Formation was presented in review of Late Cenozoic glacial history of Antarctica by Clapperton & Sugden (Reference Clapperton and Sugden1990). They compared the case for Pliocene deglaciation with that for a persistent cold ice sheet, the current paradigm, in the following way:
“There are two leading but contradictory interpretations of the older drift (Sirius Formation). One is based primarily on biological data and favours partial deglaciation of Antarctica in the Pliocene–Early Pleistocene, followed by regrowth of the East Antarctic Ice Sheet to dimensions larger than now, and then substantial uplift of the Transantarctic Mountains. The other is founded on glacial geological observations and implies a larger-than-present ice sheet over Antarctica during the Miocene, and only 200 m of uplift subsequently.”
They identified three major weaknesses with the Pliocene deglaciation hypothesis:
(i) correlation of diatom zones from central Antarctica with zones established in the Southern Ocean thousands of kilometres north;
(ii) the high elevation of the plant-bearing Dominion Range deposits, implying “at least 2000 m of uplift during the last ca. 2-1 Ma.” They go on to note “Such high rates of uplift occur only in areas of plate convergence where active subduction is taking place”; and
(iii) the lack of fossil or sedimentary evidence of ice sheet collapse from cores of Pliocene sediments from the Southern Ocean.
Clapperton and Sugden also noted that the hypothesis would fail “..if the diatoms were emplaced in the drift by some mechanism other than glacial incorporation (e.g. from ocean-derived precipitation).”
In their response, Webb & Harwood (Reference Webb and Harwood1991) framed the debate in terms of the ‘stabilist’ model of ice sheet history of Clapperton & Sugden and their ‘multi-glacial dynamic ice sheet model’. After a preamble outlining their hypothesis, they noted “The reliability of biostratigraphic age determinations lies at the center of criticism of the Webb–Harwood hypothesis”; and they were right, this being the first of the ‘weaknesses’ of Clapperton & Sugden's hypothesis. This challenge to the dating itself concerned biostratigraphers deeply, because it applied not only to the age of the Sirius Formation but also to all biostratigraphical dating in the Antarctic region. Webb & Harwood responded by providing background, detail and references to the basis for the chronology.
They made clear their reasons for believing the diatoms were originally deposited in and then eroded from the East Antarctic interior basins in the following extract.
“Harwood (Reference Harwood1986, fig. 1) showed that diatoms are relatively abundant in some samples, and more importantly, they also occur within microclasts and macroclasts (up to 1 cm in diameter) emplaced along with other clastic material during Sirius Group deposition. This evidence eliminates the hypothesis that diatoms were somehow contained in ocean-derived precipitation and then blown by wind to be deposited within the sediments.” They go on to say “Furthermore, larger and heavier foraminifera and sponge spicules could not be transported by aerial processes.”
This was a key point, but not conclusive, because what was at issue was not the foraminifer and sponge spicules, or the diatoms in the 1 cm clasts from Mt Sirius, a credible consequence of an early or middle Miocene over-riding event. They had yet to show that the marine Pliocene diatoms came from clasts that were too large to be wind-blown.
Whilst diatom biostratigraphy was still in its youth, principles and procedures were long established and it was developing fast through Southern Ocean drilling and coring. Thus, age ranges for the diatoms identified from Sirius deposits and figured by Harwood were well known (eg between 3.1 and 2.5 Ma for Thalassiosira (Coscinodiscus) vulnifica), and verified with many references to recent biostratigraphic literature. Furthermore, the marine Pliocene taxa found in Sirius deposits were also collected from ash-bearing marine glacial sediments deposited seaward of the glacier grounding line in Ferrar Fiord and close to a layer radiometrically dated at 3.0±0.1 Ma (Barrett et al. Reference Barrett, Adams, McIntosh, Swisher and Wilson1992).
In summary, the first ‘weakness’ identified by Clapperton & Sugden (Reference Clapperton and Sugden1990), the uncertainty in correlating Antarctic diatom taxa with those in lower latitudes, had been dispelled. Webb & Harwood (Reference Webb and Harwood1991) went on to challenge the second weakness, the implied rapid Quaternary uplift of the Transantarctic Mountains, by citing recent published papers arguing in support of such a high rate (e.g. Behrendt & Cooper Reference Behrendt, Cooper, Wilch, Denton, McIntosh and Lux1991).
4. Geomorphologists strengthen their case
The reply from Webb & Harwood (Reference Webb and Harwood1991) had validated the age of the diatoms and hence, seemingly, the deposits, a key point reiterated by Wilson (Reference Wilson1995). This left both biostratigraphers and geomorphologists in a quandary. In addition, both Barrett et al. (Reference Barrett, Adams, McIntosh, Swisher and Wilson1992) and Sugden (Reference Sugden1992), in commentaries on that paper, drew attention to the implication of the Pliocene collapse hypothesis for the stability of the whole Antarctic Ice Sheet with projected future warming. By then, the issue was attracting increasing public interest, stimulated by the hot northern summer of 1988 (Hansen Reference Hansen1988; Hansen et al. Reference Hansen, Fung, Lacis, Rind, Lebedeff, Ruedy, Russell and Stone1988; Schneider Reference Schneider1989). This was not an issue to be left unresolved.
The geomorphologists proceeded by strengthening their case from lines of evidence they had most experience in and felt compelling, and assembled this at a Vega Symposium on The Case for a Stable East Antarctic Ice Sheet held in April 1993 in Stockholm. In addition, they included a review of evidence on climate and sea level from beyond the Antarctic and an ice sheet modelling study, and the papers were published later that year in a special issue of Geografiska Annaler (Sugden et al. Reference Sudgen, Marchant and Denton1993). The core of the case was based on extensive mapping of surficial deposits and landscape in the McMurdo Dry Valleys (Denton et al. Reference Denton, Sugden, Marchant, Hall and Wilch1993). This area of 5000 square km included volcanic ashes (Fig. 10) ranging in age from 4 Ma to 13 Ma. Their preservation for such a long period of time provided strong support for a persistent cold-arid climate for the landscape since the middle Miocene. Pliocene ages for subaerial volcanic cones and flows in Taylor Dry Valley, several of which lay less than 400 m asl, and one just 209 m, provided physical evidence of limited glacier extent and minimal uplift since that time (Wilch et al. Reference Wilch, Denton, Lux and McIntosh1993a).
Unweathered volcanic ash in place, indicating a climate like the present day since their deposition for the inland McMurdo Dry Valleys at high elevations: (A) pit in ∼9.95 Ma ash on the east wall of central Beacon Valley ∼1300 m asl. From Marchant et al. Reference Marchant and Denton1996; (B) pit profile through 4.33±0.07Ma Arena Valley ash 1410 m asl covering a pavement of ventifacts. From Marchant et al. Reference Marchant, Denton, Swisher and Potter1996.
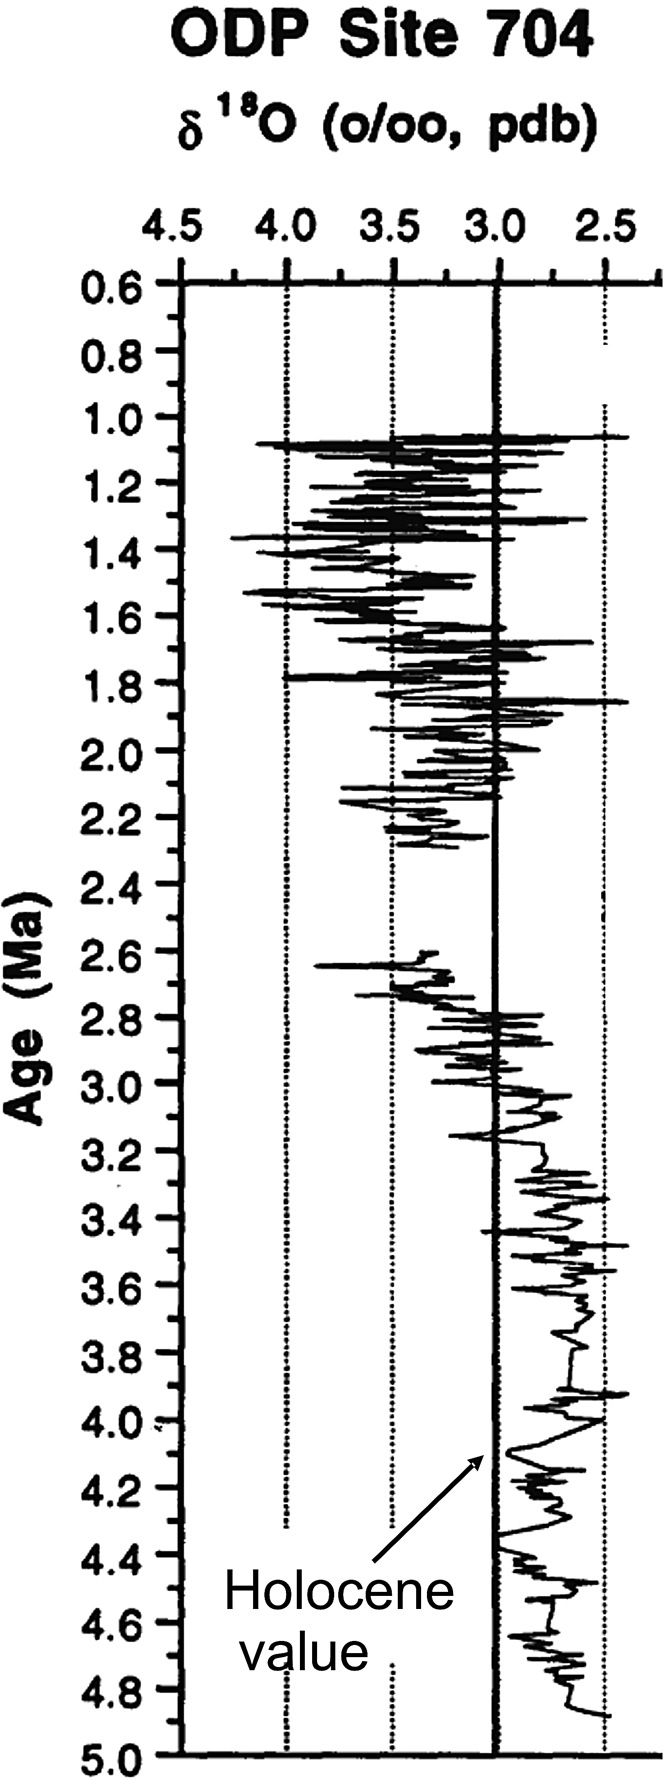
Beyond the continent, Kennett and Hodell (Reference Kennett and Hodell1993) considered evidence of Antarctic Pliocene climate stability by reviewing the palaeocology and oxygen isotope stratigraphy from deep sea cores around the Antarctic. Despite the widely acknowledged warmer Pliocene global temperatures, they concluded that “During the Pliocene, conditions were never sufficiently warm to cause significant displacement of Antarctic by Subantarctic planktonic assemblages”. They also noted that oxygen isotope records allowed no more than a 3°C increase above that of the present in average sea surface temperature during the warmest Pliocene, if the influence of ice loss is also included (Fig. 11). The lack of coccoliths in Southern Ocean sediment also limits the likely rise in temperature for Pliocene surface waters (>5°C). In the same paper, they reviewed Pliocene high sea level estimates and concluded 25 m was a likely upper limit. A review by Miller et al. (Reference Miller, Browning, Kulpecz, Kominz, Naish, Rosenthal, Cramer, Peltier, Sosdian and Wright2012) estimated the value to be 22±10 m, though without taking into account the complexities outlined by Raymo et al. (Reference Raymo, Mitrovica, O'Leary, DeConto and Hearty2011).
Benthic deep-sea foraminiferal oxygen isotope record through Pliocene times, showing lowest (warmest) values only 0.7‰ less than the 3.0‰ of today (modified from Kennett & Hodell Reference Kennett and Hodell1993). They note sea level could have been 20 m higher (∼0.2‰) and bottom water temperatures 2°C warmer (∼0.5‰), but both twice as high and warm as suggested by Webb & Harwood Reference Webb and Harwood1991.
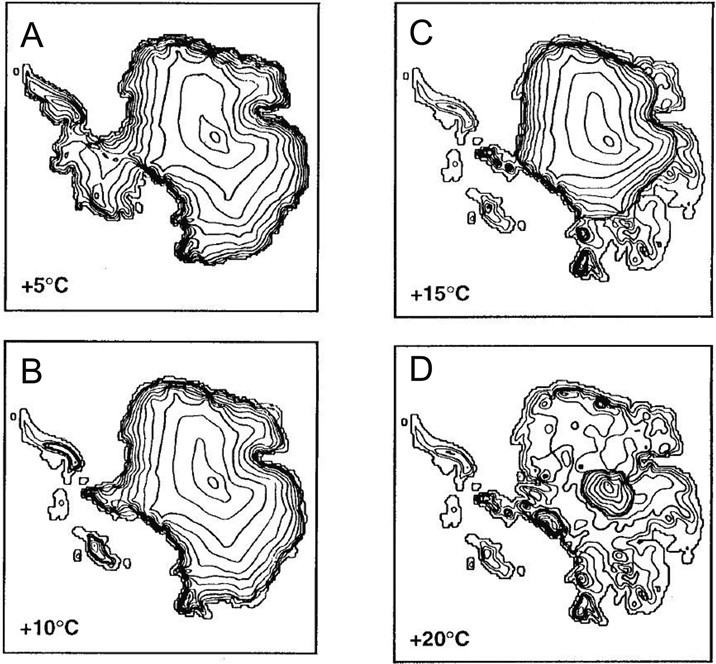
Another independent approach to the issue, a new 3-D ice sheet model by Huybrechts (Reference Huybrechts1993), added support to the view that the East Antarctic Ice Sheet persisted through the Pliocene. It showed the ice sheet responding to initial regional temperature rise of ∼5°C by accumulating mass, with a rise of 8–10°C required to remove the West Antarctic Ice Sheet. A rise of over 15°C was required for a collapse of the East Antarctic Ice Sheet (Fig. 12). In all, the Vega Symposium volume represented a substantial and diverse body of evidence in favour of East Antarctic Ice Sheet stability through Pliocene times.
Ice sheet model by Huybrechts (Reference Huybrechts1993) depicts the extent and volume of ice in response to higher regional temperatures. The model indicates that a regional temperature rise of more than 15°C is necessary to leave the Pensacola Basin behind the central Transantarctic Mountains free of ice.
One further report about this time also seemed to rule out a Pliocene collapse of the East Antarctic Ice Sheet – the discovery of ancient glacier ice in the floor of Beacon Valley (1300 m asl, Fig. 1) beneath a thin cover of glacial debris (Sugden et al. Reference Sugden, Marchant, Potter, Souchez, Denton, Swisher and Tison1995b). The fabric of the ice pointed to ice flowing into the valley from an expanded Taylor Glacier, in the past an outlet glacier that flowed into McMurdo Sound. A minimum age for the ice was obtained from single crystal Ar–Ar ages of two samples of unweathered volcanic ash found in several of the contraction crack polygons in the overlying glacial debris. The age of the (slightly) older sample (8.07±0.06 million years) indicated a cold arid climate for Beacon Valley at least since that time. While the likelihood of ice surviving so long has been questioned (Ng et al. Reference Ng, Hallet, Sletten and Stone2005) a subsequent study on possible sublimation rates indicates it is possible (Schorghofer Reference Schorghofer2005).
5. Glaciological and tectonic advances
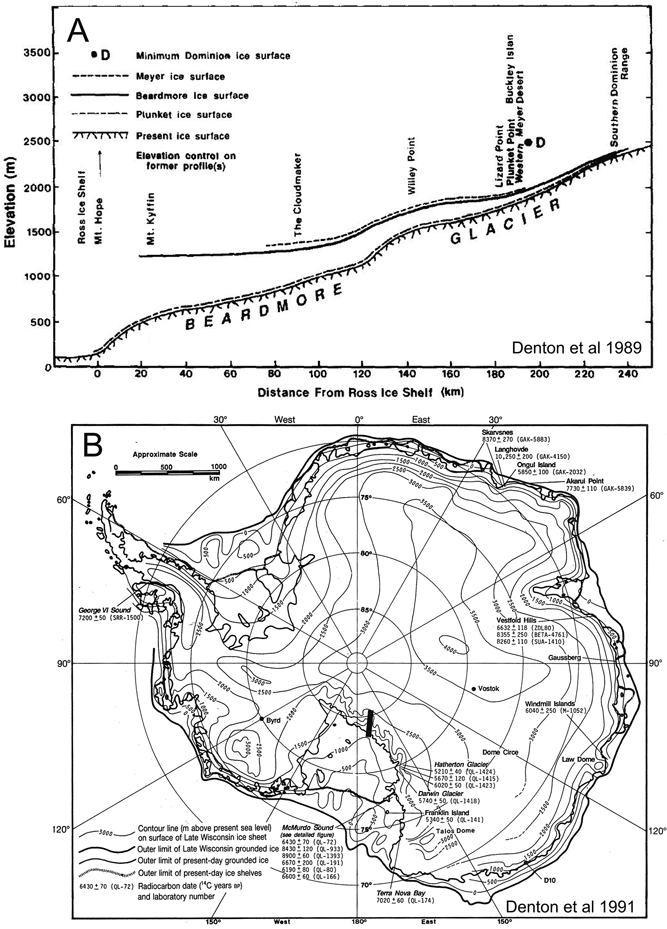
The 1980s had seen an additional constraint on ice sheet behaviour develop from the mapping of the moraines that ran alongside the outlet glaciers of the Transantarctic Mountains. Denton and colleagues found that for both the Hatherton and Beardmore Glaciers, the oldest moraines near the coast were several hundred metres higher, but up-glacier they converged to present ice level at an elevation of around 2000 m (Denton et al. Reference Denton, Bockheim, Wilson, Leide and Andersen1989) (Fig. 13). They took this to be a record of the “damming” of the Polar Plateau ice by outlet glaciers during the last two glacial maxima, but it also implied that the elevation of the ice surface on the Polar Plateau changed little from glacial to interglacial. Independent confirmation of this came from gas measurements in ice cores at Vostok (Lorius et al. Reference Lorius, Raynaud, Petit, Jouzel and Merlivat1984) and Dome C (Jouzel et al. Reference Jouzel, Raisbeck, Benoist, Yiou, Lorius, Raynaud, Petit, Barkov, Korotkevitch and Kotlyakov1989). Denton et al. (Reference Denton, Prentice, Burckle and Tingey1991) further concluded that the Transantarctic Mountains must have been substantially lower to be over-ridden by inland ice, a conclusion reached independently by McKelvey et al. (Reference McKelvey, Webb, Harwood, Mabin, Thompson, Crame and Thompson1991) on the basis of the fossil flora at 1700 m asl from Oliver Bluffs, which they concluded to require 1300 m of uplift, but since the early Pliocene.
Outlet glacier profile and map of Antarctica from the late 1980s, reflecting observed constraints on the height and extent of the east Antarctic Ice Sheet at the Last Glacial Maximum (and likely earlier glacial maxima also). It is unadjusted for the progressive increase in ice load below 2000 m asl.: (A) profile of the Beardmore Glacier from the edge of the East Antarctic Ice Sheet to the Ross Ice Shelf, showing former ice surfaces during recent glacial maxima. Line of profile marked by black bar on map (B). Ice thickness shows no change during glacial maxima above 2000 m elevation, but progressively increases down-glacier, thickening to 700 m at Mt Kyffin near the coast. From Denton et al. Reference Denton, Bockheim, Wilson, Leide and Andersen1989, fig. 17 – CCC/RightsLink/Elsevier License Number 2795481477409; (B) Working sketch from Denton et al. Reference Denton, Prentice, Burckle and Tingey1991, based on previous numerical reconstructions and new glaciological and geological data discussed in their text. Compare with Fig. 3B from the early 1980s.
The possibility of rapid Pliocene uplift of the Transantarctic Mountains, of the order of 1 km/m.y., was given significant credence by Behrendt & Cooper (Reference Behrendt and Cooper1991). Key evidence they cited was the youthful appearance and great relief (5–7 km) of the “rift shoulder” (the well-defined east-facing escarpment of the Transantarctic Mountains), small offshore Holocene fault scarps seen in marine seismic records indicating recent tectonic activity, the presence of vegetation dated as Pliocene and 1.7 km above sea level, and the derivation of Pliocene marine diatoms from the Antarctic interior. They also stated that the rate of neotectonic uplift on other rift margins was similar or higher, citing the tectonically active East African rift (Ebinger Reference Ebinger1989) but overlooking the present tectonic inactivity of the West Antarctic Rift System today as indicated by its low seismicity (Reading Reference Reading, Gamble, Skinner and Henrys2002).
Thermochronology of apatite grains in the late 1980s had yielded uplift histories from elevational transects at different sites along the Transantarctic Mountains, and had established that the Transantarctic Mountains had risen 5–6 km, mostly in the last 55 million years (Gleadow & Fitzgerald Reference Gleadow and Fitzgerald1987; Fitzgerald & Gleadow Reference Fitzgerald and Gleadow1988). However, the uplift history within this period was unknown. Basement-derived clasts found in cores of offshore Oligocene strata (Barrett Reference Barrett1989) implied that the mountains had risen to about half their present height by that time; but when did the rest of the uplift take place?
Behrendt & Cooper argued that an uplift surge since the mid-Pliocene was consistent with the Early Pliocene deglaciation of the East Antarctic interior and subsequent over-riding of the ice sheet to generate the Sirius deposits, changing the thermal regime from temperate to its present cold arid state. They also saw no reason to assume that uplift along the Transantarctic Mountains should take place at the same rate in each sector. In a comment (Behrendt et al. Reference Behrendt, Cooper, Wilch, Denton, McIntosh and Lux1994) on a paper in Science by Wilch et al. (Reference Wilch, Lux, Denton and McIntosh1993b), who argued that the well-dated Pliocene volcanic cones in Taylor Valley precluded rapid regional uplift, they cited authors who had identified blocks along the Transantarctic Mountains that might have moved independently. They also noted surface age data just published by van der Wateren & Verbers (1993), indicating rapid Pliocene uplift in the David Glacier block just north of the McMurdo Dry Valleys. However, this conclusion is inconsistent with the simple observation that the David Glacier block is topographically lower than the McMurdo Dry Valleys block, whose low uplift rate since the Miocene has long been widely accepted (Fig. 14).
In the decade that followed, the low uplift rates for the McMurdo Dry Valleys region were confirmed from exposure ages for rock surfaces using cosmogenic isotopes. Work on high elevation surfaces, summarised by Summerfield et al. (Reference Summerfield, Sugden, Denton, Marchant, Cockburn, Stuart, Smith, Whalley and Warke1999), showed ages from cosmogenic isotopes dating back to 10 Ma, and rates of denudation of the order of 0.2 m/m.y., implying very little uplift since late Miocene times.
Topography of the Transantarctic Mountains bordering the Ross Embayment after isostatic compensation for the removal of ice (from Drewry Reference Drewry1983). The boxes show similar peak elevations for the McMurdo Dry Valleys block (MDVb) and the two blocks on either side of the Beardmore Glacier (Queen Maud and Beardmore blocks – QMb and BGb), suggesting similar uplift histories (dashed lines show location of cross-sections shown in Fig. 18). Van der Wateren et al. (Reference Van der Wateren, Dunai, Van Balen, Klas, Verbers, Passchier and Herpers1999) argued that young surface age dates from the Prince Albert block (PAb) indicate a higher uplift rate, but this is at odds with its present lower elevation and the old dates from the high-standing USARP Mountains (UM) in the north.
Fitzgerald (Reference Fitzgerald2002), in reviewing the history of the Transantarctic Mountains for ISAES 9, drew on plate tectonic history and apatite fission track thermochronology over a 2000-km length of the mountains. He noted that the timing of uplift became slightly younger to the south (from 55 Ma to 45 Ma), but concluded “Following the onset of uplift of the Transantarctic Mountains … in the early Cenozoic, escarpment retreat, formation of planation surfaces and downcutting by fluvial systems with relatively little glacial modification produced a landscape that has changed very little in the last c.15 m.y.”. Stern et al. (Reference Stern, Baxter and Barrett2005) drew on this history to explain the extraordinary relief of the Transantarctic Mountains noted by Behrendt & Cooper (Reference Behrendt and Cooper1991). Modelling of the central Transantarctic Mountains showed that as much as 2000 m of peak elevation can be a response to isostatic rebound from glacial incision. They concluded “Such strong relief is possible because a polar climate since the middle Miocene has resulted in freezing conditions at high elevations, which acted to preserve the peaks, whereas wet-based glaciers at low elevations have produced optimal conditions for enhanced glacial incision.” These studies provided a wider context independent of the age of the Sirius deposits, and pointed to a very low rate of uplift along the whole length of the Transantarctic Mountains since the middle Miocene.
6. But the diatoms might be wind-blown
An early and zealous advocate for an alternative to inland seas for the source of the Sirius Pliocene marine diatoms was Lloyd Burckle, a diatom specialist who had also checked and verified the diatom identifications in David Harwood's PhD thesis (Harwood Reference Harwood1986). Initially, Burckle extracted a diatom flora in ice cores from Dome C, one of six domes of the Antarctic ice sheet and remote from the coast, finding that while there was indeed a flora it was largely of terrestrial forms. This contrasted with the dominantly marine forms reported by Harwood from Sirius deposits. Burckle et al. (Reference Burckle, Gayley, Ram and Petit1988) concluded that this indicated different modes of emplacement for each, requiring a mechanism other than wind transport for introducing marine diatoms into the Sirius Group.
However, new glaciological limitations on a late Pliocene ice sheet over-riding the Transantarctic Mountains, summarised in Denton et al. (Reference Denton, Prentice, Burckle and Tingey1991) and in the wider arguments in Sugden et al. (Reference Sudgen, Marchant and Denton1993), led to a widespread search for diatoms in snow, moraine and rock elsewhere than in the Sirius Group in the Transantarctic Mountains, to check on the possibility that Sirius diatoms might be wind-blown contaminants. The first results of this search were reported at a meeting at Woods Hole Oceanographic Institution in April 1995, attended by both geomorphologists and biostratigraphers. The reports indicated that individual diatoms, both marine and terrestrial, were quite widespread in the Antarctic. This became a focus of the debate through to the International Symposium on Antarctic Earth Sciences in Siena in August 1995.
Burckle's new study (Burckle & Potter Reference Burckle and Potter1996) was of samples of Devonian Beacon Heights Orthoquartzite in Beacon Valley around 80 km from the coast and a few km from the Sirius section on Mt Feather with its Pliocene diatom flora (Webb et al. Reference Webb, Harwood, McKelvey, Mercer and Stott1984). They found a total of around 200 diatoms from 15 different taxa, and all of them marine, with most found in the Southern Ocean today. They also extracted diatoms from cracks in igneous rocks from Marie Byrd Land ranging in age from Devonian to Cretaceous, and collected within 100 km of the coast. These too were largely Southern Ocean forms, and included “diatom aggregates (on the order of 50–100 μm across) consisting of both whole diatom valves and diatom fragments”. They concluded that “any study using diatoms in sedimentary rocks to record Neogene cryospheric history…. should be considered highly suspect.” However, documentation (floral lists from each sample and photographs of key aspects, e.g. aggregates) was lacking, and for the biostratigraphers this reduced the weight of the argument. It's worth recalling that a similar lack of documentation of diatom evidence in papers advocating the Pliocene ice sheet collapse hypothesis was seen as a weakness by the geomorphologists.
However, at about the same time, Kellogg & Kellogg (Reference Kellogg and Kellogg1996) published results of their study of diatoms filtered from melting lengths of South Pole ice cores. They found more than 40 taxa of marine and nonmarine diatoms, with abundances ranging from 0 to 450 specimens/litre. Most species were known from the Antarctic region, with a few possibly representing transport from further afield. They did not report on size, but implied few were more than 100 μm. They concluded that diatoms are a small but pervasive constituent of snow falling on the Antarctic ice sheet, although patchy in distribution through both space and time.
Two other groups were also working to understand the origin of Sirius diatoms by returning to the deposits themselves on the inland peaks of the McMurdo Dry Valleys (Fig. 15). The study by Bleakley (Reference Bleakley1996) (summarised in Barrett et al. Reference Barrett, Adams, McIntosh, Swisher and Wilson1997) focused on Mt Feather, one of the three main Sirius sites reported in Webb et al. (Reference Webb, Harwood, McKelvey, Mercer and Stott1984), to improve documentation on the occurrence of diatoms in the Sirius Group, and also to check on their possible presence in adjacent Beacon Sandstone (Permian), local surficial moraine and last winter's snow. From the 14 samples processed, just over 400 identifiable diatoms and fragments were recovered, about a quarter of them being marine. Key points were:
(i) diatoms in the Sirius were exceedingly rare, mostly between zero and two specimens per gram of sediment at depth, though more abundant (around six per gram) in the top 2 cm;
(ii) diatoms were present in similar low densities in the Permian sandstone and moraine – and around ten per litre of melted snow;
(iii) the Sirius diamictite had pore spaces ranging from 30 μm to 300 μm, large compared with an average diatom diameter of 15 μm. With an active permafrost layer today 50 cm deep and likely deeper in the warmer past, there seemed ample opportunity for the downward migration of diatoms from the surface into the deposit.
Map of the McMurdo Dry Valleys landscape and a cross-section through Mt Feather and Mt Fleming, two Sirius Group sites studied in detail (see text): (A) map of the McMurdo Dry Valleys (from Sugden et al. Reference Sugden, Denton and Marchant1995a), showing the several landscape types in relation to the integrated ancestral fluvial drainage pattern from polar plateau to coast. © 1995 American Geophysical Union. Reproduced from Sugden, D. E., Denton, G. H. & Marchant, D. R., Landscape evolution of the Dry Valleys, Transantarctic Mountains: Tectonic implications, Journal of Geophysical Research 100(B7), 9949–67, by permission of the American Geophysical Union; (B) south to north section through Mt Feather and Mt Fleming (modified from Hicock et al. Reference Hicock, Barrett and Holme2003), showing the elevation of Sirius deposits in relation to the rest of the landscape.
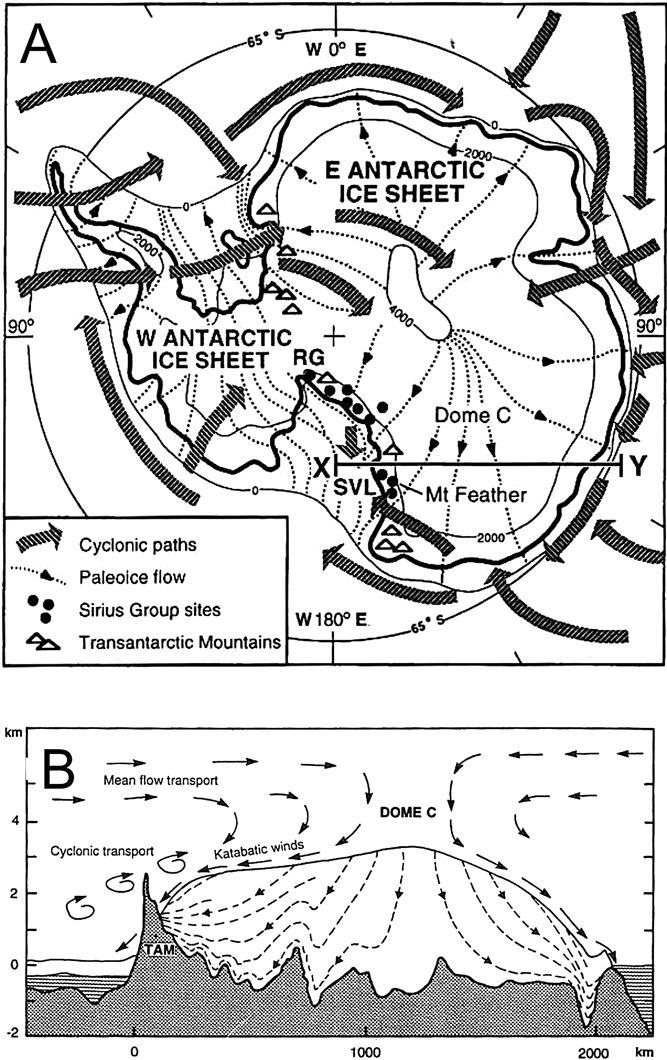
They concluded that these observations were best explained by an atmospheric source for the diatoms and their subsequent incorporation into local deposits (Fig. 16).
Map and cross-section of Antarctica showing potential transport paths for Sirius Group diatoms (from Barrett et al. Reference Barrett, Adams, McIntosh, Swisher and Wilson1997 – by permission of Terra Antarctica Publications): (A) map showing flow lines for the larger ice sheet required to deposit Sirius Group tills (Denton et al. Reference Denton, Prentice, Burckle and Tingey1991). Ice sheet flow lines correspond closely to surface wind directions (Parish & Bromwich Reference Parish and Bromwich1987). The broad arrows are cyclone paths for 1958 (Alt et al. Reference Alt, Astapenki and Ropar1959). Line x–y marks the section line for (B); (B) cross-section of the East Antarctic ice sheet (x–y line in (A)) close to the plane of present day flow lines (calculated by R. Hindmarsh). The sketch shows how it is possible that diatoms found in diamictite high in the TAM may have originated from either glacial erosion of diatomaceous sediment below sea level in the interior, or by poleward transport in the atmosphere and incorporation into the sediment by periglacial processes. Atmospheric circulation simplified from Alt et al. Reference Alt, Astapenki and Ropar1959 and Shaw Reference Shaw1988, with vertical wind profiles from Connelley & King Reference Connelley and King1993.
The other study (Stroeven Reference Stroeven1994, 1996; Stroeven et al. Reference Stroeven1996; Stroeven & Prentice Reference Stroeven and Prentice1997), focused on two Sirius deposits on Mt Fleming, a lower peak around 50 km north of Mt Feather. This included a detailed sedimentological examination of two patches of Sirius diamictite, an upper patch ∼0.5 km across on a glacially moulded surface at 2000 m asl southeast of the summit of Mt Fleming, and a lower smaller patch around 5 km to the NE at around 1800 m asl and on a NE-trending cirque cut into the same surface. The textures, pebble shape and fabrics all indicated that these were deposited by warm-based glaciers, but with ice flow in opposite directions (SSW and NE respectively). With the debris all locally derived, the deposits were interpreted as the products of local alpine glaciers, not over-riding East Antarctic ice.
The study also involved sampling eight pits close to a metre deep in the diamictite and extracting microfossils from 23 samples taken at several levels in the pits. They found a mix of marine and non-marine diatoms, diatomaceous sediment clumps and radiolarian fragments, but instead of the expected random occurrence of diatoms through the deposits, they found a trend in declining abundance from the surface downward. Also, marine diatoms could be identified only in the surface unit, and these included four species whose known ages were restricted to the interval between the latest Miocene and earliest Pleistocene. They concluded from these observations that the diatoms could not have been transported from central inland basins by ice, but might have been blown by wind from diatomaceous sediments in a coastal Wilkes Basin, following partial East Antarctic Ice Sheet deglaciation in a warmer Pliocene. These conclusions were strengthened in a comprehensive review and analysis of Sirius Group deposits along the length of the Transantarctic Mountains (Stroevan Reference Stroeven and Ricci1997).
Stroeven & Kleman (Reference Stroeven and Kleman1999) subsequently compared the recently deglacierised mountains of Scandinavia, where pre-glacial surfaces have been preserved beneath cold-based ice and tills developed from warm-based ice on valley floors, and the Mt Feather block in the McMurdo region, with its warm-based till near the summit. They concluded from a glaciological perspective that warm-based deposition of the latter implied it was a remnant of an ancient landscape, adding substance to a similar conclusion for Sirius deposits on a bench at Table Mountain by Barrett & Powell (Reference Barrett, Powell and Craddock1982).
Though Pliocene sediments on the Antarctic coast were presumed to be the most likely source for windblown diatoms, a report by Gersonde et al. (Reference Gersonde, Kyte, Bleil, Diekmann, Flores, Gohl, Grahl, Hagen, Kuhn, Sierro, Volker, Abelmann and Bostwick1997) suggested another possibility, a 1–4 km-wide meteor falling into 5000 m of water off the coast of Chile. The age of the impact was found to be around 2.2 m.y. ago (revised to 2.5 Ma by Gersonde et al. Reference Gersonde, Kyte, Frederichs, Bleil, Schenke and Kuhn2005), based on the biomagnetostratigraphic age of the oldest post-impact diatom ooze. Gersonde et al. noted that even if only a small fraction of the ejecta reaching the stratosphere were the sea floor sediment of the time, say 0.05 km3, this would be enough “to coat the surface of the Earth with traces of microfossils equivalent to a few diatoms per cm2”.
7. Checking old sites and revisiting the debate
Two further studies about this time revisited key sites to gather further data on the age of the Sirius Group. Wilson et al. (Reference Wilson, Barron, Ashworth, Askin, Carter, Curren, Dalhuisen, Friedmann, Fyodorov-Davidov, Gilichinsky and Harper2002) took several cores of the Mt Feather Sirius deposit, one to a depth of 3.2 m to avoid surface contamination. The analyses included processing the core for diatoms, which they too found to be extremely rare. However, they did not find the marine Pliocene diatoms reported by Harwood (Reference Harwood1986). They assigned a maximum age of Late Miocene on the basis of Stephanodiscus, a small (4 μm) freshwater diatom found at a depth of 90 cm, but agreed with the view that near-surface diatoms were likely wind-blown, and noted the possibility that these could include the meteorite impact ejecta of Gersonde et al. (Reference Gersonde, Kyte, Bleil, Diekmann, Flores, Gohl, Grahl, Hagen, Kuhn, Sierro, Volker, Abelmann and Bostwick1997).
Wilson et al. (Reference Wilson, Harwood, Askin and Levy1998) revisited Reedy Glacier, describing in detail Mercer's (Reference Mercer1968b) original 30 m-thick section 2500 m asl at Tillite Spur. They reported a range of reworked Permian and Paleogene palynomorphs and possible Neogene palynmorphs from the upper section (named Tillite Spur Formation), but provided no new diatom data, relying on the data from Harwood's (Reference Harwood1986) report. They also revisited a 100 m-thick section of stratified Sirius deposits at Quartz Hill, about 40 km west and 1000 m lower in elevation. The diamictites were similar to Tillite Spur, but the non-diamict lithologies between were a mix of conglomerate, bioturbated sandstone and laminated shale. The few diatoms extracted were largely fresh water, but no new age-diagnostic taxa were found.
In 1998, Molly Miller, Editor for GSA Today, attempted to bridge the divide between biostratigraphers and geomorphologists as I have described them, or ‘dynamicists’ and ‘stabilists’ as the two groups had become known. She sought two articles, “one from Stroeven and co-workers (stabilists) summarizing work in support of atmospheric transport of diatoms (rendering them useless as age indicators), and the other from Harwood & Webb on their evidence for glacial transport of the diatoms and a Pliocene age.” Stroeven et al. (Reference Stroeven, Burckle, Prentice and Kleman1998) reviewed the several reports of diatoms found in snow, moraine and other rocks in the Antarctic and also compared the relative abundance of diatoms on surfaces in contrast to their scarcity within Sirius diamictite.
Harwood & Webb (Reference Harwood and Webb1998) acknowledged the evidence of diatoms found in snow and surface deposits in Antarctica as wind-blown, and also noted that the Antarctic Pliocene warming they advocated was consistent with warming world-wide at this time (though this was not in dispute). But they did not provide evidence for glacial transport for Pliocene Sirius Group diatoms. Instead, they confined their case to diatoms extracted from the plant-bearing Sirius Group in the Dominion Range and referenced studies that indicated individuals and microclasts larger than 100 μm (their largest was 240 μm) were too large to be picked up by the wind. They agreed that at least some diatoms elsewhere were aeolian, but not the large individuals and microclasts, which they reasoned could only be of East Antarctic subglacial origin. However, Offer et al. (Reference Offer, Zaady and Shachak1998) reported wind-blown diatomaceous microclasts as large as 150 μm from the Negev Desert, where temperatures ∼70°C warmer would necessarily result in air viscosity and density much lower than polar air. This implies a much lower microclast entrainment threshold there, and a correspondingly higher entrainment threshold for polar diatomaceous microclasts. In addition, Harwood & Webb provided no new evidence to support the original claim that the diatomaceous clasts from the Sirius Group contained Pliocene-specific diatoms.
More recent observations confirm that at least some diatoms are being blown today by the wind into the Transantarctic Mountains from the South Polar Plateau. Over 100 diatoms ranging up to 50 microns across were collected in a 20 cm-wide trap on the edge of the South Polar Plateau at Allan Hills over a period of five weeks (McKay et al. Reference McKay, Barrett, Harper and Hannah2008). The study also reported diatoms caught in moraine and trapped by clay films on rock surfaces.
8. The story from Prydz Bay – an aside
While the origin of the Sirius diatoms in the Transantarctic Mountains was being debated, comparisons were being made with Neogene glacial sediments from the Prydz Bay area, across the continent. Along the western margin of the Lambert graben, extensive remnants of Cenozoic glaciomarine fjordal sediment, known as the Pagodroma Group, had been reported preserved as far as several hundred kilometers inland from the open coast (Hambrey & McKelvey Reference Hambrey and McKelvey2000; McKelvey et al. Reference McKelvey, Hambrey, Harwood, Mabin, Webb and Whitehead2001). The four formations span the interval from early Miocene (or older) to Pliocene or early Pleistocene, with the oldest (20+ Ma) being highest, and cropping out at nearly 1500 m above sea level. The three younger formations are well-dated, with abundant marine microfossils from marine interbeds (ranging in age from early Pleistocene to late Miocene). These crop out with increasing age at progressively higher levels (from less than 50 to 400 m asl), reflecting the rising wall of the fiord as the Lambert Glacier progressively scoured its bed. In addition, Pickard et al. (Reference Pickard, Adamson, Harwood, Miller, Quilty and Dell1988) and Whitehead et al. (Reference Whitehead, Quilty, Harwood and McMinn2001) describe another significant Pliocene marine deposit near sea level, the Sǿrsdal Formation, in the nearby Vestfold Hills, recording warmer early Pliocene seas on the Antarctic margin. These deposits offer little guidance as to the age of the diatoms in the Sirius Group in the Transantarctic Mountains, other than a suggestion that the increase in age with elevation might apply there also. However, they do confirm the value of diatoms as dating tools when they occur in abundance and their origin is beyond dispute.
9. Modelling advances
Huybrechts (Reference Huybrechts1993) had used a simple ice sheet model that indicated that the East Antarctic Ice Sheet was unlikely to lose most of its ice unless there was far greater warmth than projected for the Pliocene. Subsequent modelling by Haywood et al. (Reference Haywood, Valdes, Sellwood and Kaplan2002a) resulted in a different conclusion. They tested the sensitivity of a Pliocene ocean-atmosphere model, with input into a biome model for projecting vegetation distribution, prescribing three sea level scenarios – dynamic (35 m higher), intermediate (25 m higher) and stable (15 m higher). They reported that “Results from the ‘dynamic’ experiment are consistent with reported Pliocene Nothofagus occurrences on Antarctica”, and elsewhere (Haywood et al. Reference Haywood, Valdes, Francis and Sellwood2002b) they cited the modelling results as support for the dynamic hypothesis. Haywood & Valdes (Reference Haywood and Valdes2004) went as far as using palaeoclimate data from the Beardmore Sirius plant beds as a Pliocene data point for global climate reconstructions. However, Haywood's group went on to develop a coupled atmosphere–ocean–ice sheet model (Hill et al. Reference Hill, Haywood, Hindmarsh, Valdes, Williams, Haywood, Gregory and Schmidt2007) that showed the East Antarctic Ice Sheet persisting through the warm Pliocene, albeit with the margin retreating onto land in the Wilkes sector (Fig. 17).
Models of the Antarctic Ice Sheet in Pliocene times: (A) largest (1) and smallest (2) BAS Ice Sheet Model reconstructions of the EAIS under the modelled Hadley Centre GCM climate. From Hill et al. Reference Hill, Haywood, Hindmarsh, Valdes, Williams, Haywood, Gregory and Schmidt2007 – reproduced from Williams, M., Haywood, A. M., Gregory, J. & Schmidt, D. (eds) Deep-time perspectives on climate change: marrying the signal from computer models and biological proxies. The Micropalaeontological Society Special Publications TMS002, 517–538, by permission of the Geological Society, London; (B) Range of configurations over the last five million years using the Genesis 2.1 coupled atmosphere-ice sheet model with 50 m slab ocean and a routine for the transition from ice sheet to shelf by Schoof (Reference Schoof2007).
The modelling by Hill et al. was consistent with results from a 2003 study by DeConto and Pollard using a coupled ice sheet–atmosphere–ocean model. While their main goal was to show how a decline in atmospheric CO2 could force the early Oligocene initiation of the Antarctic Ice Sheet, it was also instructive in showing that East Antarctica remained fully ice-covered for the relatively low CO2 levels and temperatures in the Pliocene. Further work by Haywood's group (e.g. Dolan et al. Reference Dolan, Haywood, Hill, Dowsett, Hunter, Lunt and Pickering2011), and a more sophisticated model that incorporates the ice sheet-ice shelf transition by Pollard & DeConto (Reference Pollard and DeConto2009), continue to show an ice sheet persisting in the interior basins of East Antarctica through the Pliocene, excluding the possibility of sourcing Pliocene marine diatoms from these basins (Fig. 17).
10. The case for a dynamic East Antarctic ice sheet, but pre–mid Miocene
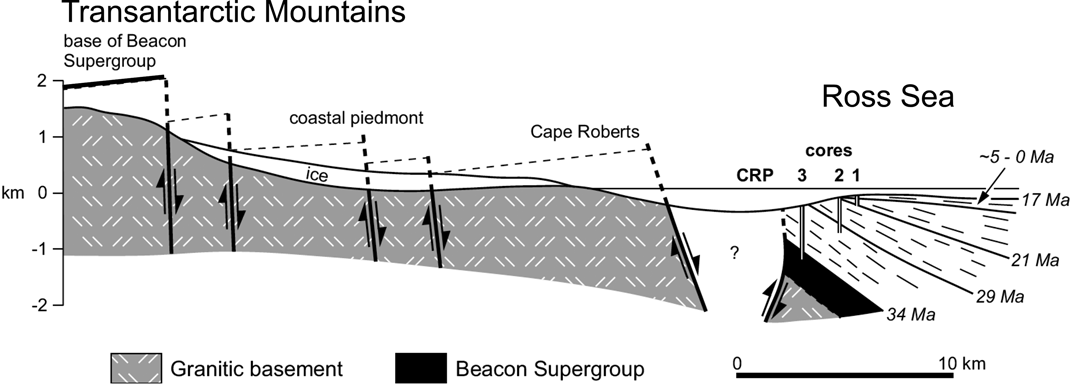
In the McMurdo Sound region, drill cores of Oligocene and Early Miocene strata off Cape Roberts in the late 1990s recorded a fluctuating temperate ice sheet margin from 34 Ma to 17 Ma (Cape Roberts Science Team 2000; Barrett Reference Barrett, Hambrey, Christoffersen, Glasser and Hubbart2007). The project also cored Devonian Beacon Supergroup sandstone beneath the Cenozoic section, allowing completion of basic Transantarctic Mountain Front geometry in this sector of the range (Fig. 18).
Cross-section from the Transantarctic Mountains to the Victoria Land Basin through Cape Roberts, showing the inferred 3 km vertical displacement across the Transantarctic Mountain Front and the dated sedimentary strata offshore. Section line shown in Figure 15. From Sugden & Denton Reference Sugden and Denton2004, after Cape Roberts Science Team 2000 – reproduced by “Fair Use” permission of the Geological Society of America. Faulting from Fitzgerald Reference Fitzgerald1992.
Sugden & Denton (Reference Sugden and Denton2004) incorporated these results into a synthesis of two decades' work on landscape evolution for the 260 km-long sector of the McMurdo Sector of the Transantarctic Mountains, building on an earlier review that showed similar histories of landscape evolution and uplift for the Royal Society Range and the adjacent McMurdo Dry Valleys block (Sugden et al. Reference Sugden, Summerfield, Denton, Wilch, McIntosh, Marchant and Rutford1999). They noted the initial uplift from 55 Ma (Fitzgerald Reference Fitzgerald2002), and the rapid pulse of denudation from 34 Ma to 31 Ma seen in the older Cape Roberts cores, with erosion and subsidence declining until ∼17 Ma, linking this with geomorphic evidence of rivers on land and tills from warm-based glaciers. The case they made from detailed geomorphic mapping and erosional features can be supplemented with reports of Sirius deposits at Table Mountain (Barrett & Powell Reference Barrett, Powell and Craddock1982) and Mt Feather (Brady & McKelvey Reference Brady and McKelvey1979; Hicock et al. Reference Hicock, Barrett and Holme2003) as remnants of an ancient landscape. It is also consistent with the observations and conclusions noted earlier from Stroeven (Reference Stroeven and Ricci1997) and Stroeven & Kleman Reference Stroeven and Kleman1999).
For the period from ∼14 Ma to the present, Sugden & Denton drew on the many reports of volcanic ash deposits dated at between 4 Ma and 15 Ma in the McMurdo Dry Valleys, as well as surface age dates implying the extremely slow erosion rates mentioned earlier (Summerfield et al. Reference Summerfield, Sugden, Denton, Marchant, Cockburn, Stuart, Smith, Whalley and Warke1999). They concluded that the region had seen little change in its hyperarid polar climate since the middle Miocene.
Recent studies in the Olympus Range, at the head of the McMurdo Dry Valleys by Lewis et al. (Reference Lewis, Marchant, Ashworth, Hemming and Machlus2007, Reference Lewis, Marchant, Ashworth, Hedenäs, Hemming, Johnson, Leng, Machlus, Newton, Raine, Willenbring, Williams and Wolfe2008) have affirmed the antiquity of this landscape from sediment and moraines (Fig. 19). These have recorded the transition from warm-based alpine glaciation, with proglacial ponds, moss, algae and other biota, to cold-based alpine glaciation related to the expansion of the East Antarctic Ice Sheet. Ar–Ar ages from volcanic ash in both proglacial sediment and cold-based moraines place this transition between ∼14.0 Ma and 13.6 Ma, coincident with a high latitude cooling event inferred from the deep-sea δ18O shift (Shevenell et al. Reference Shevenell, Kennett and Lea2004). Their work also confirmed Sugden and Denton's analysis and their conclusion – the preservation of these moraine forms, biota and ashes all indicate a persistent cold-arid environment at high levels in the McMurdo Dry Valleys from mid Miocene times to the present day. The results also imply a pre–mid Miocene age for high-elevation warm-based glacial deposits (the Sirius Group) in the region.
The edge of the present day East Antarctic Ice Sheet and the western McMurdo Dry Valleys, where the transition from wet- to dry-based glaciation ∼14 Ma ago is recorded. The photograph (top) shows the south face of Rude Spur, western Olympus Range, with moraine ridges (black arrows) of cold-based Dido till/drift (brown on map-right) from expansion of interior ice and cold-based alpine glaciers, ash-dated at 13.6–12.4 Ma. Older wet-based Circe till (green on map) and ash (dated at >13.9 Ma) was found beneath gravel lag in patches in the valley floor. Photograph and map from Lewis et al. Reference Lewis, Marchant, Ashworth, Hemming and Machlus2007 – reproduced by “Fair Use” permission of the Geological Society of America. Satellite image from NASA.
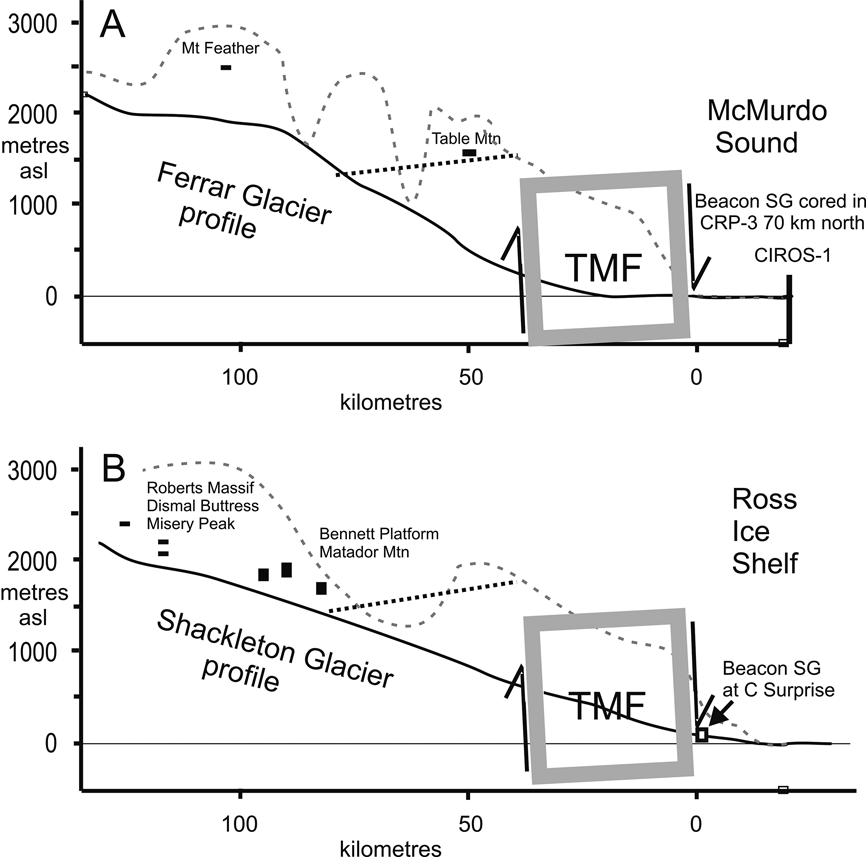
A comparison of the geomorphic and tectonic setting of Sirius Group deposits along the Ferrar Glacier in the McMurdo Sound block and the Shackleton Glacier in the Queen Maud block, some 500 km to the south, is shown in Figure 20. The upper reaches of the Shackleton Glacier have extensive scattered exposures of Sirius deposits up to 110 m thick, described by Hambrey et al. (Reference Hambrey, Webb, Harwood and Krissek2003). These comprise an older folded and faulted warm-based glacial sequence (Shackleton Glacier Formation) overlain unconformably by a less deformed but still faulted warm-based glacial sequence (Bennett Platform Formation). The Shackleton Glacier Formation includes a 10 m-thick grounding line fan sequence, implying a lake of considerable extent. Correlation of these now disrupted sequences more than 1800 m asl suggests they were deposited as extensive continuous sheets of debris on a surface of low elevation, likely close to sea level (Hambrey et al. Reference Hambrey, Webb, Harwood and Krissek2003, fig 6, stages 1–4) and subsequently uplifted and fractured (stages 5–6). In a recent report including analysis of piedmont surfaces across the Transantarctic Mountain Front (TMF), and constrained by apatite fission-track thermochronology, Miller et al. (Reference Miller, Fitzgerald and Baldwin2010) concluded that most fault activity within the TMF took place between ∼40 Ma and 14 Ma, with rock and surface uplift of no more than 370–790 m across the front since then. On this analysis, Sirius deposition and stages 1–4 of Hambrey et al. (Reference Hambrey, Webb, Harwood and Krissek2003) pre-date 14 Ma.
West to east cross-sections of the West Antarctic Rift Margin for the McMurdo Sound block (A) and the Queen Maud block (B). The 30 km-wide Transantarctic Mountain Front (TMF) (A – see Fig 18; B – Miller et al. Reference Miller, Fitzgerald and Baldwin2010) separates down-faulted Beacon Supergroup strata in the east from uplifted Beacon strata exposed to the west (heavy west-dipping dotted line). Elevations of warm-based Sirius Group deposits in (A) for Mt Feather are from Brady & McKelvey Reference Brady and McKelvey1979 and Table Mountain from Barrett & Powell Reference Barrett, Powell and Craddock1982. Those from the Shackleton Glacier are from Hambrey et al. Reference Hambrey, Webb, Harwood and Krissek2003. Here they are considered remnants of more extensive deposits formed on an older landscape before most of the uplift took place.
A pre-Pliocene age for the Sirius Group in the Shackleton Glacier area had previously been suggested on the basis of surface age dates of >10 Ma from Bennett Platform (Kurz & Ackert Reference Kurz and Ackert1997), and subsequently Ackert & Kurz (Reference Ackert and Kurz2004) provided a more substantial report of a similar study on the Sirius deposits at Oliver Bluffs at a similar elevation near the head of the Beardmore Glacier. There they found a moraine overlying Sirius till to be at least 5 Ma old, and stated “The high observed cosmogenic 3He concentrations are impossible if the samples ever were at sea level, unless the moraines were deposited many millions of years earlier than 3.8 Ma.” This is counter to the paleosol-based Pliocene estimate for Sirius deposits at Oliver Bluffs by Retallack et al. (Reference Retallack, Krull and Bockheim2001), but this was necessarily only a minimum value.
The high elevation Sirius Group strata can now be seen as a fragmentary terrestrial record of pre-mid Miocene climate, complementing the more comprehensive near-shore marine record drilled off Cape Roberts (Barrett Reference Barrett, Hambrey, Christoffersen, Glasser and Hubbart2007) and the high resolution record recently drilled 70 km south off New Harbour (Fielding et al. Reference Fielding, Browne, Field, Florindo, Harwood, Krissek, Levy, Panter, Passchier and Pekar2011). The latter provides the most detailed record thus far for the dynamic behaviour of an East Antarctic ice margin between 14.5 Ma and 20.2 Ma. Deposits on land at this time record the decline and extinction of terrestrial and lacustrine biota (Lewis et al. Reference Lewis, Marchant, Ashworth, Hedenäs, Hemming, Johnson, Leng, Machlus, Newton, Raine, Willenbring, Williams and Wolfe2008; Ashworth & Lewis Reference Ashworth and Lewis2011).
11. An Antarctic ice sheet in the warm Pliocene
If the warm-based glacial deposits of the high Transantarctic Mountains were older than mid Miocene, then what was Antarctica like in the warm Pliocene? A spectacular record of this history has come from the ANDRILL MIS core taken beneath the McMurdo Ice Shelf (Naish et al. Reference Naish, Powell, Levy, Wilson, Scherer, Talarico, Krissek, Niessen, Pompilio, Wilson, Carter, DeConto, Huybers, McKay, Pollard, Ross, Winter, Barrett, Browne, Cody, Cowan, Crampton, Dunbar, Dunbar, Florindo, Gebhardt, Graham, Hannah, Hansaraj, Harwood, Helling, Henrys, Hinnov, Kuhn, Kyle, Laufer, Maffioli, Magens, Mandernack, McIntosh, Millan, Morin, Ohneiser, Paulsen, Persico, Raine, Reed, Riesselman, Sagnotti, Schmitt, Sjunneskog, Strong, Taviani, Vogel, Wilch and Williams2009; Fig. 21). The upper part of the core records a Quaternary history of glacial and interglacial periods, with a persistent Ross Ice Shelf which expanded and grounded extensively during glacial periods leaving sheets of diamictite. In Pliocene times, however, the core showed intervals of diatomite that imply periodic ice shelf retreat and open water conditions over the site. Glaciological arguments and modelling indicate this would very likely lead to the loss of the West Antarctic Ice Sheet and low-lying parts of the East Antarctic Ice Sheet margin, with a sea level rise of as much as 7 m during Pliocene and early Pleistocene warm periods (Pollard & DeConto Reference Pollard and DeConto2009).
Record of the last five m.y. of ice sheet history cored by ANDRILL (left) from behind Ross Island and beneath the McMurdo Ice Shelf. The sediment core log (right) shows alternations of thin sub-ice shelf mud (grey) and thick diamictite (green) from a “Ross Ice Sheet” for the last two m.y. and, prior to that, alternations of diatomite (yellow) and diamictite. The diatomite indicates periods when the ice shelf had disappeared and likely also the West Antarctic Ice Sheet, as indicated by ice sheet modelling (images in centre). From Bertler & Barrett Reference Bertler, Barrett and Dodson2010 – reproduced from Dodson, J. (ed.), Changing Climates, Earth Systems and Society. International Year of Planet Earth, 49–83, with kind permission from Springer Science+Business Media B. V. After Naish et al. Reference Naish, Powell, Levy, Wilson, Scherer, Talarico, Krissek, Niessen, Pompilio, Wilson, Carter, DeConto, Huybers, McKay, Pollard, Ross, Winter, Barrett, Browne, Cody, Cowan, Crampton, Dunbar, Dunbar, Florindo, Gebhardt, Graham, Hannah, Hansaraj, Harwood, Helling, Henrys, Hinnov, Kuhn, Kyle, Laufer, Maffioli, Magens, Mandernack, McIntosh, Millan, Morin, Ohneiser, Paulsen, Persico, Raine, Reed, Riesselman, Sagnotti, Schmitt, Sjunneskog, Strong, Taviani, Vogel, Wilch and Williams2009 and Pollard & DeConto Reference Pollard and DeConto2009.
While the ANDRILL MIS core recorded periodic Pliocene ocean warming of several degrees in the McMurdo area, this seems inconsistent with geomorphological and climatological observations indicating a persistent cold climate in the McMurdo Dry Valleys at lower elevations. However, this is not necessarily so if due account is taken of the influence of katabatic winds from a persistent East Antarctic Ice Sheet. Marchant & Head (Reference Marchant and Head2007), in their review of their climate and geomorphology, identified three geomorphic zones today – a Stable Upland Zone (e.g. Beacon Valley, mean summer temperature (MST) −10°C, 1176 m asl, 74 km from the coast); an Inland Mixed Zone (e.g. Howard Glacier, MST −7°C, 472 m asl, 16 km from the coast); and a Coastal Thaw Zone (e.g. Explorers Cove, MST −5°C, 26 m asl, 4 km from the coast). The climate is heavily influenced by katabatic winds, and is arid for all but the Coastal Thaw Zone; precipitation drops from 60 mm/year water equivalent at the coast to 20 mm/year within 10 km inland (Fountain et al. Reference Fountain, Nylen, Monaghan, Basagic and Bromwich2010). A climate very little warmer or wetter than today through Pliocene times is indicated for both the Stable Upland Zone and Inland Mixed Zone by the relict landforms and slopes that have been dated on the basis of 40Ar/39Ar analyses of overlying ashfalls to between 7 Ma and 15 Ma (Marchant & Denton Reference Marchant and Denton1996). A cold-arid environment even at low elevations in Dry Valleys through the warm Pliocene can be seen in the absence of weathering in the 4 m.y.-old Hart Ash in Wright Dry Valley just 330 m asl and 30 km from the coast (Schiller et al. Reference Schiller, Dickinson, Ditchburn, Graham and Zondervan2009).
In summary, land-based field data indicate an East Antarctic Ice Sheet that maintained a cold-arid climate for the Transantarctic Mountains and the coastal Dry Valleys, but offshore drilling has demonstrated many periods in which the Ross Embayment was ice-free in the Pliocene, the most recent being the Marine Isotope Stage 31 around 1.08 to 1.06 Ma. This surprising juxtaposition is explained through recent modelling of this event (DeConto et al. Reference DeConto, Pollard and Kowalewski2012), an unusually strong interglacial event spanning tens of thousands of years, with warming observed in a number of cores from the Antarctic margin. Their results, which use the model of Pollard & DeConto (Reference Pollard and DeConto2009) and the Genesis 3.0 Global Circulation Model indicate that “While the reduced sea ice and sea surface warming in the MIS-31 simulations (Exp. 3) is in general agreement with proxy records, summer surface air temperatures remain significantly below freezing on the steep flanks and interiors of West and East Antarctic Ice Sheets, except for a narrow zone near the Ross Sea. This precludes any significant snow or ice melt on the flanks…”. In essence, the seaward flank of the Transantarctic Mountains has been kept cold through periods of Ross Sea warmth by the interior ice sheet and its katabatic winds (Fig. 22). This is also consistent with the lack of on-land erosion and offshore deposition of diatom ooze during warm Pliocene intervals of the ANDRILL MIS core. DeConto et al. (Reference DeConto, Pollard and Kowalewski2012) cautioned that the resolution of the Global Circulation Model is coarse relative to the width of potential ablation zones along the steep flanks of the ice sheet, and work with more highly resolved atmospheric models is needed, but these early results are consistent with the geomorphic and geological observations outlined above.
Comparison of Antarctic Ice Sheet numerical reconstructions for today (modern), Last Glacial Maximum (LGM), Marine Isotope Stage 31 (MIS 31) and mid-Pliocene times. The map shows the present-day bedrock elevation (shaded brown above sea level and blue below) and ice surface elevation (contours in km), and the location of the cross-sections (red line). Surface and bedrock elevation were interpolated from the following data sets: modern surface – Bamber et al. Reference Bamber, Gomez-Dans and Griggs2009 and Griggs & Bamber Reference Griggs and Bamber2009; modern bedrock – Nitsche et al. Reference Nitsche, Jacobs, Larter and Gohl2007; LGM – Mackintosh et al. Reference Mackintosh, Golledge, Domack, Dunbar, Leventer, White, Pollard, DeConto, Fink, Zwartz, Gore and Lavoie2011; MIS 31 and Pliocene – Pollard & DeConto Reference Pollard and DeConto2009. The modern data are at 5 km resolution, the LGM at 20 km and the MIS 31 and mid-Pliocene at 40 km. As a consequence, topography for older profiles is more subdued.
In a recent review of late Neogene history of the South Victoria Land coast from outcrops, drill cores and offshore seismic data, Levy et al. (Reference Levy, Cody, Crampton, Fielding, Golledge, Harwood, Henrys, McKay, Naish, Ohneiser, Wilson, Wilson and Winter2012) provide a well constrained chronology for the regional response to global cooling from peak early Pliocene warmth, resulting in an ice-free coast and accelerated outlet glacier flow, to Late Quaternary persistent land-fast sea ice even during interglacial periods. They argue for warmer Pliocene temperatures within the McMurdo Dry Valleys than suggested here, but may not take sufficient account of the likely strong thermal gradient at the coast.
12. Concluding comments
The 1980s discovery of marine Pliocene microfossils in the high level Sirius deposits of the Transantarctic Mountains was remarkable and led to an imaginative hypothesis. For the first few years, the origin of these diatoms from marine basins in the Antarctic interior seemed to many the only credible possibility. However, in hindsight, the hypothesis was not well tested in its formative stages. One reason was undoubtedly the lengthy, difficult and specialised process of extracting the diatoms from the matrix under sterile conditions, bearing in mind abundances were of the order of a few specimens per gram. As a consequence, replication was not easy and in fact not attempted for about a decade (Stroeven Reference Stroeven1994; Bleakley Reference Bleakley1996).
There has also been a tendency amongst all of us not to take full account of new data and techniques from fields beyond those with which we are familiar. Sugden (Reference Sugden1996) reflected thoughtfully on this in his address to the Institute of British Geographers. A broad appreciation of cognate disciplines is becoming increasingly important in resolving differences in scientific issues, and in maintaining respect and credibility with the wider community. This is all the more important with rising interest and concern about the stability of the Antarctic ice sheet in the face of future warming and rising sea levels.
A positive outcome of the debate has been the extensive body of knowledge generated by the controversy in both the McMurdo Dry Valleys and the central Transantarctic Mountains and, in particular, the realisation that the Sirius Group most likely represents a significant terrestrial sedimentary and biological archive covering many million of years of Oligocene and early Miocene times.
13. Acknowledgements
I am grateful to the ISAES 11 committee for allowing me to undertake this review, and to my 4th year class of the last few years for keeping the debate fresh. I am especially grateful to the two formal reviewers, Michael Hambrey and David Sugden, and the many informal reviewers on both sides of the debate, who checked and commented on various aspects of the manuscript in a frank and useful way.