I. INTRODUCTION
Among the different oxide compounds investigated as thermoelectric materials (TEs), Reference Terasaki, Sasago and Uchinokura1–Reference Koumoto, Funahashi, Guilmeau, Miyazaki, Weidenkaff, Wang and Wan3 cobaltite Bi2Sr2Co2O x (BSC-222) is a promising p-type material for high temperature thermoelectric applications in air. The efficiency of TE conversion increases with the dimensionless figure of merit, ZT, which is defined as ZT = S 2 Tσ/κ, where S is the Seebeck coefficient, T is the absolute temperature, and σ and κ are the electrical and thermal conductivity, respectively. BSC-222 single crystals exhibit a promising ZT value of 1.1 at 700 °C in air. Reference Funahashi and Shikano4 The BSC-222 phase exhibits a particular layered structure where CoO2 layers alternate with Bi0.87SrO2 block layers along the c-axis with a misfit structure. Reference Leligny, Grebille, Perez, Masset, Hervieu and Raveau5 Linked to this layered structure, phonon scattering at the interface between layers is expected to impact thermal transport properties beneficially. As predicted, the ZT value for BSC-222 polycrystalline samples is lower than the BSC-222 single crystal. To the best of our knowledge, a ZT value of 0.19 in air at 700 °C is the best value reported thus far for BSC-222 polycrystalline materials. Reference Funahashi, Matsubara and Sodeoka6 Recently, by using partial melting processing, the ZT value has been improved to 0.27 at 700 °C in air. Reference Combe, Funahashi, Azough and Freer7 Green pellets are heated to a state known as “partial melting”. In this state, BSC-222 phase being an incongruent system is decomposed into a liquid (Bi-rich) and a solid (Bi-poor) phase. By slow cooling to room temperature, the BSC-222 grains are reformed through a peritectic reaction between the solid and liquid phases. Reference Funahashi, Matsubara, Ueno and Ishikawa8 In BSC-222 samples prepared by partial melting, the electrical resistivity and thermal conductivity can be decreased by preparing samples with large grain size and low bulk density. A lowering of the thermal conductivity of the phonon part has been observed in the partially melted samples. However, the origin of the low thermal conductivity measured for the microstructure of partially melted BSC-222 samples is not yet clearly understood because of the significant porosity and presence of secondary phases. Reference Combe, Funahashi, Azough and Freer7 To investigate clearly the reason for the decreased thermal conductivity, preparation of samples with minimal porosity is required. Because BSC-222 bulk materials have a layered structure, the preferential orientation of grains in the consolidated material must be considered. Hot pressing is an efficient processing method for preparing anisotropic materials with high bulk density and optimized preferential grain orientation. Reference Shin and Murayama9,Reference Masuda, Nagahama, Itahara, Tani, Seo and Koumoto10 By comparing the thermal conductivity of BSC-222 samples that have optimized bulk densities and preferential grain orientation, but which differ by the presence or absence of secondary phases, it appears possible to investigate the influence of secondary phases on the thermal conductivity of BSC-222 bulk materials. The objective of this study is to investigate and discuss the effect of secondary phases on electrical and, more specifically, thermal conductivities for BSC-222 bulk materials prepared by single hot pressing, partial melting, or by combined partial melting–hot pressing.
II. EXPERIMENTAL PROCEDURE
BSC-222 green bulk materials were prepared by solid-state reaction. Bi2O3 (99.999%), SrCO3 (99.9%), and Co3O4 (99.999%) from High Purity Chemicals (Kojundo Chemical Laboratory Co. Ltd., Chiyoda, Japan) were mixed by ball milling before being calcined at 1073 K for 10 h, and then twice at 1113 K for 20 h. Between each calcination step, the fired pellets were ground and pelletized. Reference Combe, Funahashi, Azough and Freer7 BSC-222 fired pellets were then treated by two different processing routes. For all BSC-222 samples, partial melting and/or hot pressing were carried out in air. The first batch of BSC-222 samples was processed by single hot pressing heat treatment at 1123 K for 20 h at a uniaxial pressure of 3.5 MPa. These samples were termed the “HP-samples”. Other BSC-222 fired pellets were treated by an initial partial melting heat treatment at 1196 K for 10 h before being hot pressed at 1123 K for 20 h at a uniaxial pressure of 3.5 MPa. Partial melting and hot pressing were achieved successively during the same heat treatment. The term “PMHP-sample” is used for these as-prepared samples. The electrical and thermal transport properties of the HP- and PMHP-samples were compared with those of the BSC-222 samples prepared by partial melting, which were termed the “PM-samples”. The PM-samples were prepared by heating BSC-222 green pellets at 1196 K for 10 h in air followed by slow cooling to room temperature for 20 h. Reference Combe, Funahashi, Azough and Freer7
Structural characterization and investigation of the possible presence of secondary phases in the BSC-222 bulk materials were carried out by x-ray diffraction (XRD). XRD powder diffraction data were collected using a RINT2000-TTR diffractometer (Bragg-Brentano mode; Rigaku Corporation, Tokyo, Japan) using Cu Kα source radiation (λ = 1.5418 Å). X-ray diffraction data were collected from 4 to 70° with a step size of 0.01° and a step time of 0.6°/min. The preferential orientation of grains in the BSC-222-samples was estimated qualitatively from XRD analysis of the bulk materials. The f 00l was calculated from 15 to 40° in the 2θ range Reference Lotgering11 :
 $${f_{00l}} = \left( {{{\sum {{I_{00l}}} } \mathord{\left/ {\vphantom {{\sum {{I_{00l}}} } {\sum {{I_{hkl}}} }}} \right. \kern-\nulldelimiterspace} {\sum {{I_{hkl}}} }}} \right) \times 100\%\quad .$$
∑I 00l represents the sum of intensities of the different (00l) peaks for the BSC-222 phase and ∑I hkl is the sum of intensities of all the BSC-222 phase diffraction peaks. Intensity values have been determined from XRD pattern analyses using the Rietveld method.
The BSC-222 bulk material microstructure was observed by scanning electron microscopy (SEM, Hitachi S-3000H, Tokyo, Japan) on fracture surfaces parallel and perpendicular to the pressing axis used for the green pellet preparation. The average grain size and standard deviation of the different prepared samples have been estimated by SEM images analysis of fracture's surface. Due to the plate-like shape of BSC-222 samples, only the size of surface's grain has been taken into account for calculation. Partially sintered or partially hidden grains have not been taken into account. For each sample, at least 100 grains have been measured to have satisfactory statistical significance. The sample crystallographic structure was studied by transmission electron microscopy (TEM; HAADF-STEM, JEOL JEM-ARM200F, Tokyo, Japan). Energy dispersive x-ray spectroscopy (EDX; Horiba S-798X II, Kyoto, Japan) measurements were used to determine the chemical composition of the phases. The thermal conductivity κ was measured perpendicular to the uniaxial pressing axis used to prepare the BSC-222 green pellets as reported previously. Reference Combe, Funahashi, Azough and Freer7 Thermal diffusivity and heat capacity were determined using a laser-flash system in vacuum from room temperature to 1000 K (Flash TE, Pico Therm, Ibaraki, Japan). κ values were calculated from the product of the heat capacity, thermal diffusivity, and bulk density determined by the Archimedes method using water. For measuring bulk densities of HP-, PMHP- or PM-samples, three samples of each have been measured to get an average value. Porosity of prepared samples has been so determined by the relationship (100-relative density)%. The lattice part of the thermal conductivity κ l was obtained by calculating the difference in electronic contribution to the thermal conductivity κe to κ. κe values were calculated according to the Wiedemann–Franz relationship (κe = L 0 Tσ, where L 0 is the Lorentz number 2.45 × 10⁻⁸ V2/K2). The electrical conductivity σ was measured using a conventional four-probe direct-current technique from room temperature to 1000 K in air using an instrument designed in our laboratory. Reference Combe, Funahashi, Azough and Freer7 The σ values were measured in the same direction as the κ values.
III. RESULTS AND DISCUSSION
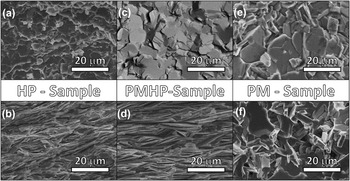
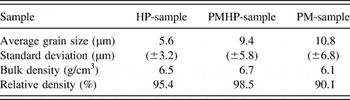
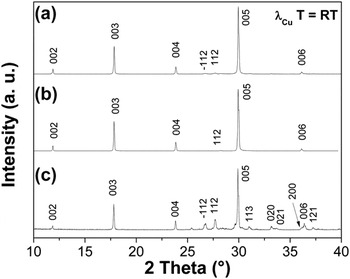
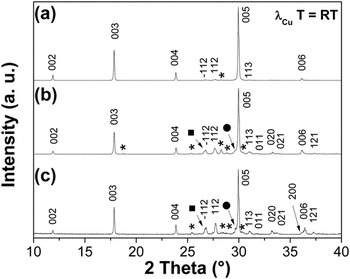
Figure 1 shows the fracture electron backscattering images parallel and perpendicular to the pressing axis used to prepare the BSC-222 bulk materials. Table I summarizes the estimated average grain size with standard deviation and densities, for the HP-, PMHP-, and PM-samples. The largest grains were visible in the PM-sample. The PMHP-sample has an average grain size that is significantly larger compared with the HP-sample because of partial melting. The PMHP-sample has an estimated average grain size of 9.4 μm whereas that for the HP-sample is 5.6 μm [Fig. 1(a)]. Scanning electron micrographs perpendicular to the pressing direction used to prepare the green pellets show that the plate-shaped grains of the BSC-222 phase are well aligned in the HP- and PMHP-samples [Figs. 1(b) and (d)]. By improving the grain orientation, the packing structure of the BSC-222 grains is improved. The XRD patterns of the bulk materials are shown in Fig. 2. The main peaks of all these patterns were identified (Jade software) by the Bi1.85Sr2Co1.85O7.7−δ phase (JCPDS 00-049-0691); furthermore, all peaks can be indexed by the I2/a space group, according to the previously reported results of H. Leligny et al. and O. Jankovský et al. Reference Leligny, Grebille, Perez, Masset, Hervieu and Raveau5,Reference Jankovský, Sedmidubský, Rubešová, Sofer, Leitner, Ružička and Svoboda12 These results suggest that the final compositions obtained should be close to Bi1.85Sr2Co1.85O7.7−δ. As reported by O. Jankovský et al., an extremely large preferred orientation of grains was found out documenting layered character of the structure. The process ways used for obtaining these compounds may be responsible of these deviations. In order to fully understand the crystal arrangement of these three different compounds, single crystal x-ray diffraction seems to be powerful characterization technique. The preferential grain orientation was investigated qualitatively using Eq. (1). The calculated f 00l factors for the HP- and PMHP-samples were 88% and 99%, respectively. Applying pressure during sintering step is fundamental for optimizing the packing arrangement of plate-shaped BSC-222 grains in microstructure. Because of the absence of applied pressure during processing, the f 00l factor of the PM-sample was 54%. Because of the important packing structure of grains, HP- and PMHP-samples possess high bulk densities. The density was 6.5 g/cm3 for the HP-sample, which corresponds to 95% of the theoretical density of the BSC-222 phase which is 6.8 g/cm3. Reference Rubešová, Hlásek, Jakeš, Sedmidubský and Hejtmánek13 The porosity of the HP-sample is so limited to 5%. Because of its higher grain packing structure, the PMHP-sample had a higher bulk density. The PMHP-sample reached a bulk density of 6.7 g/cm3, which is close to the theoretical density of the BSC-222 phase. Combining partial melting and hot pressing is therefore a suitable processing technique for BSC-222 bulk material preparation with maximal bulk density and optimized preferential grain orientation.
Electron backscattering images of fractures for BSC-222 and HP-, PMHP-, and PM-samples parallel (a, c, e, respectively) and perpendicular (b, d, f, respectively) to the pressing axes used to prepare green bulks.

Average grain size and its standard deviation, bulk density, and relative density versus theoretical value for BSC-222 HP-, PMHP-, and PM-samples.

Bulk XRD patterns for all prepared BSC-222 samples (PDF file 00-049-0691): HP- (a), PMHP- (b) and PM-sample (c).

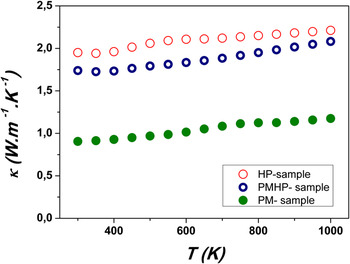
The temperature dependence of the total thermal conductivity κ is shown in Fig. 3. The κ values increase slightly with increasing temperature for all BSC-222 samples. The increase in thermal conductivity with temperature agrees with previously reported studies on the BSC-222 phase materials. Reference Funahashi, Matsubara and Sodeoka6,Reference Hsu, Lee, Wu, Kuo, Chen and Chou14,Reference Wang, Bai, Wang, Lü, Wang and Fu15 This anomalous temperature dependence of thermal conductivity may be due to intrinsic material behavior, Reference Androulakis, Migiakis and Giapintzakis16 bipolar thermal conduction, Reference Wang, Yang, Toll, Yang, Zhang and Tang17 or other phonon scattering mechanism, other than phonon–phonon interactions. Possible scattering mechanism is defect scattering. κ reaches 2.2 W/(m K) at 1000 K in air for the HP-sample. By comparison with other reported BSC-222 bulk materials, Reference Funahashi, Matsubara and Sodeoka6,Reference Xu, Funahashi, Shikano, Matsubara and Zhou18 the thermal conductivity of the hot pressed BSC-222 samples increases significantly, and is linked to the significant bulk density and improved preferential grain orientation. However, the PMHP-sample exhibits a slightly lower κ value than the HP-sample. At 1000 K in air, the κ value reaches 2.0 W/(m K).
Evolution of total thermal conductivity κ with temperature for BSC-222 HP-, PMHP-, and PM-samples.

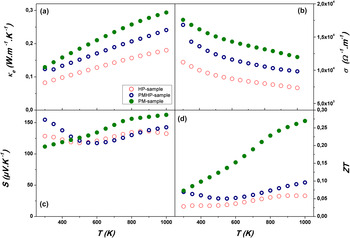
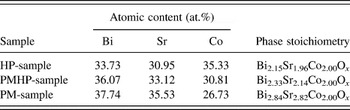
The evolution of the electronic contribution κe of the thermal conductivity with increasing temperature is shown in Fig. 4(a). The κe values have been calculated from electronic conductivity measurements reported in Fig. 4(b). The temperature dependence of the κe values differs slightly among the three BSC-222 samples. The PMHP-sample has a higher κe values than the HP-sample, which is linked to an improved electrical conductivity [Fig. 4(b)]. This enhanced electrical transport property may be attributed to the higher bulk density and improved preferential grain orientation of the PMHP-sample. The highest κe values are calculated for the PM-sample, despite the low bulk density, porosity being closed to 10% of the bulk density, and random grain orientation. Because the largest average grain size is measured for the PM-sample, the electrical transport properties of the BSC-222 samples seem to be mainly due to the grain size parameter rather than the porosity or preferential grain orientation. The PMHP-sample has an average grain size slightly lower than that of the PM-sample but higher than that of the HP-sample, so the κe values of the PMHP-sample lie between those of the PM- and HP-samples. As the different processing ways may also affect the cationic composition of the BSC-222 main phase, BSC-222 phase easily accepting elemental nonstoichiometry, carrier concentration may differ among the different BSC-222 samples. Carrier concentration can be qualitatively estimated by cationic and oxygen content. As it is well known, the determination of oxygen content by EDX analysis is not reliable. Seebeck coefficient and electrical resistivity have a trade-off relation and are dominated by the carrier concentration. The temperature dependence of Seebeck coefficient is shown on Fig. 4(c). The temperature dependence profile of S values is similar between HP- and PMHP-samples. So, the carrier concentration is similar in these two samples, indicating that the peritectic reaction goes on during hot pressing step. For the HP-, PMHP- and PM-samples, the cationic composition corresponds to Bi2.15Sr1.96Co2.00O x , Bi2.33Sr2.14Co2.00O x and Bi2.84Sr2.84Co2.00O x , respectively (Table II). So, if the oxygen contents are constant, the valence of Co element may decrease in the order HP-, PMHP- and PM-sample, meaning that the carrier concentration (holes) is decreasing in this order. This is confirmed by Fig. 4(c) as the highest S values are measured for PM-sample, for temperatures higher than 500 K. Resulting from σ, κ, and S values, the temperature dependence of the dimensionless figure of merit ZT has been calculated [Fig. 4(d)]. Due to the highest σ, S values and lowest κ values, best ZT values are measured for PM-sample. For hot pressed samples, the decreasing of thermal conductivity in partially melted samples has a beneficial impact on ZT values measured for PMHP-sample by comparison with HP-sample.
Temperature dependence of electrical contribution κe to total thermal conductivity for all BSC-222 samples (a). κe values have been calculated from temperature dependence of electrical conductivity σ of the different BSC-222 samples, shown in (b). The temperature dependence of the Seebeck coefficient S values are shown by (c). (d) shows the temperature dependence of the dimensionless figure of merit ZT values for the different prepared BSC-222 bulk materials.

Atomic content and chemical composition of main phases in the different prepared BSC-222 bulk materials.

The phonon thermal conductivity κ l plays a major role in the thermal transport properties of the BSC-222 bulk materials. Reference Funahashi and Shikano4 The lowest κ l values were calculated for the PM-sample. In the hot-pressed samples, the κ l values were suppressed for the PMHP-sample compared with the HP-sample (Fig. 5). Because the hot-pressed materials were well densified, the influence of porosity on thermal transport properties can be neglected between the HP- and PMHP-samples because the bulk density is almost the same. In comparison with the HP-sample, the PMHP-sample has an improved preferential grain orientation. These different parameters should increase the phonon transport properties in the BSC-222 bulk materials. However, in this study, lower κ l values were calculated for the PMHP-sample than for the HP-samples.
Temperature dependence of lattice κ l contributions of total thermal conductivity for BSC-222 HP-, PMHP-, and PM-samples.

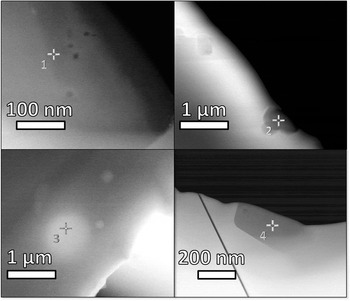
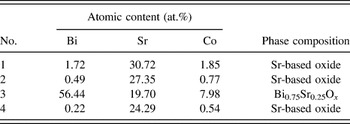
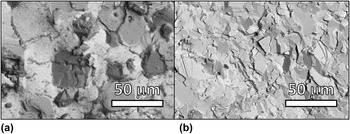
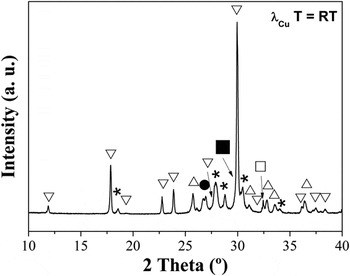
Figure 6 shows typical PM-sample nanostructures for different magnifications. The presence of different secondary phases with submicronic dimensions in the BSC-222 grains is visible. The atomic ratios measured for the different secondary phases have been investigated by EDX analysis for several grains. Four of the most representative EDX measures are reported in Table III. The secondary phases were Bi0.75Sr0.25O x phase and Sr-based oxide phase. These phases seem to be dispersed randomly in the BSC-222 grains and may reduce the thermal conductivity in partially melted BSC-222 samples by phonon scattering. To investigate the secondary phases further, powder XRD patterns were analyzed (Fig. 7). For all diffraction patterns, the majority of the diffraction peaks were indexed as the BSC-222 majority phase. In the case of HP-sample, traces of Bi0.75Sr0.25O x phase are also detected. However, in the PMHP- and PM-sample, several peaks resulting from secondary phases were visible. These other peaks are attributed to the Bi0.75Sr0.25O x phase but also to the Sr-based oxide and CoO which was not visible in the TEM analysis images. Figure 8 shows the backscattering SEM images of the PM-sample that was quenched at a partial melting temperature [1196 K, Fig. 8(a)] and after solidifying completely by slow cooling over 20 h [Fig. 8(b)]. Figure 9 shows the powder XRD pattern of quenched sample at a partial melting temperature. It is noteworthy that the strong complexity of the phases formation during the heat treatment implies numerous intermediate compositions, therefore the accurate nominal compositions of the phases remains difficult to determine. In the partial melting state, grains of the Sr-based oxide phase, CoO and Sr2Co2O5 phases are surrounded by a large amount of Bi0.87SrO2, Bi2SrO4, Bi0.75Sr0.25O x phases. The BSC-222 phase is an incongruent system. Reference Jankovský, Sedmidubský, Rubešová, Sofer, Leitner, Ružička and Svoboda12 Sr-based oxide phase, CoO, and Sr2Co2O5 exist as solid phases in a partially melted state despite the Bi0.87SrO2, Bi2SrO4, Bi0.75Sr0.25O x phases being liquid. During solidification, a peritectic reaction occurs between the solid and liquid phases and reforms the BSC-222 phase. As shown in Fig. 8(b), after cooling, grains of the BSC-222 phase are mainly visible. However, the solid Sr-based oxide phase, CoO, and Bi0.75Sr0.25O x phases are remnant secondary phases in the BSC-222 samples, even after a long cooling time [Fig. 7(c)]. These remnant secondary phases should also impact the electrical conductivity. Reference Combe, Funahashi, Azough and Freer7 However, as discussed above, σ values are mainly affected by the average grain size.
Transmission electron micrographs of BSC-222 PM-sample at different magnifications. Numbered crosses correspond to EDX analysis spots. Results of EDX analysis are reported in Table III.

Cationic content in secondary phases observed in partially melted BSC-222 samples.

Powder XRD patterns for all prepared BSC-222 samples: HP- (a), PMHP- (b) and PM-sample (c). Peaks corresponding to secondary phases Bi0.75Sr0.25O x (PDF file 00-045-0609) and CoO (PDF file 04-006-3706) are indicated by the symbols * and ■, respectively. XRD peak indicating by the ● symbol is attributed to Sr-based oxide secondary phases.

Backscattering SEM images of quenched BSC-222 pellet at partial melting temperature (a) and PM-sample after solidifying completely by slow cooling (b).

Powder XRD profile for BSC-222 PM-sample quenched at partial melting temperature. Reflection peaks of Bi0.87SrO2 phase (PDF file 01-070-3468) are indicated by symbol ▽, Bi2SrO4 peaks (PDF file 00-039-1424) by the symbol △, CoO (PDF file 04-006-3706) by the ■ symbol, Bi0.75Sr0.25O x phase (PDF file 00-045-0609) by the * symbol and Sr2Co2O5 phase (PDF file 00-034-1475) by the □ symbol. XRD peak indicating by the ● symbol is attributed to Sr-based oxide secondary phases.

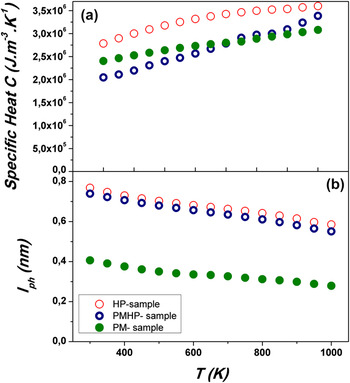
To investigate the temperature dependence of the phonon mean free path in the HP-, PMHP-, and PM-samples, the expression of thermal conductivity κ = Cvl/3 was used, which is based on the Drude model. Reference Ashcroft and Mermin19
In this expression, C is the value of the specific heat, v is the sound velocity, and l is the phonon mean free path. Temperature dependence of specific heat C is shown in Fig. 10(a). Based on the value reported by Terasaki et al. on the sound velocity in a single crystal of Bi2-x Pb x Sr2Co2O y composition (v = 2800 m/s), Reference Terasaki, Tanaka, Satake, Okada and Fujii20 the evolution of phonon mean free path with temperature has been calculated and is shown in Fig. 10(b). The lowest phonon mean free path values are calculated for the PM-sample and reach almost twice this value in hot-pressed BSC-222 samples. By comparison with the HP-sample, the phonon mean free path is slightly lower for the PMHP-sample over the measured temperature range, at ∼4%. It is generally accepted that phonon scattering results from three scattering mechanisms, which are related to phonon–phonon (Umklapp), defect, and grain boundary scattering. Reference Battabyal and Dey21 For all BSC-222 samples, the average grain size value of main phase BSC-222 is large (>5 μm) compared with the phonon mean free path value which is lower than 1 nm. Concerning secondary phases, the sizes of inclusions may be estimated between about 10 nm and 1 µm. So, phonon scattering by grain boundaries may be neglected. Reference Qu, Wan and Pan22 The thermal conductivity κ agrees with the classical phonon transport expression Reference Morimoto, Kato, Ogasawara, Kashimura and Abe23 :
 $$\kappa = {\left( {A + BT} \right)^{ - 1}}\quad ,$$
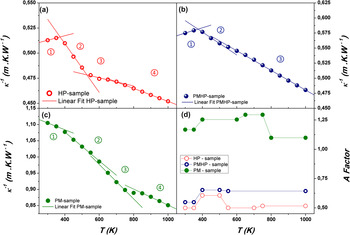
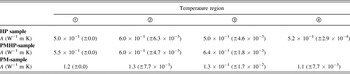
where A is related to the thermal resistivity linked to phonon–lattice defect interactions, and BT corresponds to phonon–phonon interactions based on the Umklapp processes. In this study, A values are determined from a linear fit of the thermal resistance κ−1 against temperature to investigate the phonon-lattice defects interactions [Figs. 11(a)–11(c)]. As shown by Fig. 11, four temperature regions can be observed for the temperature dependence of thermal resistance κ−1 curves for the HP- [Fig. 11(a)] and PM-samples [Fig. 11(c)]. Concerning the PMHP-sample, three temperature regions are observed. Three major reasons may be identified as phonon-scattering origins: grain boundaries, pores, and secondary phases (or other microscopic structures induced by partial melting process). These different defects should have different upper limit temperatures, under which they can act as phonon scattering sites. The calculated A values for the different samples are reported in Table IV.
Temperature dependence of specific heat C (a) and phonon mean free path (b) in BSC-222 HP-, PMHP-, and PM-samples.

Temperature dependence of thermal resistivity in BSC-222 HP-(a), PMHP-(b), and PM-samples (c). Lines correspond to linear fit used to determine the A factors in Eq. (2). The different temperature regions are numbered by ①, ②, ③ and ④ labels. (d) shows the temperature dependence of the A factor calculated for the HP-, PMHP- and PM-samples.

A factor values obtained from linear fit of temperature dependence of thermal resistivity of BSC-222 HP-, PMHP-, and PM-samples Eq. (2), with standard deviation.

The temperature dependence of A factor against temperature is shown on Fig. 11(d). For PM-sample, an important decrease of A factor is observed between 750 and 850 K. No such decrease happens for HP- or PMHP-samples. Among the different samples, only PM-sample is highly porous. It may be reasonable that pores can play a role of phonon scattering sites up to higher temperatures than grain boundaries, secondary phases or other defects. Therefore, the important decrease of A factor observed between 750 and 850 K may indicate the upper limit temperature for the pores. By comparing PM- and PMHP-samples, another important decrease can be observed between 500 and 550 K for only the HP-sample, indicating that some phonon scattering sites, not observed in HP-sample, should exist in PMHP-sample. These phonon scattering sites also exist in PM-sample as no decrease of A factor can be observed in this temperature region. This decrease in this temperature region may be due to the upper limit temperature of grain boundaries in the HP-sample. This difference around 500 and 550 K is a clear evidence that the partial melting processing way is effective for introducing some new phonon scattering sites, which can act up to higher temperature than the grain boundaries formed by the conventional solid state sintering. The interface between the secondary phases and BSC-222 grains could act as phonon scattering sites. However, considering the grain size of the secondary phases observed in the SEM images, other small secondary phases or/and defects should be paid attention. To make clear the phonon scattering sites, fine microscopic observation using transport microscopy is necessary. As mentioned above, the hole density is estimated low for the PM-sample by EDX measurement, although the oxygen contents have never been analyzed. This result is reasonable with the S values at 500 K and higher. However an intersection of the S–T curves between the PM-sample and the others is observed in Fig. 4(c). This result may indicate that the carrier density of the samples changes around 500 K, namely high carrier density in the PM-sample. At lower temperatures than 400 K, the tangent values of the κ−1–T curve are positive except that of the PM-sample [Fig. 11(c)]. This implies any other phonon scattering mode, e.g., carrier–phonon interactions, is observed in the PM-sample.
This study highlights the benefit of porosity and the introduction of secondary phases by peritectic reaction using partial melting to prepare BSC-222 bulk materials with decreased thermal conductivity. For partially melted samples, the major origins of lattice thermal conductivity decrease may be mainly linked to the porosity and lattice defects. Indeed, for the PM-sample, 10% of porosity can largely decrease the thermal transport. Moreover, significant lattice defects, as revealed by the large deviation from stoichiometry in PM-sample, may also play an important role. An enhancement of phonon scattering can be achieved in BSC-222 bulk materials by lowering the density Reference Combe, Funahashi, Azough and Freer7 and by promoting the formation of secondary phases. Because of the primary importance of grain size on electrical conductivity by comparison with carrier concentration, it is possible to decrease the thermal conductivity by controlling secondary phase formation without affecting electric transport properties.
IV. CONCLUSION
BSC-222 bulk materials were prepared by single hot pressing or by partial melting followed by hot pressing. Thermal transport properties of hot-pressed materials were compared with that of BSC-222 samples prepared by single partial melting. Hot-pressed samples have a bulk density that is higher than 95% of the theoretical density of the BSC-222 phase. Because of pressure applied during processing, plate-shaped grains of the BSC-222 phase have a highly preferential grain orientation perpendicular to the pressing axis used during hot pressing. Despite important grain sizes resulting from grain growth during partial melting, the highest bulk density and maximal preferential grain orientation are observed for hot pressing partially melted samples compared with single hot-pressed samples, and lower thermal conductivity values were measured in all temperature ranges because of a significant decrease in the lattice contribution of thermal conductivity. Several secondary phases, with Bi0.75Sr0.25O x , Sr-based oxide phase, or CoO compositions, existed in the BSC-222 sample prepared by partial melting. A study of the temperature dependence of thermal properties with classical phonon transport theory shows that the decrease of lattice thermal properties in partially melted BSC-222 bulk materials is not only linked to the presence of pores but also to the introduction of phonon scattering sites observed for samples containing a high content of secondary phases. It is noteworthy that, linked to a modified carrier concentration in partially melted samples, electron–phonon coupling may also play a role in phonon scattering mechanisms.
It is now necessary to investigate clearly the origin of phonon scattering in partially melted BSC-222 bulk materials. Indeed, the origin may be linked to the amount of secondary phases, to a specific grain boundary structure and/or to the presence of structural defects in partially melted BSC-222 samples. This point is of particular importance for developing future BSC-222 bulk materials with high thermoelectric efficiency.
ACKNOWLEDGMENT
The authors gratefully acknowledge the Japan Society for the Promotion of Science (JSPS) for their financial support.