

Democratic equality is embodied in formal eligibility to vote, and eligible citizens can choose whether or not to exercise this right. But theorists and courts have rightly been concerned with the equality of the effect of each vote, which is a function of institutions, preferences and political geography (see Bickerton and Graham, Reference Bickerton and Graham2020; Spitzer, Reference Spitzer2018). The concern should be strongest in the case of the most ineffective votes: those that are not cast. And while insincere voting can be technically effective, it may not feel effective: it is surely less satisfying than voting one's true preference. Thus, the effective equality of democratic representation and citizens’ satisfaction with it are likely threatened if a polity contains any systematic influences on behaviour that result in differential abstention or strategic voting by non-random sets of citizens. Voters who abstain or vote strategically have not had their preferences rendered through the electoral system in the same way as have voters who vote sincerely. This research note evaluates how abstention and strategic voting vary by party preference in Canada, using data from the federal election of 2019. Are non-voting and strategic voting more likely among citizens with certain political preferences?
There is a well-established link between electoral systems and turnout that works through the range and distinctiveness of the potential choices, along with the likelihood that a given vote will visibly translate into representation (see Wilford, Reference Wilford2017, and references therein). Voters prefer to make choices that correspond with their preferences (Ezrow and Xezonakis, Reference Ezrow and Xezonakis2011) and to cast votes with a good prospect that representatives sharing those preferences will be elected (Bernauer and Vatter, Reference Bernauer and Vatter2011; Blais and Gélineau, Reference Blais and Gélineau2007; Gallego et al., Reference Gallego, Rico and Anduiza2012: 159). As either of these two factors diminishes, voters see less and less point in taking the time and making the emotional and cognitive investment to cast a ballot. “Why bother?” they likely say. The other option to avoid a “wasted vote” is to vote strategically, so this research note considers both behaviours as suboptimal from the perspective of the voter. Our principal objective is to assess whether these behaviours are concentrated among identifiable political groups.
To our knowledge, there is no existing study that explicitly assesses the interaction of party preference and likelihood of voting for a winning local candidate on turnout at the level of individual voters. Most of the evidence for the claims mentioned above comes from the aggregate level, comparing levels of turnout across different electoral systems (Blais and Carty, Reference Blais and Carty1990; Karp and Banducci, Reference Karp and Banducci1999; Banducci and Karp, Reference Banducci, Karp and Klingemann2009; Karp and Banducci, Reference Karp and Banducci2008; Söderlund, Reference Söderlund2017; Blais and Aarts, Reference Blais and Aarts2006; Norris, Reference Norris1997; Brockington, Reference Brockington2004; Vowles et al., Reference Vowles, Katz and Stevens2017; Endersby et al., Reference Endersby, Galatas and Rackaway2002; Arnold, Reference Arnold2018; Curini and Jou, Reference Curini and Jou2016; Blais and Carty, Reference Blais and Carty1991). Studies of Canadian and British elections show that riding competitiveness affects propensity to vote, but they use only the total competitiveness of the riding rather than voters’ judgments about the relative competitiveness of their own preferred party (Johnston et al., Reference Johnston, Scott Matthews and Bittner2007; Vowles et al., Reference Vowles, Katz and Stevens2017; Maeda, Reference Maeda2016; but see Blais et al., Reference Blais, Loewen, Rubenson, Stephenson, Gidengil, Stephenson, Aldrich and Blais2018, which finds no effect in an experiment). That evidence does not indicate whether voters are deterred from voting because their own preferred party is less competitive. The contrast with studies of strategic voting is striking: many show that strategic voting is conditional on party preference and voters’ judgments of their preferred party's competitive position.
Our results show that Canadians express a weaker intention to vote as their preferred party is less and less likely to win the local seat. This effect is, perhaps not surprisingly, distributed unequally in the aggregate across parties. We also show that strategic voting is more common among supporters of some parties than others, meaning that voters with preferences for more competitive parties are more likely to feel able to sincerely express their preferences than other voters.
We draw on the online 2019 Canadian Election Study (CES), with data from over 30,000 interviews (Stephenson et al., Reference Stephenson, Harell, Rubenson and Loewen2020, Reference Stephenson, Harell, Rubenson and Loewen2021), using both pre- and post-election interviews.Footnote 1
Measurement of Turnout, Strategic Voting and Competitiveness
For our dependent variables, we need a measure of turnout and another of strategic voting. Our key independent variable is the competitiveness of the voter's chosen or preferred party.
Measuring turnout
Measurement of turnout with surveys is fraught, and there is no validated measure available in Canada (Achen, Reference Achen2019). Turnout measured by post-election survey responses exceeds government-reported turnout figures by such a huge margin that survey measures of turnout are basically useless. In 2019, while Elections Canada reported 67 per cent turnout, 92.5 per cent of CES post-election respondents said they had voted. This poses a problem for estimating the proportion of voters who fail to vote as a result of their preferred party's competitiveness.
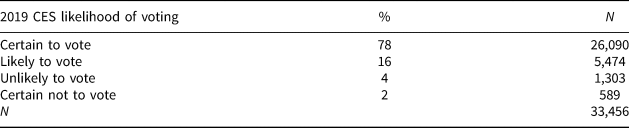
The source of the bias is that political interest and engagement drive both voting and participation in the survey, as well as reluctance to report that one has not voted (for example, due to the sense that one ought to have voted). The statistical problem is that among voters whose preferred party has little hope of winning, the ones who get through to the post-election interview will have unmeasured characteristics that make them more likely to appear in the post-election sample and to report having voted (whether truthfully or not). This is apparent from the paucity of those who say they are certain not to vote in the sample—less than 2 per cent—and the fact that among those respondents who claimed in the initial survey to be certain not to vote and nevertheless participated in the post-election interview, 20 per cent report having voted.
We therefore rely on a pre-election question, which asks voters to say how likely they are to vote (hereafter, LV): “On election day, how likely are you to vote: Certain, Likely, Unlikely, or Certain not to vote?” It is similarly biased, but likely less so. The effect of political interest on recruitment to this first survey is weaker than its effect on attrition from pre- to post-election. And the question itself, posed prior to the election and worded to diminish a social-desirability effect, gives us more variation in degree of commitment to voting than the post-election vote report. Unweighted response percentages for the CES's online respondents are shown in Table 1.
2019 Canadian Election Study (CES) Pre-election Reported Likelihood of Voting on Election Day

Source: 2019 Canadian Election Study, pre-campaign wave.
While these are only verbal representations of voters’ likely behaviour, the distribution of this variable seems far closer to the official 67 per cent turnout. Given what is known about survey recruitment biases, we surmise that this distribution is still biased in a more politically engaged, duty-bound direction as compared with the true population distribution of this LV variable. The bias is important because it is among those who are less than certain to vote that we should expect stronger effects of preferred-party competitiveness. If we estimate effects with these categories underrepresented, we will effectively underestimate the true effect in the population. There are almost certainly more of the less-than-certain voters in the population than among CES survey respondents, so we still expect our findings to be conservative estimates of the competitiveness effect on turnout. By contrast, we might overestimate the effect of strategic voting because it is more common among the most politically engaged (Merolla and Stephenson, Reference Merolla and Stephenson2007).
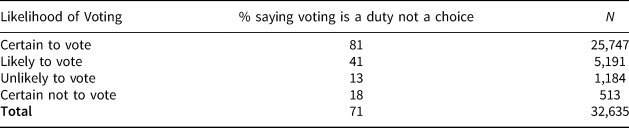
We expect that pre-election statements about the likelihood of actually voting are correlated with voters’ sense of duty to vote and that this is relevant for our analysis given the powerful effect of duty not just on voting but as a moderator of the influence of other determinants of turnout. As Blais and Achen (Reference Blais and Achen2018) argue, any influences on the costs and benefits of voting are likely to have a much stronger impact on those who do not consider voting a duty. Clearly, participation in a survey is more common among those who are politically engaged and feel that voting is a duty. This will produce an underestimate of the effect of party competitiveness on turnout because the sample has fewer people who are willing to say “why bother to vote?” than there are in the population. We cannot correct for this bias; we can only note it. We therefore conduct some analyses differentiated by respondents who consider voting a duty versus a choice. We always find much stronger effects of competitiveness on turnout among those who consider voting a choice. Table 2 shows the distribution of the duty-versus-choice question for each of the likelihood-of-voting categories.
Voting as Duty versus Choice, by Pre-election Likelihood of Voting

Source: 2019 Canadian Election Study, pre-campaign wave.
Measurement of Voters’ Preferred Party
Because we are concerned with the preferred party of people who were less likely to vote, it is unfortunate that the 2019 CES did not ask a vote intention question to voters who said they were certain not to vote. So we generally use the straightforward vote intention questions, but we also construct a measure of voters’ preferred party (PP) so we can include the “certain not to vote” respondents in some analyses. The PP measure is also key to our determination of who has voted strategically, as in other studies of strategic voting (Daoust and Bol, Reference Daoust and Bol2020). We infer voters’ PP based on their responses to the party and leader feeling thermometers; 78 per cent of respondents gave consistent responses in that their preferred leader was from the same party as their preferred party. When we use our calculated PP measure, we omit the 22 per cent of voters whose preferred party and leader were not consistent.
Measurement of strategic voting
In the single-member plurality electoral context, strategic voting (SV) refers to a voter not casting a vote for their sincerely most-preferred party or candidate, typically because they feel that their preferred option has no chance of winning. Instead, the voter chooses another option that they feel has a better chance of defeating a lesser-liked alternative, avoiding a so-called wasted vote. We categorize a voter as intending to vote or having voted strategically if their vote intent or their reported vote
1. does not match their preferred party, and
2. the voter's preferred party is outside the top two in the chances of winning the district, and
3. the party they intend to vote for or did vote for was placed in their estimate of the top two parties’ chances locally.
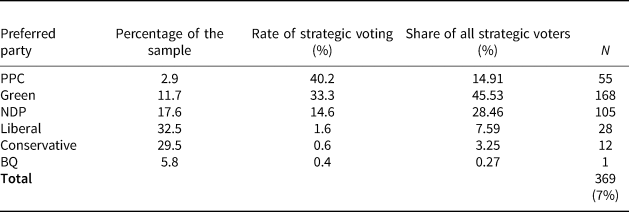
Using this definition, we find strategic voting by 7.1 per cent of post-election respondents (who voted and who ranked the parties’ chances of winning the local seat). This is above the level detected in many studies of plurality elections, particularly in Canada, where estimates have ranged from 2 per cent to 5 per cent (Blais, Reference Blais2002; Blais et al., Reference Blais, Dostie-Goulet, Bodet, Grofman, Blais and Bowler2009; Blais and Gschwend, Reference Blais, Gschwend, Dalton and Anderson2010; Blais, Reference Blais and Lewis-Beck2004; Blais et al., Reference Blais, Nadeau, Gidengil and Nevitte2001; Daoust and Bol, Reference Daoust and Bol2020; Merolla and Stephenson, Reference Merolla and Stephenson2007). However, those estimates mostly pre-date the emergence of a competitive Green Party. Below, we show that voters who preferred the Greens and the People's Party of Canada (PPC) made up 60 per cent of strategic voters in 2019, such that the rate of strategic voting by those who prefer one of the other four parties (Liberal, Conservative, New Democratic Party [NDP], Bloc Québécois [BQ]) closely matches previous estimates.
Measuring the Competitiveness of the Voter's Party
For our key independent variable, the CES asked voters to estimate the chances that each party would win the local seat—a subjective measure of party competitiveness. The CES also identifies respondents’ electoral district, so we are also able to assign an objective measure of the parties’ competitiveness based on previous election results. We use the subjective measure more heavily, but the two are closely linked despite wishful thinking in voters’ forecasts. Blais and Bodet (Reference Blais and Bodet2006) showed a strong link between the results from the previous election and voters’ perceptions of their party's local chances in the present one.
The subjective measures use a question asking for the voter's raw estimate of the chances of each party winning the riding, on a 0 to 100 scale.Footnote 2 For a given respondent, we calculate the ranked chance for each party. Our Csubj score is the “chances rank” a voter gave their intended vote party (IVP) or their preferred party. In most of what follows, we use the rank measure because it is a within-respondent measure that is not subject to inter-respondent differences in interpretation of the scale. Ranks are also the key factor in strategic voting.
Objective measures of competitiveness for an individual voter are based on the margin of loss or victory of the party in the riding in the previous (2015) election. While the previous election is an imperfect guide to the current situation in the riding, we believe it is a good proxy for the information most voters have about the relative chances of each party, and it is certainly a standard variable included in studies of strategic voting in first-past-the-post (FPTP) systems.
Results
We begin with simple stacked bar graphs to show voters’ responses to the LV question as a function of the subjective and objective measures of the competitiveness of the parties. We then use ordered logistic models to evaluate the effect of competitiveness on LV and evaluate the null hypothesis that the distribution of LV is independent of competitiveness.
Effects of competitiveness on intention to vote
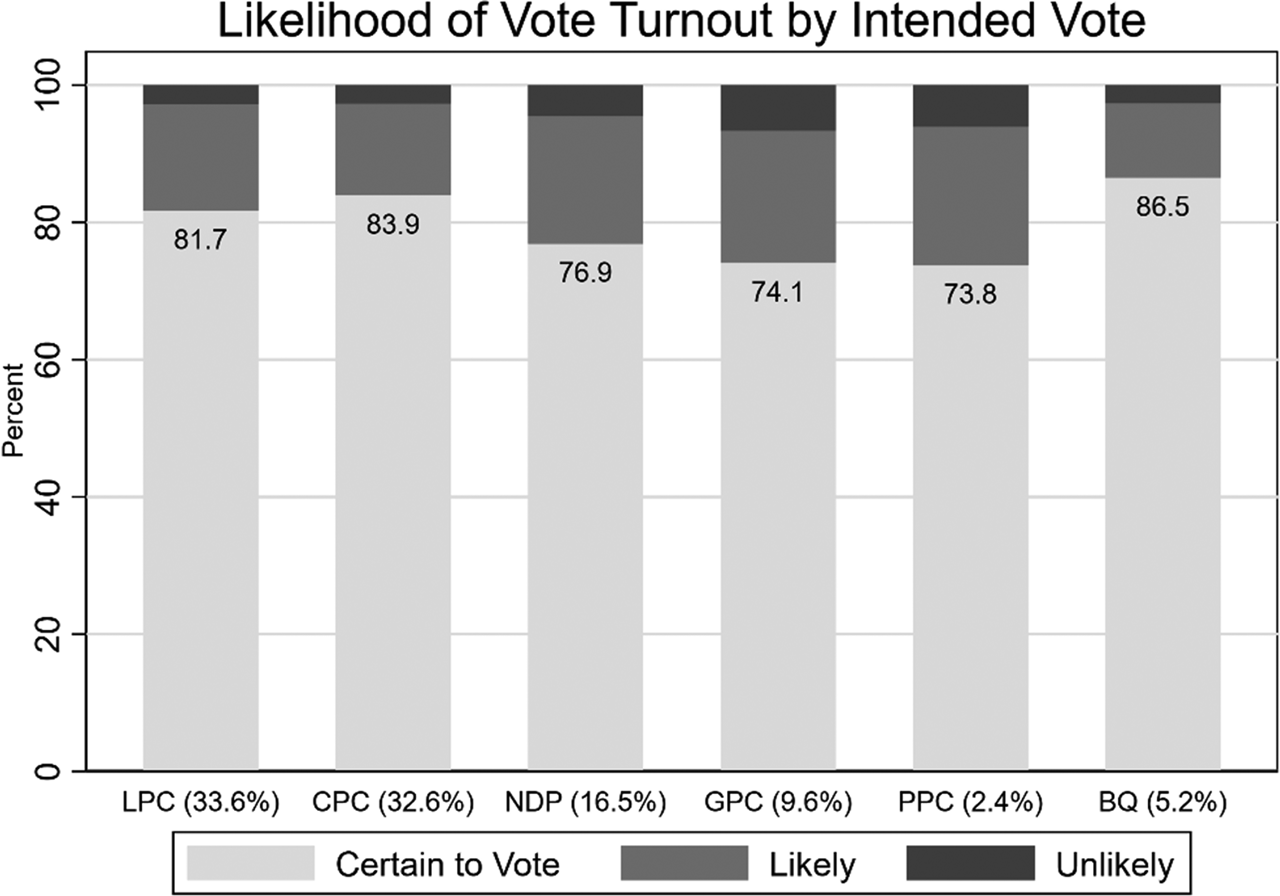
Figure 1 shows voters’ LV by the party the voter intended to vote for. In this and the following two figures, all contrasts are statistically significant except for ones involving the PPC.Footnote 3 Recall that the vote intention question was not asked to those who said they were certain not to vote. The figure shows that supporters of the traditionally “third” or “minor” parties are significantly less likely to be certain to vote. (The BQ result is an exception that is, in fact, consistent with the patterns we see below, because where it contests seats, it finishes in the top two in a majority of ridings.)
Likelihood of Vote Turnout by Intended Vote. Source: 2019 Canadian Election Study, pre-campaign wave, N = 27,406. Note: Values in parentheses indicate the fraction of voters who expressed an intention to vote for the party.

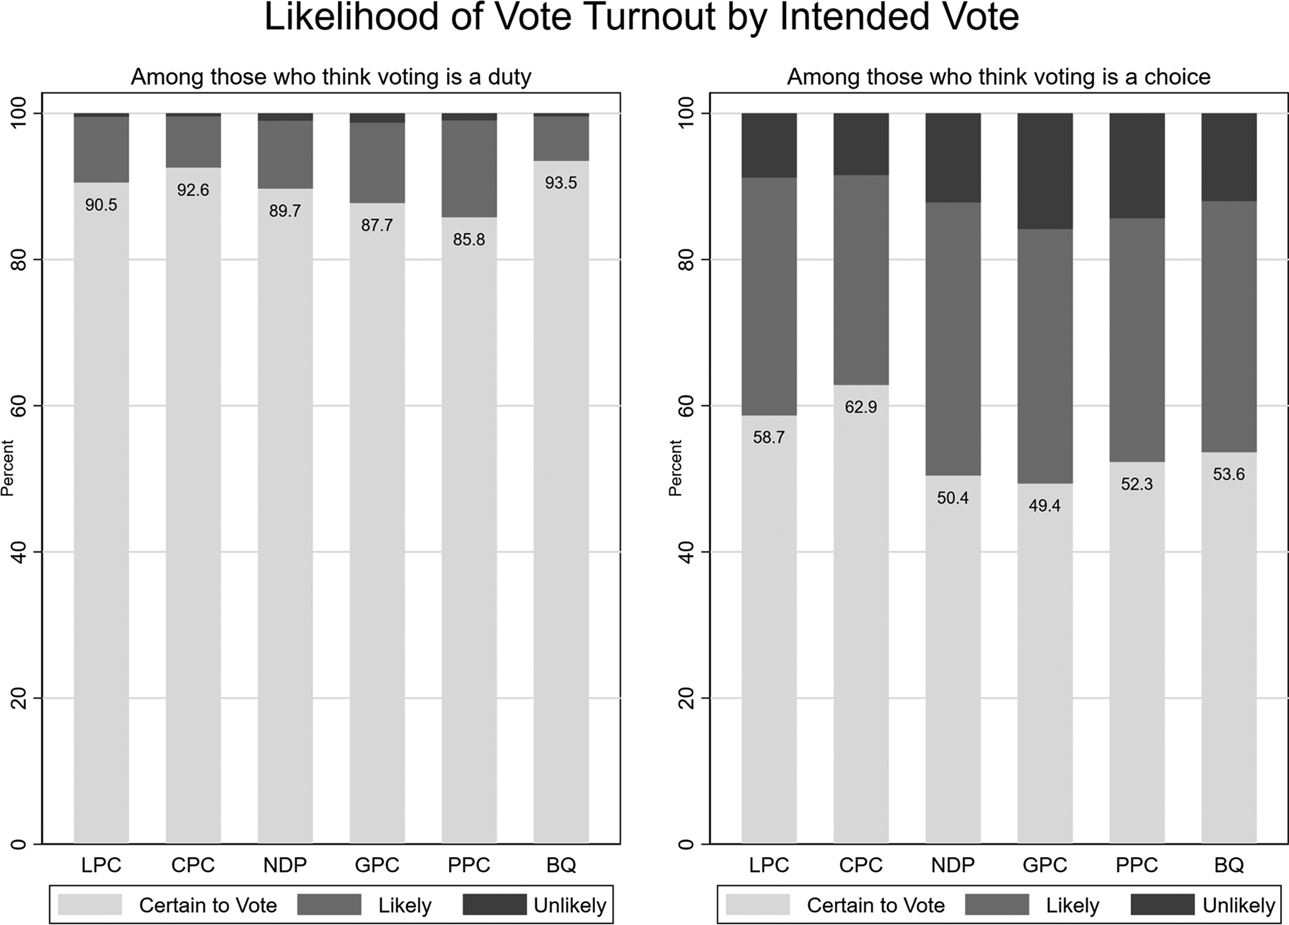
Figure 2 separates respondents based on their response to the voting is a duty or a choice question. The differences in LV by party are markedly greater among voting-is-a-choice people (29 per cent of the sample), and the overall likelihood of voting is also markedly lower among choice voters (Blais and Achen, Reference Blais and Achen2018). Voting-is-a-choice voters who support the NDP, Greens or PPC are about 10 per cent less likely to be certain to vote and about 6 per cent more likely to be unlikely to vote than comparable supporters of the Liberals and Conservatives.Footnote 4
Likelihood of Vote Turnout by Intended Vote among Those Who Think Voting Is a Duty and Those Who Think Voting Is a Choice Source: 2019 Canadian Election Study, pre-campaign wave, N = 7,455 and 19,454.

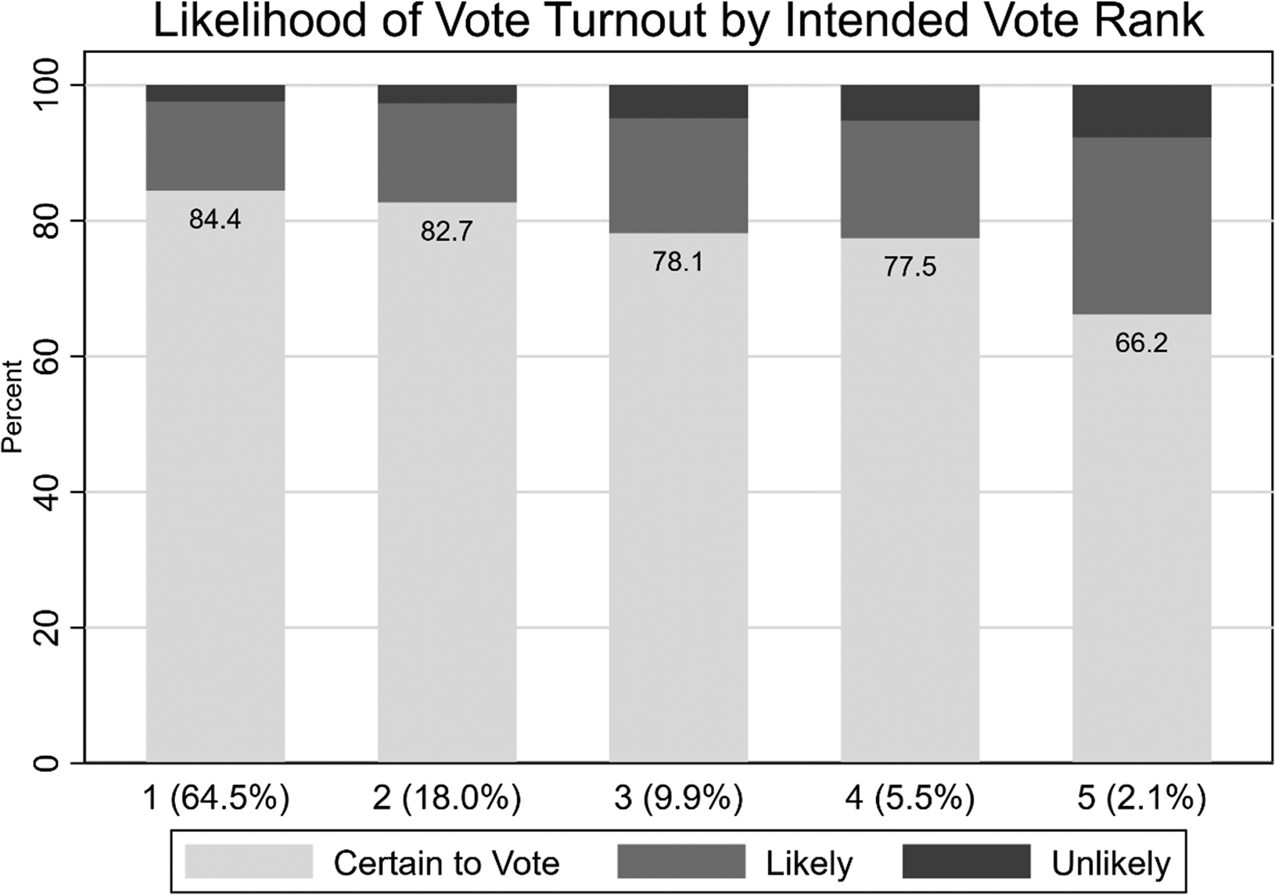
In the next figure (Figure 3), we show the same LV proportions but this time by the respondent's own ranking of the local chances of the party they intended to vote for (for example, an NDP voter who gave the Conservative Party of Canada [CPC] a local chance of winning of 60, Liberals 50 and NDP 30, would be classified into the rank 3 group). In Figure 3 we see a decline in “certain to vote” from 84.4 per cent and 82.7 per cent for the top two parties down through 78.1 per cent, 77.5 per cent and 66.2 per cent for parties outside the top two.
Likelihood of Vote Turnout by Intended Vote Rank Source: 2019 Canadian Election Study, pre-campaign wave, N = 23,031. Note: The numbers in parentheses indicate the percentage of voters who placed their intended vote choice at the corresponding rank of local chances of winning.

Notice that Figure 3 shows along the x-axis that close to 65 per cent of the sample thinks that their party has the best chance of winning the riding. This is clearly at odds with reality, given that only about 50 per cent of votes are cast for the candidate that ultimately wins the seat.Footnote 5 Voters’ overestimate of their party's local chances probably reflects both a sample selection bias and widespread wishful thinking. We simply wish to emphasize that more Canadians should be in the bars toward the right side of these figures than there are in this sample (as indicated by percentage values in parentheses).
Statistical test of competitiveness on turnout
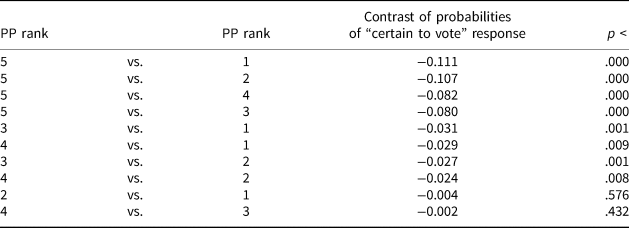
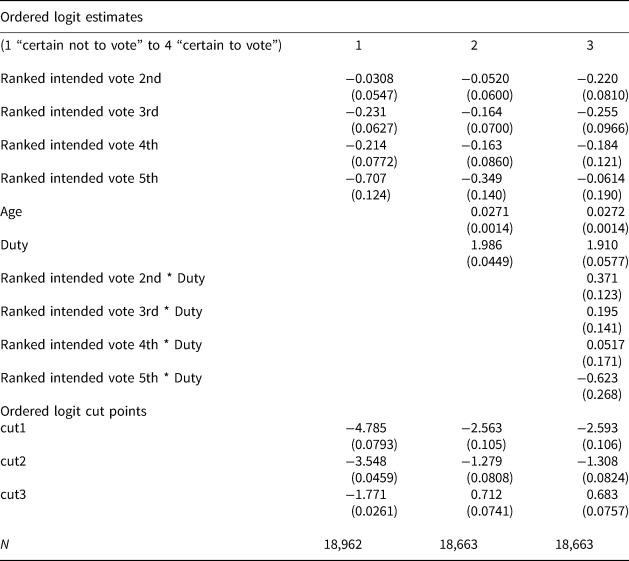
In Table 3 we present a formal statistical test of the differences visible in Figure 3. The estimation is by ordered logit where LV is the dependent variable and the local chances rank of the voter's preferred party enter as a series of dummy variables (estimates in Appendix Table A1).Footnote 6 Table 3 shows contrasts in predicted probabilities of the “certain to vote” response between categories of the preferred party chances ranking. It indicates that there are strongly significant differences for all contrasts of ranks except second versus first, as one would expect, and for fourth versus third.
Contrasts of Predicted Probabilities of “Certain to Vote” after Ordered Logit Estimation: LV as a function of binary categories of the local chances rank of the voter's preferred party (PP)

Local chances by party
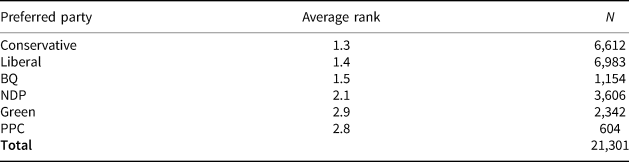
As we saw in Figures 1 and 2, a voter's likelihood of voting is related to their party choice. Table 4 puts party preference and local chances rank together to show the intermediate step. We use voters’ preferred party to increase the number of respondents available, given that vote intention was not asked of those who said they were certain not to vote. Voters’ estimates of their preferred party's relative local chances are, not surprisingly, unequally distributed across parties. In the aggregate, voters are quite accurately perceiving local competitiveness. Combined with the evidence that turnout (LV) is related to voters’ judgments of their preferred party's chances, the prima facie indication is that voters of certain parties are less likely to vote than others merely as a function of the relative unpopularity of that choice.
Average Chances Rank of Voter's Preferred Party

Source: 2019 Canadian Election Study, pre-campaign wave.
The number of affected voters
We estimate the total consequences of the effects observed above by calculating an estimated total number of voters who are moved from the “certain to vote” category to another category of the LV variable. We start by taking the total number of eligible voters in the 2019 Canadian federal election (25,939,742) and then multiply by the sum of each of the non-first-rank-of-PP proportions multiplied by the estimate associated with each rank for how much less likely voters whose PP has that rank are to vote as compared to those supporting first-rank parties (the 0.004, 0.031, 0.029, 0.111 entries in Table 3 above), which results in

199,580 voters who would be “certain to vote” if they were to give their party the best chance of winning, but who are, in fact, less than certain to vote simply because they rank their party second through fifth.Footnote 7 While this number is less than 1 per cent of eligible voters, it is equivalent to roughly the voting-eligible population of two federal ridings.
Objective measures of competitiveness
We now turn to corroborate the results so far with objective measures of competitiveness. Of voters who intended to vote for a party that had lost the riding in 2015, 82.5 per cent were certain to vote, compared with 85.7 per cent of those whose party had won the seat last time. (A t-test of this difference has a 95 per cent confidence interval of 2.3 per cent to 4.1 per cent.) This is a small difference, but we interpret this as potentially meaning that 3.2 per cent of the electorate were dissuaded from going to the polls simply because the party they prefer was likely not the best chance to win the current local race. And of course, this is almost certainly an underestimate of the true effect because of the biases we noted earlier.
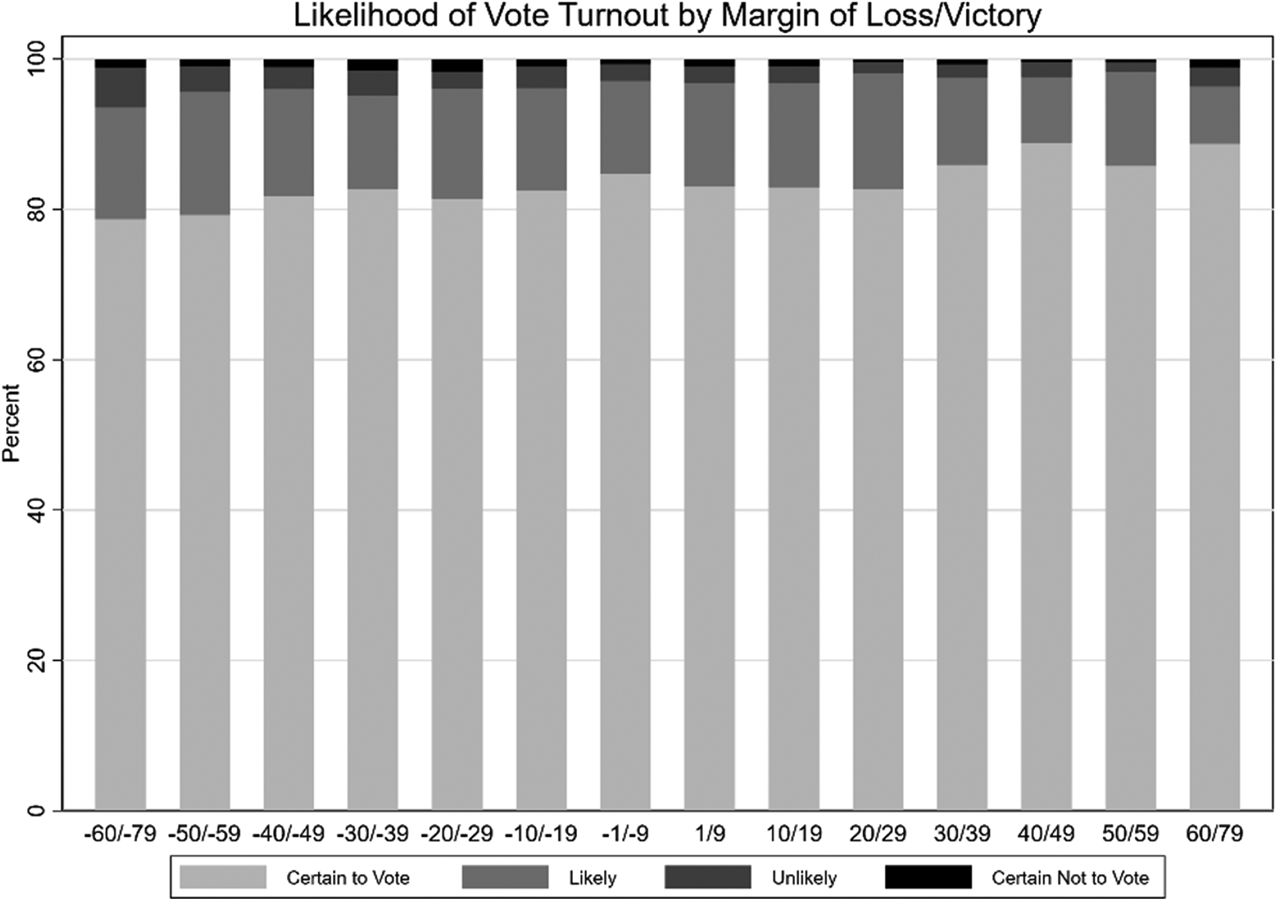
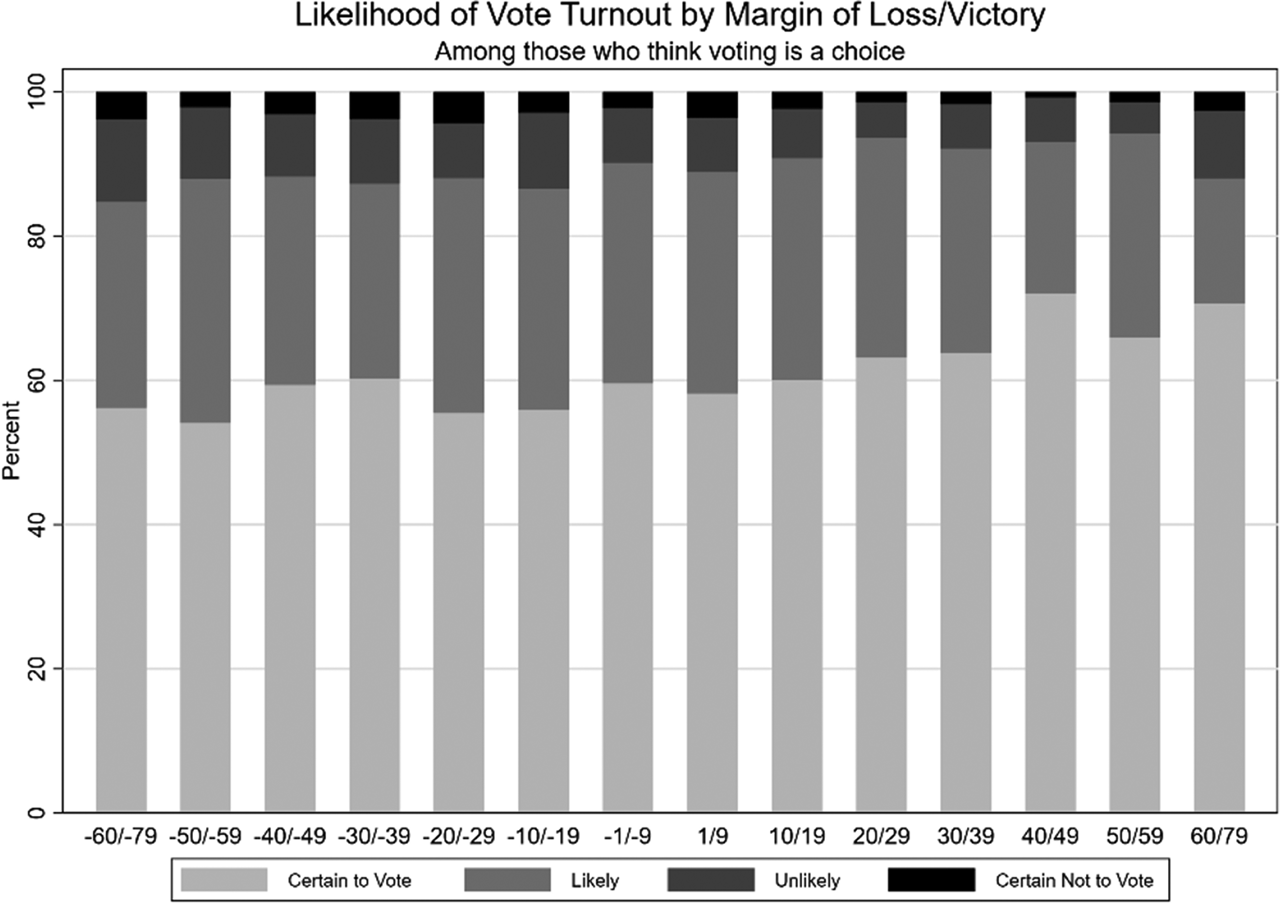
To see this in more detail, in Figure 4 we place voters in bins according to how the party they preferred in 2019 had done in 2015. The bins range from a loss of nearly 80 points (left side) to a victory with that same margin (right side). Losers by more than 70 points are Green Party supporters in Cape Breton–Canso or Red Deer–Mountain View; NDP and Conservative supporters in Bonavista–Burin–Trinity; and Liberals in Battle River–Crowfoot. The steady increase in the height of the light grey bars in Figure 4 from about 78 per cent to 85 per cent shows that voters whose party lost by a large margin were less likely to vote. Notably, the wasted vote effect appears to operate here only on those whose party lost. Figure 5 shows a much steeper gradient, as expected, among voting-is-a-choice voters.
Likelihood of Vote Turnout by Margin of Loss/Victory Source: 2019 Canadian Election Study, pre-campaign wave, N = 26,390. Note: The x-axis indicates margin of victory or loss (bands of 10, except outer bars).

Likelihood of Vote Turnout by Margin of Loss/Victory among Those Who Think Voting Is a Choice Source: 2019 Canadian Election Study, pre-campaign wave, N = 26,390. Note: The x-axis indicates margin of victory or loss (bands of 10, except outer bars).

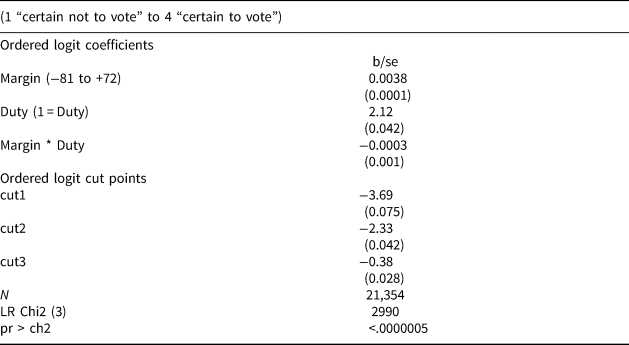
We test this relationship with an ordered logit model with an interaction to estimate effects among duty and choice voters separately. We find a significant effect whereby each additional (positive) 10 points on the margin of loss/victory pushes a voting-is-a-choice citizen out of the “certain to vote” category by nearly a full percentage point (0.92 points; see Appendix Table A2 for estimates).
Effects of competitiveness on strategic voting
We are concerned with strategic voting in this research note because we see it as the other of voters’ two possible responses to their preferred party being locally uncompetitive—that is, if they decide not to vote for that preferred party. While non-voting is probably of greater normative concern, casting a vote strategically is also suboptimal from a citizen's perspective, as it is surely less satisfying than voting one's first preference (Singh, Reference Singh2014).
For some voters, a rational response to Canada's FPTP system will be to desert their preferred party if it is not among the top two likely winners. For many duty-bound voters who realize their preferred party has no chance, this “holding-one's-nose” and voting for a second or third choice to defeat a much less-liked alternative is preferable to staying home.
It is natural to think that the Liberals and Conservatives are the least likely to be deserted by those who prefer them, but it is the local district where voters’ strategic decisions are located, and so it is theoretically possible that strategic voting could be distributed relatively evenly across supporters of all parties. It is worth showing, then, that the unequal distribution of the effect on turnout across parties is also visible in strategic voting.
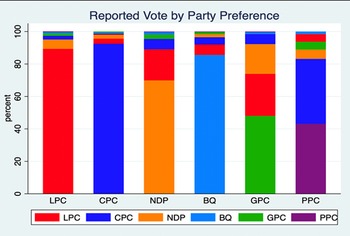
To set the table, we offer Figure 6, displaying the actual reported party vote broken down by our preferred party measure. We use the standard colours associated with each party. Recall that PP is based on respondents’ feelings about parties and their leaders, so there may be other influences on desertion of that party, including the local candidates and short-term policy dissatisfaction.
Reported Vote by Party Preference Source: 2019 Canadian Election Study, pre- and post-campaign wave, N = 6,054.

Supporters of the NDP, Green Party and PPC were much more likely than supporters of the two biggest parties to desert (30 per cent, 52 per cent and 57 per cent, respectively, versus 11 per cent, 8 per cent and 14 per cent for the LPC, CPC and BQ, respectively; all differences except BQ versus Liberal and PPC versus Green are significant at p < .05Footnote 8). This is not just a function of a crowding of parties on the left of the political spectrum, since Liberal voters seem to rarely desert their preferred party, and the highest rate of voters casting a vote at odds with their preference is among PPC supporters.
Table 5 gives the rate of strategic voting by party preference. Voters with particular party preferences (namely, the PPC, the Green Party and the NDP) are much more likely to go to the polls and mark a ballot for a party that is not their first choice. Collectively, supporters of these three parties represent 89 per cent of all strategic voters.
Strategic Voting by Party Preference

Source: 2019 Canadian Election Study, pre- and post-campaign wave.
When we tabulate the rate of strategic voting by the chances rank of each voter's preferred party, we find that 35 per cent, 45 per cent and 40 per cent of voters who rank their party's chances third, fourth and fifth, respectively, go on to desert their preferred party. Among voters who estimate the chances of their preferred party below second in the riding (approximately one in five respondents who had a preferred party and reported voting), a significant fraction (approximately 39 per cent) vote strategically.
Discussion
This research note adds depth and nuance to the widely acknowledged finding that the proportionality of the electoral system has an effect on voting turnout. In almost all of that work, the implicit normative criterion is overall turnout. That is, the burden of the dissuasive effect of the electoral system is treated as being borne by the polity as a whole rather than identifiable sets of voters. We show that in this Canadian election it is more specifically voters who held minority political (party) preferences in particular ridings who are more likely to stay away from the polls. We strongly believe this result will generalize to any FPTP system, as Gallego et al.'s aggregate evidence suggests (Reference Gallego, Rico and Anduiza2012).
Even though the election results would likely be unchanged if these dissuaded voters did turn out to vote and voted sincerely—because their parties almost never win their districts—the clear implication is that the official popular vote result exaggerates the leading parties’ actual support, for the two reasons we document. An important extension of the FPTP electoral system's famous “psychological effect” (Duverger, Reference Duverger1954) is evidently to punish certain parties and their perspectives by keeping some of their supporters from going to the polls at all. We provide individual-level evidence that accounts for findings from aggregate-level studies that find that in majoritarian systems, a significant number of individual voters are less satisfied with democracy than in proportional systems (see, for example, Anderson and Guillory, Reference Anderson and Guillory1997; Singh, Reference Singh2014). Our evidence suggests that this is because some voters’ votes are not as meaningful or effective as the votes of other citizens. Because citizens tend to live in particular places for extended periods, and both their preferences and patterns of electoral geography change only slowly, for a significant number of citizens, this is a life sentence: they are likely to feel deterred from voting over a long sequence of elections (Cutler and Hooper, Reference Cutler, Hooper, Johnston and Sharman2015).
Voters in Canada have a weaker intention to vote and engage more in strategic voting when they believe their preferred party is less likely to win a local seat. Plurality voting systems present deterrents to the full and sincere participation of voters, and these deterrents are unequally distributed, falling disproportionately on those voters who hold political perspectives that happen to be in a minority in their electoral district. This is not surprising, but it is significant, given the democratic system's goal of effective equality of electoral participation.
Appendix
Estimates of Likely Vote by Rank of Intended Vote Party

Estimates of Likely Vote by Margin of Victory / Loss of Preferred Party in 2015