Are anxiety symptoms in adolescence serious and persistent problems or normal and transient developmental phenomena? When looking into the existing literature, there appears to be support for both notions. Many studies indicate that adolescence is a period when anxiety is among the most prevalent forms of psychopathology (Merikangas et al., Reference Merikangas, He, Burstein, Swanson, Avenevoli and Cui2010) and can result in severe psychosocial problems (Bernstein & Victor, Reference Bernstein, Victor, Fatemi and Clayton2008). In addition to the high prevalence of anxiety symptoms in adolescence, a significant proportion of childhood anxiety symptoms and disorders appear to have a chronic course and last into adulthood (Bosquet & Egeland, Reference Bosquet and Egeland2006). However, anxiety symptoms are also part of normal child and adolescent development. As children and adolescents encounter new developmental tasks over the years, anxiety symptoms rise and fall. For example, recent research by Hale, Raaijmakers, Muris, Van Hoof, and Meeus (Reference Hale, Raaijmakers, Muris, Van Hoof and Meeus2008) and Van Oort, Greaves-Lord, Verhulst, Ormel, and Huizink (Reference Van Oort, Greaves-Lord, Verhulst, Ormel and Huizink2009) suggests that anxiety symptoms are relatively frequent in early adolescence but decrease into middle adolescence. It is therefore important to distinguish between more severe and persistent (i.e., pathological) adolescent anxiety symptoms and more normal and transient adolescent anxiety symptoms and to examine how different levels of anxiety symptoms are related to other adolescent psychosocial outcomes. This process of distinguishing between normal and pathological levels of adolescent anxiety symptoms can be facilitated by gaining more insight into the normal development of anxiety symptoms in the general population throughout adolescence.
Development of Adolescent Anxiety Disorder Symptoms
Drawing upon developmental theory, several models have been formulated that posit important age-related developmental changes in the expression of anxiety throughout childhood and adolescence (Warren & Sroufe, Reference Warren, Sroufe, Ollendick and March2004; Weems, Reference Weems2008; Westenberg, Siebelink, & Treffers, Reference Westenberg, Siebelink, Treffers, Silverman and Treffers2001). These models suggest that the predominant expression of anxiety is related to the normative developmental periods children and adolescents go through as well as to the developmental tasks they encounter over the years. Several studies have provided support for this notion (e.g., Weems & Costa, Reference Weems and Costa2005; Westenberg, Drewes, Siebelink, & Treffers, Reference Westenberg, Drewes, Siebelink and Treffers2004; Westenberg, Gullone, Bokhorst, Heyne, & King, Reference Westenberg, Gullone, Bokhorst, Heyne and King2007). For example, separation anxiety symptoms appear to predominate in childhood, whereas panic-related symptoms are most frequent in late adolescence and young adulthood. In addition, according to the concept of multifinality (Cicchetti & Rogosch, Reference Cicchetti and Rogosch1996, Reference Cicchetti and Rogosch2002), many complex interactions between the individual and biological, behavioral, cognitive, and social processes influence the specific developmental trajectories followed by individuals. These complex interactions also determine the specific anxiety symptom trajectories children and adolescents follow over the years. A common risk status may thus not necessarily result in the same maladaptive outcome for all individuals but may, for example, result in very different expressions of anxiety for different individuals.
Taken together, theory and empirical findings emphasize the importance of examining normative developmental changes in specific expressions of anxiety. However, longitudinal research into the normal development of different expressions of anxiety symptoms in adolescence is relatively scarce. Furthermore, the few longitudinal studies that have been conducted were mainly mixed longitudinal designs (i.e., following multiple cohorts over time) that only covered a limited age span during adolescence longitudinally as opposed to longitudinally studying the entire age span of adolescence. To our knowledge, only two longitudinal studies on the normal development of different expressions of adolescent anxiety symptoms have been conducted. In the first study, Hale et al. (Reference Hale, Raaijmakers, Muris, Van Hoof and Meeus2008) investigated the developmental trajectories of generalized anxiety disorder (GAD), panic disorder (PD), school anxiety (SA), separation anxiety disorder (SepAD), and social anxiety disorder (SAD) over 5 years in two cohorts of adolescents from the general population, aged 12 and 16 years, respectively, at the first time of measurement. In this study, a slight decrease in all anxiety symptoms was found, except for SAD symptoms, which remained fairly stable over time. In addition, almost no sex differences in developmental trajectories of different adolescent anxiety symptoms were found.
In the second study, Van Oort et al. (Reference Van Oort, Greaves-Lord, Verhulst, Ormel and Huizink2009) investigated developmental trajectories of GAD, obsessive–compulsive disorder, PD, SepAD, and SAD at three measurement occasions over 5 years in a community cohort aged 10 to 12 years at the first time of measurement. In this study, a slight decrease was found for all anxiety symptoms, followed by a leveling off of the decrease, and a subsequent slight increase in symptoms from middle adolescence (GAD, SepAD, and SAD) or late adolescence (obsessive–compulsive disorder and PD) onward. When these findings were adjusted for concurrent symptoms of major depressive disorder, there appeared to be no sex differences in developmental trajectories of the different adolescent anxiety symptoms.
A comparison of the results by Hale et al. (Reference Hale, Raaijmakers, Muris, Van Hoof and Meeus2008) and by Van Oort et al. (Reference Van Oort, Greaves-Lord, Verhulst, Ormel and Huizink2009) emphasizes “that findings on the developmental course of anxiety symptoms in the general population are still partly inconsistent, and therefore need further replication and exploration” (Van Oort et al., Reference Van Oort, Greaves-Lord, Verhulst, Ormel and Huizink2009, p. 1214). Hence, the first aim of the present study was to add to the existing literature by further examining the normal development of specific expressions of anxiety throughout the entire adolescent years. We specifically examined the normal development of five anxiety disorder symptom dimensions in adolescents from the general population in a prospective longitudinal design with annual measurements covering early to late adolescence (i.e., ages ~12–19). Four of the five anxiety symptom dimensions in this study are directly related to the anxiety disorders described in DSM-IV-TR, namely, symptoms of GAD (best described by excessive worrying), PD (best described by unexpected and intense fear of catastrophe), SepAD (best described by fear regarding separation from home or significant persons), and SAD (best described by social evaluation fear). The fifth anxiety symptom dimension we examined is or school refusal or SA (best described by school-related anxiety and stress), which is not a DSM-IV-TR anxiety disorder but is a serious problem in childhood and adolescence with various negative short-term and long-term consequences on children's and adolescents’ social, emotional, and educational development (Fremont, Reference Fremont2003; for a systematic review, see King & Bernstein, Reference King and Bernstein2001). We used an adolescent community sample in order to assess the normal development of these anxiety disorder symptoms, because the normal developmental course of adolescent anxiety symptoms may be better reflected by studies in the general community than by clinical samples, which is due to a potential referral bias in clinical samples that may limit the generalizability of research findings to the normal population (Hale, Raaijmakers, Muris, & Meeus, Reference Hale, Raaijmakers, Muris and Meeus2005).
Although the present study consists of a subsample of the study by Hale et al. (Reference Hale, Raaijmakers, Muris, Van Hoof and Meeus2008), a cohort of Dutch early adolescents, it differs in important ways from the 5-year longitudinal study by Hale et al. (Reference Hale, Raaijmakers, Muris, Van Hoof and Meeus2008). First, this study longitudinally covers the entire age span of adolescence by longitudinally following one cohort of early adolescents for 8 successive years in a prospective longitudinal design with annual measurements. Second, the additional 3 years covered in this study allow for a more detailed examination of nonlinear development. Third, in this study we not only focused on the normal development of anxiety disorder symptoms but also examined the concurrent development of different psychosocial correlates of anxiety (a point we will return to shortly when describing the third aim of this study). This study is thereby the first to longitudinally examine the aforementioned anxiety symptoms in a prospective, longitudinal design covering the full age range of adolescence (i.e., from early adolescence to late adolescence) by prospectively following adolescents for 8 successive years. This study extends previous findings on the normal development of anxiety disorder symptoms and advances our understanding of normal developmental changes in the expression of anxiety throughout the entire adolescent years. Nuances in the normal development of adolescent anxiety disorder symptoms are vital to researchers and psychotherapists alike to facilitate a distinction between normal and more pathological adolescent anxiety disorder symptoms.
Developmental theory on age-related developmental changes in the expression of anxiety throughout childhood and adolescence (Warren & Sroufe, Reference Warren, Sroufe, Ollendick and March2004; Weems, Reference Weems2008; Westenberg et al., Reference Westenberg, Siebelink, Treffers, Silverman and Treffers2001) and previous cross-sectional (e.g., Weems & Costa, Reference Weems and Costa2005) and longitudinal studies (Hale et al., Reference Hale, Raaijmakers, Muris, Van Hoof and Meeus2008; Van Oort et al., Reference Van Oort, Greaves-Lord, Verhulst, Ormel and Huizink2009) have suggested that SA and SepAD symptoms decrease throughout adolescence and that GAD and PD symptoms increase during adolescence. These theories and empirical findings led us to formulate the following hypotheses regarding the normal development of anxiety disorder symptoms: (a) GAD symptoms will increase from early/middle adolescence onward, (b) PD symptoms will increase from middle/late adolescence onward, (c) SA symptoms will decrease through adolescence, and (d) SepAD symptoms will decrease through adolescence. Because of an apparent discrepancy between theoretical expectations (SAD symptoms will peak in middle adolescence; e.g., Warren & Sroufe, Reference Warren, Sroufe, Ollendick and March2004; Westenberg et al., Reference Westenberg, Siebelink, Treffers, Silverman and Treffers2001) and research findings (SAD symptoms remain fairly stable or decrease from early to middle adolescence; e.g., Hale et al., Reference Hale, Raaijmakers, Muris, Van Hoof and Meeus2008; Van Oort et al., Reference Van Oort, Greaves-Lord, Verhulst, Ormel and Huizink2009), no hypothesis for the normal development of SAD was formulated.
Furthermore, sex differences in the normal development of adolescent anxiety disorder symptoms were examined. Although many studies suggest higher mean levels of anxiety disorder symptoms in adolescent girls compared to boys (Lewinsohn, Lewinsohn, Gotlib, Seeley, & Allen, Reference Lewinsohn, Lewinsohn, Gotlib, Seeley and Allen1998; for a systematic review, see McLean & Anderson, Reference McLean and Anderson2009), the two longitudinal studies by Hale et al. (Reference Hale, Raaijmakers, Muris, Van Hoof and Meeus2008) and Van Oort et al. (Reference Van Oort, Greaves-Lord, Verhulst, Ormel and Huizink2009) seem to suggest only small differences between adolescent boys and girls in developmental trajectories of anxiety disorder symptoms. In this study, we further examined potential sex differences in developmental trajectories of anxiety disorder symptoms. If we were to find sex differences, we expected higher levels of anxiety disorder symptoms over time for adolescent girls compared to boys, based upon the aforementioned studies.
Heterogeneity in Development of Adolescent Anxiety Disorder Symptoms
A logical continuation after examining normal developmental trajectories of anxiety disorder symptoms in adolescence is to examine the natural occurrence of different groups of adolescents following different developmental trajectories of anxiety disorder symptoms. Differences between more severe and persistent (i.e., pathological) adolescent anxiety symptoms and more normal and transient adolescent anxiety symptoms have traditionally been made by using arbitrary cutoff scores, such as labeling the top 5% or top 10% of the sample as at risk or clinical. However, modern statistical techniques, such as latent class growth analysis (LCGA; Reinecke, Reference Reinecke2006), allow for a more sophisticated and person-centered grouping of adolescents using a longitudinal approach by distinguishing between different groups of adolescents with different developmental trajectories over time. Therefore, the second aim of this study was to examine whether we can empirically distinguish between different groups of adolescents with different developmental trajectories of anxiety disorder symptoms (i.e., distinguish between adolescents in the severity and persistence of anxiety disorder symptoms over time) using LCGA.
With regard to the second aim of this study, little research on anxiety has yet been conducted using LCGAs, and we are not aware of any adolescent anxiety disorder symptom studies that have employed this approach. This study is thus the first to examine distinctions between groups of adolescents with regard to the severity and persistence of specific anxiety disorder symptoms by means of LCGAs. Research in this area is vital because identifying groups of adolescents with different developmental trajectories of anxiety disorder symptoms is important not only with regard to adolescents’ anxiety disorder symptom development but also with regard to other important areas of psychosocial development (a point we will return to shortly when describing the third aim of this study).
The few studies that did employ LCGA, or closely related statistical techniques, in relation to anxiety distinguished between groups of individuals with different developmental trajectories of general adolescent anxiety symptoms (e.g., Crocetti, Klimstra, Keijsers, Hale, & Meeus, Reference Crocetti, Klimstra, Keijsers, Hale and Meeus2009), internalizing symptoms (e.g., Colman, Ploubidis, Wadsworth, Jones, & Croudace, Reference Colman, Ploubidis, Wadsworth, Jones and Croudace2007; Côté et al., Reference Côté, Boivin, Liu, Nagin, Zoccolillo and Tremblay2009), and in age ranges other than adolescence (i.e., childhood or adulthood; e.g., Duchesne, Larose, Vitaro, & Tremblay, Reference Duchesne, Larose, Vitaro and Tremblay2010; Feng, Shaw, & Silk, Reference Feng, Shaw and Silk2008). These studies all suggest heterogeneity (i.e., different groups of individuals) in developmental trajectories. This is in line with theoretical hypotheses on the existence of distinct groups of youth with respect to anxiety symptom development (Weems, Reference Weems2008).
Although the above-mentioned studies differ largely in their research focus, methodology, and analysis strategies, two different developmental profiles have consistently been found: one normal (or low-anxiety) developmental profile followed by the vast majority of individuals, characterized by relatively stable, low-severity anxiety symptoms, and one at-risk developmental profile, characterized by relatively stable, high-severity anxiety symptoms (for a systematic review, see Nandi, Beard, & Galea, Reference Nandi, Beard and Galea2009). We anticipate finding a distinction between the majority of adolescents in which anxiety disorder symptoms represent a transient developmental phenomena (i.e., normal developmental profile), and a minority of adolescents with more severe and persistent anxiety disorder symptoms (i.e., at-risk developmental profile) for all five anxiety disorder symptom dimensions in our study. Such a distinction would also be in line with theoretical hypotheses on the existence of distinct groups of youth with respect to anxiety symptom development (Weems, Reference Weems2008).
Heterogeneity in Development of Anxiety Disorder Symptoms and Psychosocial Development
Obtaining normal and at-risk groups of adolescents with distinct developmental trajectories of anxiety disorder symptoms would naturally raise the question of whether these groups are theoretically valid. For example, do adolescents in the at-risk groups differ from adolescents in the normal groups in psychosocial developmental outcomes in accordance with theory and previous research findings? As previously noted, identifying groups of adolescents with different developmental trajectories of anxiety disorder symptoms is important not only with regard to adolescents’ anxiety disorder symptom development but also with regard to other areas of psychosocial development. Many existing studies suggest that anxiety is highly related to several important areas of adolescent development, such as peer interactions and social adjustment (for a systematic review, see Kingery, Erdley, Marshall, Whitaker, & Reuter, Reference Kingery, Erdley, Marshall, Whitaker and Reuter2010), the parent–child relationship (for a systematic review, see Bögels & Brechman-Toussaint, Reference Bögels and Brechman-Toussaint2006; for a meta-analysis, see McLeod, Wood, & Weisz, Reference McLeod, Wood and Weisz2007), identity development (e.g., Crocetti et al., Reference Crocetti, Klimstra, Keijsers, Hale and Meeus2009), and personality development (e.g., Meeus, Van de Schoot, Klimstra, & Branje, Reference Meeus, Van de Schoot, Klimstra and Branje2011). Thus, adolescents with different developmental trajectories of anxiety disorder symptoms likely show meaningful differences in these areas of psychosocial development. Furthermore, some areas of psychosocial development may be specifically related to one anxiety disorder symptom dimension more than to others (i.e., discriminant validity).
Therefore, the third aim of this study was to examine how adolescents in the normal and at-risk developmental profiles of distinct anxiety disorder symptoms differ in the concurrent development of various important psychosocial outcomes in adolescence (i.e., overlapping development). The areas of psychosocial development we focused on are in respect to personality (in this study measured by neuroticism), substance use (in this study measured by cannabis initiation), parenting (in this study measured by adolescent-perceived maternal support), and identity (in this study measured by school commitment). We will now discuss each of these domains of psychosocial development in more detail.
Anxiety disorder symptoms and personality
With respect to the association between adolescent anxiety disorder symptoms and personality, the personality trait of neuroticism is a natural choice, because neuroticism (sometimes referred to as negative affectivity) appears to be a common dimension in all anxiety disorder symptoms (e.g., Watson, Reference Watson1999; Weinstock & Whisman, Reference Weinstock and Whisman2006). Higher levels of anxiety are related to higher levels of neuroticism and vice versa (Jylhä & Isometsä, Reference Jylhä and Isometsä2006; Muris, De Jong, & Engelen, Reference Muris, De Jong and Engelen2004). However, a recent study has demonstrated that although neuroticism and adolescent anxiety symptoms (in the case of this study, GAD) are strongly interrelated, they do represent distinct entities (Hale, Klimstra, & Meeus, Reference Hale, Klimstra and Meeus2010).
Therefore, groups of adolescents with distinct developmental trajectories of anxiety disorder symptoms will likely report different levels of neuroticism. In line with previous research findings that suggest a positive relationship between anxiety and neuroticism, we expect adolescents in the at-risk developmental profiles to report significantly higher levels of neuroticism throughout adolescence compared to adolescents in the normal developmental profiles. This overlapping development would be an important indication that any of the normal and at-risk developmental profiles identified in this study with LCGA are psychologically valid.
Anxiety disorder symptoms and substance use
Many studies have focused on the relationship between anxiety and adolescent substance use, with mixed results. Some studies suggest that anxiety is a risk factor, with anxious adolescents engaging in earlier and heavier substance use than nonanxious adolescents, for example, because of self-medication (for a systematic review, see Khantzian, Reference Khantzian1997). Other studies, however, suggest that anxiety may protect against early adolescent substance use because feelings of anxiety may inhibit adolescents from engaging in risky behaviors, such as experimenting with substance use (Shedler & Block, Reference Shedler and Block1990; Siebenbruner, Englund, Egeland, & Hudson, Reference Siebenbruner, Englund, Egeland and Hudson2006).
In this study, we focused specifically on the relationship between anxiety disorder symptoms and adolescent cannabis initiation (i.e., adolescents’ first experience with cannabis use) to examine whether adolescents following at-risk profiles compared to normal developmental profiles of anxiety disorder symptoms differ in cannabis initiation. Research on adolescent cannabis initiation is important, because cannabis initiation is nearly absent before adolescence but steeply increases during adolescence (Kosterman, Hawkins, Guo, Catalano, & Abbott, Reference Kosterman, Hawkins, Guo, Catalano and Abbott2000). In addition, cannabis is believed to be adolescents’ first contact with illicit drugs and is believed to be an important precursor for other drug use (i.e., the gateway hypothesis; e.g., Fergusson, Boden, & Horwood, Reference Fergusson, Boden and Horwood2006). Furthermore, cannabis initiation appears to be part of normal adolescent exploration and experimentation behavior and engagement in adolescent risk behavior, and it happens most often within the peer context and, thus, also contains elements of positive peer interaction and social adjustment (Engels & Ter Bogt, Reference Engels and Ter Bogt2001; Griffith-Lendering et al., Reference Griffith-Lendering, Huijbregts, Huizink, Ormel, Verhulst and Vollebergh2011; Steinberg, Reference Steinberg2004, Reference Steinberg2007).
Some previous research suggests that SAD is the only anxiety disorder symptom related to cannabis use (e.g., Buckner et al., Reference Buckner, Schmidt, Lang, Small, Schlauch and Lewinsohn2008), thereby suggesting a discriminant relationship between SAD and cannabis use. The specific relation between SAD and cannabis initiation likely exists because first contact and experimentation with cannabis tends to occur in the social context (e.g., Oetting & Beauvais, Reference Oetting and Beauvais1986; Steinberg, Reference Steinberg2004). SAD symptoms could work in two opposite ways to influence cannabis initiation in adolescents: according to the self-medication perspective, in which anxiety is considered to be a risk factor for cannabis initiation, adolescents suffering from SAD symptoms may attempt to cope with social anxiety reactions and relieve their symptoms by using cannabis, believing that the use of cannabis will make it easier to interact with peers (Buckner, Schmidt, Bobadilla, & Taylor, Reference Buckner, Schmidt, Bobadilla and Taylor2006; Khantzian, Reference Khantzian1997). In contrast, from a buffer perspective, in which anxiety is considered to protect against cannabis initiation, SAD symptoms may limit social contact and thereby the availability of cannabis to anxious adolescents and the availability for experimentation with cannabis (Myers, Tomlinson, Aarons, & Stein, Reference Myers, Tomlinson, Aarons and Stein2003; Shedler & Block, Reference Shedler and Block1990; Siebenbruner et al., Reference Siebenbruner, Englund, Egeland and Hudson2006).
This study is the first to examine the relation between anxiety and cannabis initiation from the point of adolescents’ anxiety disorder symptom development. Because of previously mentioned mixed results regarding the relation between SAD and cannabis use, we have no specific hypothesis whether adolescents in the at-risk SAD developmental profile have earlier or later cannabis initiation compared to adolescents in the normal SAD developmental profile. In addition, we explored the relationship between the normal and at-risk developmental profiles of the other anxiety disorder symptom dimensions and cannabis initiation.
Anxiety disorder symptoms and parenting
Although parenting is a multidimensional concept, there is overall consensus that parental support is one of the two key dimensions of parenting related to adolescent problem behavior, with the other dimension being parental control (e.g., Baumrind, Reference Baumrind, Lerner, Petersen and Brooks-Gunn1991). The key dimension of parental support encompasses a variety of positively related parenting phenomena, such as responsiveness, warmth, and acceptance. Parental rejection, the opposite of parental support (McLeod et al., Reference McLeod, Wood and Weisz2007), has also received a lot of attention in the study of parenting and adolescent problem behavior. Research findings regarding the relationship between parental support and child anxiety are inconsistent and suggest only a weak association (for a meta-analysis, see McLeod et al., Reference McLeod, Wood and Weisz2007). However, almost no studies have focused on the relationship between parental support and specific adolescent anxiety disorder symptoms. This is important because, although anxiety as a general construct may appear to be only weakly related to parental support, this relationship may be different for specific anxiety disorder symptoms (i.e., discriminant validity) because of the distinct features of different anxiety disorder symptoms. For example, symptoms of SepAD, which are inherently interpersonal in nature, may have a stronger association with parental support (see ensuing discussion below), than the more physiological symptoms of PD. We therefore examined whether adolescents in the normal and at-risk developmental profiles of the five anxiety disorder symptoms differed in their overlapping developmental trajectories of adolescent-perceived maternal support (i.e., adolescents’ perception of mother as available for support when needed; Branje, Hale, & Meeus, Reference Branje, Hale, Meeus, Kerr, Stattin and Engels2008). We focused on maternal support because mothers are traditionally the primary caregiver with whom children have the strongest emotional connection.
With regard to specific anxiety disorder symptoms, adolescent symptoms of SepAD are particularly likely to be related to perceived maternal support, because SepAD symptoms are characterized by anxiety regarding separation from or harm to an individual to whom the adolescent has a strong emotional attachment, most often the mother, accompanied by an excessive need for closeness with and support from this individual. In addition, the components of responsiveness, warmth, and acceptance, which are part of the concept of maternal support, have a clear relationship with parental attachment. This relationship becomes especially evident when we define attachment as the perception and experience of availability and accessibility of the primary caregiver in the role of comforter and protector (Bögels & Brechman-Toussaint, Reference Bögels and Brechman-Toussaint2006). Parental attachment is, in turn, an important part of SepAD symptoms, suggesting a likely relationship between adolescent symptoms of SepAD and perceived maternal support.
Because of the aforementioned relationship between maternal support, attachment, and SepAD symptoms, we expected higher levels of adolescent-perceived maternal support over time by adolescents in the at-risk SepAD group compared to adolescents in the normal SepAD group. In addition, we explored the relationship between developmental profiles of the other anxiety disorder symptom dimensions and their overlapping development with adolescent-perceived maternal support.
Anxiety disorder symptoms and identity
Identity development is one of the major developmental tasks during adolescence. In this study, we focused on the relationship between specific anxiety disorder symptoms and identity formation in the educational/school domain, because this domain is a crucial part of the adolescent's life. In all Western countries, adolescents are obliged by law to receive an education during adolescence. This makes education a large contributor to the adolescent's social world, and education-related development going awry can have a serious, negative impact on adolescent psychosocial functioning (e.g., peer relationships, employment success, and mental health; Egger, Costello, & Angold, Reference Egger, Costello and Angold2003; for a systematic review, see Kearney, Reference Kearney2008). In identity theory (e.g., Crocetti, Rubini, & Meeus, Reference Crocetti, Rubini and Meeus2008), commitment is considered to be a fundamental aspect of adolescent identity formation, and school commitment during the adolescent years would appear to be an especially salient aspect of healthy adolescent psychosocial functioning. Previous research by Crocetti et al. (Reference Crocetti, Klimstra, Keijsers, Hale and Meeus2009) found that high-anxiety adolescents reported a decrease in commitment over time, whereas their low-anxiety peers displayed an increase in commitment over time, suggesting that anxiety symptoms may interfere with the process of identity formation.
School commitment is especially likely to be affected by symptoms of SA (suggesting a discriminant relationship between SA and school commitment), because SA symptoms are characterized by anxiety toward attending school and school-related stress that likely interferes with strong feelings of affiliation, engagement, and commitment to school. Therefore, we expected adolescents in the at-risk SA developmental profile to report lower school commitment over time than do adolescents in the normal SA developmental profile. In addition, we explored the relationship between developmental profiles of the other anxiety disorder symptom dimensions and their overlapping development with school commitment.
Method
Participants
Participants in this 8-year longitudinal study were 239 early adolescents (46% boys) from the general population, with a mean age of 12.7 years (SD = 0.41, range = 11–14 years) at the start of the study. All adolescents identified themselves as being ethnic Dutch. At the start of the study, participants attended various secondary schools in the province of Utrecht, The Netherlands. Approximately 54% of the adolescents were attending schools that were preparing them for university, 29% of the adolescents were attending schools that were preparing them for higher professional education, and 17% of the adolescents were attending schools that were preparing them for secondary vocational education.
Data for this study are part of the family sample of Conflict and Management of Relationships (CONAMORE; Meeus et al., Reference Meeus, Akse, Branje, Ter Bogt, Crommelin and Delsing2005), a larger, ongoing longitudinal study on adolescent relationships with parents and friends. Participants of the CONAMORE family study were invited to continue participation in a successive longitudinal study called Research on Adolescent Development and Relationships (RADAR). Two hundred thirty-nine families (75% of the CONAMORE family sample) agreed to continue participation in RADAR. For the present study, we decided to include only families that agreed to participate in both the CONAMORE and RADAR longitudinal studies in the analyses (N = 239). The researched group (n = 239) did not significantly differ from those who did not agree to further participate in the longitudinal study RADAR after CONAMORE (n = 80) in terms of gender, χ2 (1) = 3.39, p = .07, Cramer V = 0.10, or adolescents’ age and anxiety disorder symptoms, F (6, 311) = 0.32, p = .93, η2 = 0.01. For this study, only data from the adolescent participants were used.
Sample attrition was 6.3% after eight annual waves, with 224 of the 239 adolescents still participating at the last measurement wave. Incidental missing item values were estimated in SPSS, using expectation maximization. Remaining missing data was estimated in Mplus Version 6, using the full information maximum likelihood procedure (Muthén & Muthén, Reference Muthén and Muthén1998–2010).
Procedures
Before the start of the study, participants and their parents received written information and provided written informed consent. Participants completed all self-report measures during a home visit. Adolescents received €10 (approximately US $13) as a reward for every wave they participated in. This study and its assent and consent documents were approved by the board of the local research institute.
Measures
Anxiety disorder symptoms
Anxiety disorder symptoms were measured by the Dutch version of the original 38-item Screen for Child Anxiety Related Emotional Disorders (SCARED; Birmaher et al., Reference Birmaher, Khetarpal, Brent, Cully, Balach and Kaufman1997; Hale et al., Reference Hale, Raaijmakers, Muris and Meeus2005). The SCARED is a self-report questionnaire that measures five anxiety disorder symptom dimensions in children and adolescents. GAD, PD, SepAD, and SAD symptoms are directly related to the anxiety disorders in the DSM-IV-TR. In addition, the SCARED measures SA symptoms, which are a serious problem in childhood and adolescence with various negative short-term and long-term consequences on children's and adolescents’ social, emotional, and educational development (Fremont, Reference Fremont2003; for a systematic review, see King & Bernstein, Reference King and Bernstein2001). Internal consistency for the five anxiety disorder symptom dimensions were found to be acceptable to good across all waves, with Cronbach α values between 0.82 and 0.89 for GAD, between 0.79 and 0.87 for PD, between 0.61 and 0.71 for SA, between 0.61 and 0.77 for SepAD, and between 0.78 and 0.90 for SAD. Psychometric properties of the SCARED have shown to be good in several studies (Birmaher et al., Reference Birmaher, Khetarpal, Brent, Cully, Balach and Kaufman1997, Reference Birmaher, Brent, Chiappetta, Bridge, Monga and Baugher1999; Hale et al., Reference Hale, Raaijmakers, Muris and Meeus2005; for a meta-analysis on the psychometric properties of the SCARED, see Hale, Crocetti, Raaijmakers, & Meeus, Reference Hale, Crocetti, Raaijmakers and Meeus2011).
Neuroticism
The six-item neuroticism scale of the Quick Big Five (Vermulst & Gerris, Reference Vermulst and Gerris2005) was used in this study to measure neuroticism. The Quick Big Five is a self-report questionnaire in which adolescents rate themselves on six adjectives (anxious, fearful, fretful, high-strung, irritable, and nervous) using a 7-point Likert scale (1 = completely untrue, 7 = completely true). Previous studies have demonstrated that this measure provides a valid and reliable estimate of adolescent neuroticism (e.g., Branje, Van Lieshout, & Van Aken, Reference Branje, Van Lieshout and Van Aken2004; Klimstra, Hale, Raaijmakers, Branje, & Meeus, Reference Klimstra, Hale, Raaijmakers, Branje and Meeus2009). In the present study, internal consistency was found to be good across all waves, with the Cronbach αs between 0.79 and 0.88.
Cannabis initiation
One item was used to measure adolescents’ cannabis initiation: “In the past 12 months, how often have you used weed, marihuana or hashish?” For analytic purposes, this item was dichotomized into 0 (never used in the past 12 months) and 1 (used at least once in the past 12 months). The first year in which adolescents reported having used cannabis at least once was taken as the year of adolescents’ cannabis initiation.
Adolescent-perceived maternal support
The eight-item support subscale of the shortened version of the Network of Relationships Inventory (NRI; Furman & Buhrmester, Reference Furman and Buhrmester1985) was used in this study to measure adolescent-perceived maternal support. The NRI is a self-report questionnaire, with items scored on a 5-point scale from 1 (little or none) to 5 (the most). Sample items of the support subscale are “How much does your mother really care about you?” and “Does your mother like or approve of the things you do?” In the present study, internal consistency was found to be good across all waves, with Cronbach αs between 0.77 and 0.84.
School commitment
The five-item school commitment subscale of the Utrecht-Management of Identity Commitments Scale (U-MICS; Crocetti et al., Reference Crocetti, Rubini and Meeus2008; Meeus, Reference Meeus2001) was used to measure school commitment. The U-MICS is a self-report questionnaire, with items scored on a 5-point scale from 1 (completely untrue) to 5 (completely true). A sample item of the school commitment subscale is “My education gives me certainty in life.” The school commitment subscale has proven good concurrent validity (e.g., Crocetti, Schwartz, Fermani, & Meeus, Reference Crocetti, Schwartz, Fermani and Meeus2010). In the present study, internal consistency was found to be good across all waves, with Cronbach αs between 0.90 and 0.95.
Statistical analyses
Development of adolescent anxiety disorder symptoms
Developmental trajectories of adolescent anxiety disorder symptoms were examined using latent growth modeling (LGM; Kline, Reference Kline2005) within Mplus Version 6.0 (Muthén & Muthén, Reference Muthén and Muthén1998–2010). Maximum likelihood estimation with standard errors and chi square robust to nonnormality was used (maximum likelihood robust estimator). In LGM, development is represented by latent factors: an intercept factor (i.e., mean initial level of anxiety disorder symptoms) and one or more slope factors (i.e., mean change in anxiety disorder symptoms over time). LGMs are person centered and capture individual differences in developmental trajectories by including variances for the latent factors (i.e., the intercept and slope factors). In this study, mean levels of adolescent anxiety disorder symptoms at each wave were used as indicators to estimate the latent intercept and slope factors in LGM. Because there were eight repeated (annual) measurements, we were able to examine linear and nonlinear growth functions (i.e., quadratic and cubic growth).
We decided on the best fitting growth model for each of the five anxiety disorder symptom dimensions based upon several goodness of fit indices (Kline, Reference Kline2005): the comparative fit index (CFI), with values >0.90 being indicative of a satisfactory fit and values >0.95 indicating a good fit; the root mean square error of approximation (RMSEA), with values of ≤0.08 indicating an acceptable fit and values of ≤0.05 indicating a good fit; and the 90% confidence interval (CI) of the RMSEA. The comparative fit of models with different growth factors (i.e., linear, quadratic, and cubic growth) was tested with the Satorra–Bentler scaled chi-square difference test (Satorra & Bentler, Reference Satorra and Bentler2001).
Subsequently, sex differences in developmental trajectories of adolescent anxiety disorder symptoms were examined using multigroup LGM analyses. We first tested whether the same LGM model (i.e., model with the same growth factors) fitted the data for boys and girls separately, because comparisons across groups should not be made if the same LGM model does not apply for all groups. Next, we tested a fully unconstrained model, allowing differences between boys and girls in all growth parameters (intercept means, slopes means, and [co]variances), against a fully constrained model, allowing no differences between boys and girls in these growth parameters.Footnote 1 Significant differences in model fit were tested using Satorra–Bentler scaled chi-square difference tests (Satorra & Bentler, Reference Satorra and Bentler2001).
Heterogeneity in development of adolescent anxiety disorder symptoms
LCGA was used (Nagin, Reference Nagin2005; Reinecke, Reference Reinecke2006) to identify subgroups of adolescents with different developmental trajectories of anxiety disorder symptoms. Statistical techniques like LCGA “have been increasingly recognized for their usefulness for identifying homogeneous subpopulations within the larger heterogeneous population and for the identification of meaningful groups or classes of individuals” (Jung & Wickrama, Reference Jung and Wickrama2008, p. 302). LGM considers individual variation around one single developmental trajectory of a particular anxiety disorder symptom dimension, but LCGA examines the probability that individual variation can be captured in relatively homogenous subgroups of adolescents with different developmental trajectories of a particular anxiety disorder symptom dimension. Within groups, adolescents are treated as homogenous with respect to their development, because LCGA allows no individual variation (i.e., variance) in growth parameters (Reinecke, Reference Reinecke2006). LCGA makes it possible to look for naturally present groups of adolescents with different developmental trajectories of a particular anxiety disorder symptom dimension, without specifying a priori hypotheses about these groups.
We used five criteria to determine the number of groups within each anxiety disorder symptom dimension (Jung & Wickrama, Reference Jung and Wickrama2008; Nagin, Reference Nagin2005). First, adding an additional group should result in an improvement of model fit. A decrease in the sample-size adjusted Bayesian information criterion (Sclove, Reference Sclove1987) is indicative of this. Second, entropy, a standardized measure of classification quality (Kline, Reference Kline2005), should be acceptable. Entropy values range from 0 to 1, with values of 0.75 or higher indicating good classification accuracy (Reinecke, Reference Reinecke2006). Third, adding an additional group should result in an improvement of model fit, indicated by the adjusted Lo–Mendell–Rubin likelihood ratio test (Lo, Mendell, & Rubin, Reference Lo, Mendell and Rubin2001). A significant adjusted Lo–Mendell–Rubin likelihood ratio test p value (p < .05) indicates better fit of a model with an additional group compared to a model without this additional group. Fourth, we evaluated the interpretability of the groups. If an additional group was found to be a slight variation of a group already found in a lower class solution, we chose the most parsimonious model. Fifth, every group had to cover at least 5% of the sample for meaningful interpretation and further analysis. This model selection procedure resulted in a best-fitting class model for each anxiety disorder symptom dimension, with adequate sample sizes for subsequent analysis.
Heterogeneity in development of anxiety disorder symptoms and psychosocial development
For all areas of psychosocial development, we used longitudinal data from the same eight waves we used in our research questions on the (heterogeneity in) development of distinct anxiety disorder symptom dimensions. We used Cox regression survival analysis in SPSS 16.0 (Tabachnick & Fidell, Reference Tabachnick, Fidell, Tabachnick and Fidell2007) to examine whether the developmental profiles resulting from LCGA were differently related to adolescent cannabis initiation. This analysis technique takes into account that a number of respondents will start using cannabis for the first time before the first and after the final measurement wave of this study (i.e., censored cases). Because previous studies have reported sex differences in adolescents’ cannabis initiation (e.g., Kosterman et al., Reference Kosterman, Hawkins, Guo, Catalano and Abbott2000; Poikolainen et al., Reference Poikolainen, Tuulio-Henriksson, Aalto-Setälä, Marttunen, Anttila and Lönnqvist2001), we included sex as a covariate in the survival analyses.
Multigroup LGM analyses were used to examine the association between the different developmental profiles of the anxiety disorder symptoms resulting from LCGA and their overlapping development with neuroticism, adolescent-perceived maternal support, and school commitment during these 8 years. We used a similar analysis approach as with the multigroup LGM testing for sex differences described above, with the developmental profiles resulting from LCGA as grouping variables instead of sex.
Results
Descriptive statistics
Rank-order stability was moderate to high for the different anxiety disorder symptoms. Specifically, correlations between successive waves ranged from .43 to .75 for GAD, from .38 to .67 for PD, from .34 to .52 for SA, from .37 to .64 for SepAD, and from .43 to .74 for SAD. Within-wave correlations between the different anxiety disorder symptoms ranged from .32 to .64 at Time 1, from .39 to .59 at Time 2, from .32 to .58 at Time 3, from .34 to .63 at Time 4, from .31 to .55 at Time 5, from .28 to .64 at Time 6, from .29 to .59 at Time 7, and from .25 to .56 at Time 8.Footnote 2
Development of adolescent anxiety disorder symptoms
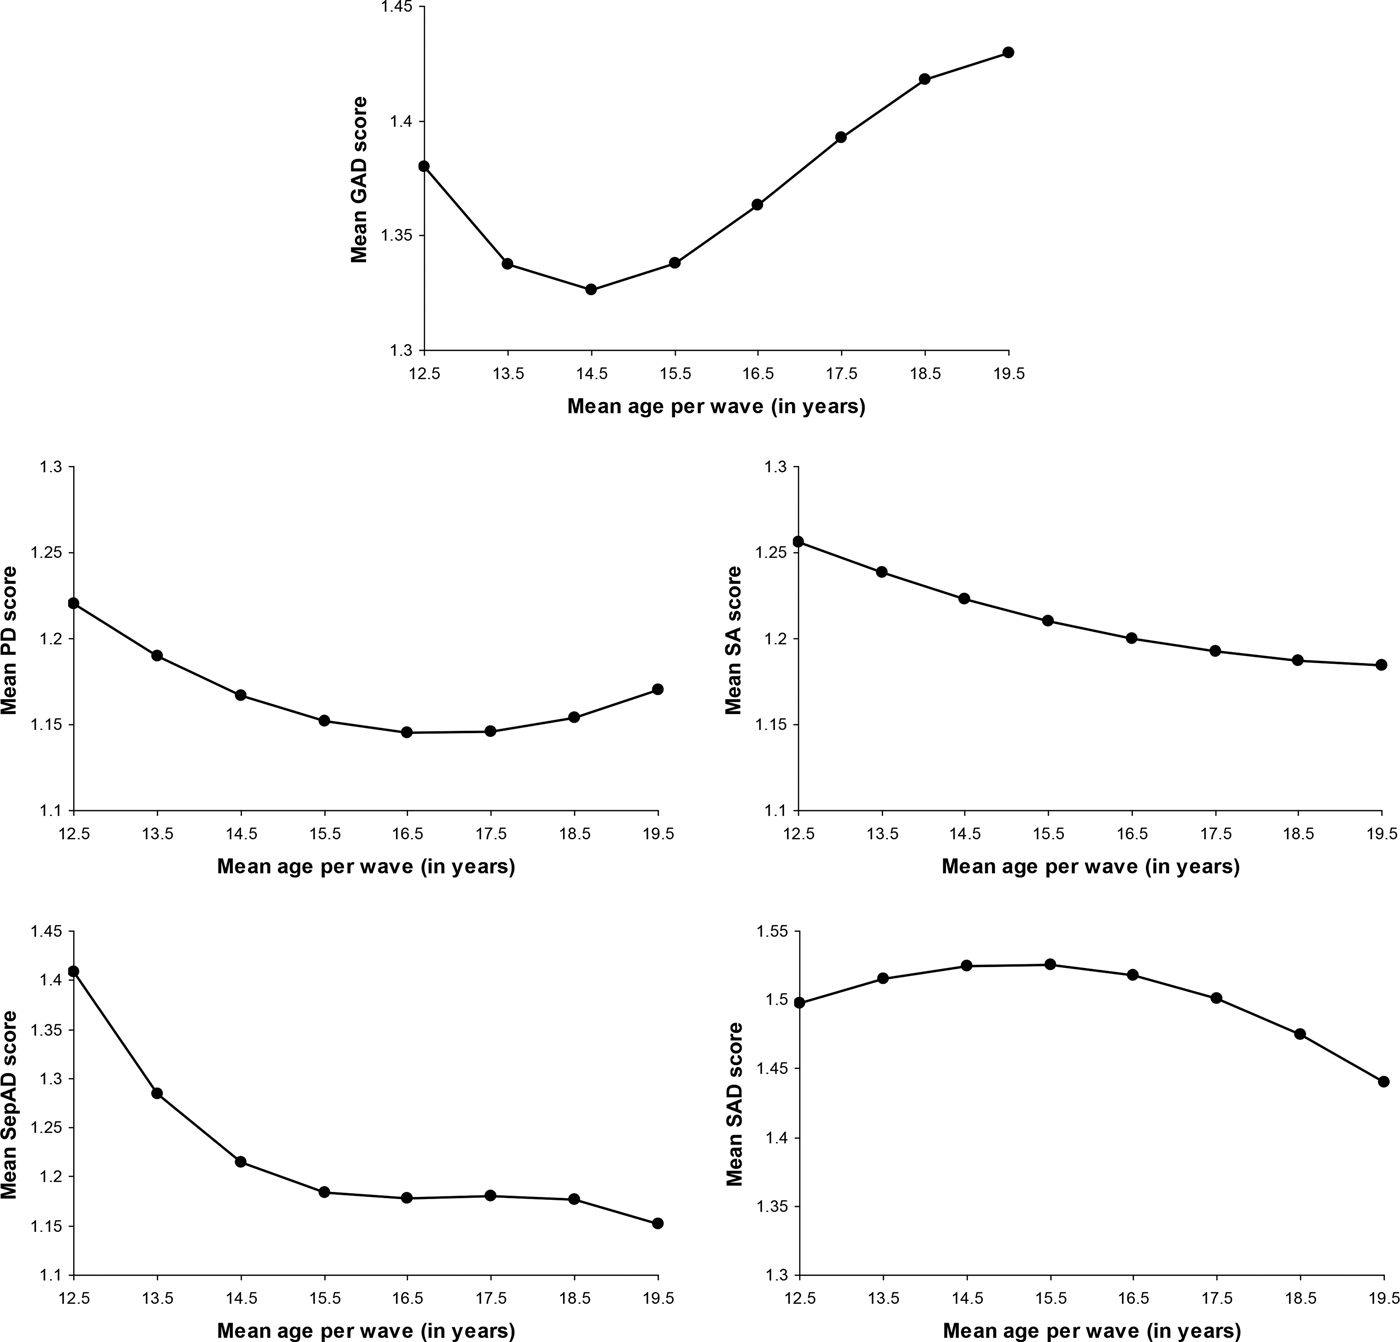
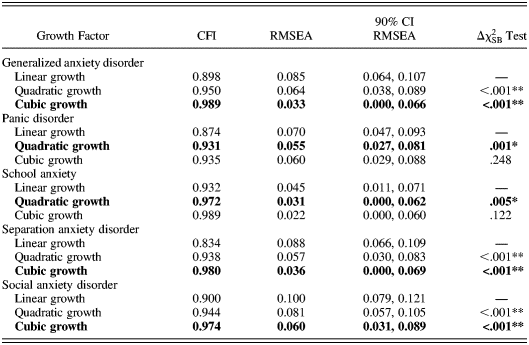
Figure 1 graphically displays the developmental trajectories of the five anxiety disorder symptom dimensions. The results from LGM suggested cubic growth for GAD, χ2SB (22) = 27.62, CFI = 0.989, RMSEA = 0.033, 90% CI of RMSEA = 0.000, 0.066; SepAD, χ2SB (22) = 28.89, CFI = 0.980, RMSEA = 0.036, 90% CI of RMSEA = 0.000, 0.069; SAD, χ2SB (22) = 41.25, CFI = 0.974, RMSEA = 0.060, 90% CI of RMSEA = 0.031, 0.089; and quadratic growth for PD, χ2SB (27) = 46.77, CFI = 0.931, RMSEA = 0.055, 90% CI of RMSEA = 0.027, 0.081; and SA, χ2SB (27) = 33.24, CFI = 0.972, RMSEA = 0.031, 90% CI of RMSEA = 0.000, 0.062. Table 1 provides an overview of the growth models comparing linear, quadratic, and cubic growth for each anxiety disorder symptom dimension.
Developmental trajectories of adolescent anxiety disorder symptoms as resulted from latent growth modeling. The y axis shows mean item scores, which range from 1 to 3. GAD, generalized anxiety disorder symptoms; PD, panic disorder symptoms; SA, school anxiety symptoms; SepAD, separation anxiety disorder symptoms; SAD, social anxiety disorder symptoms.

Results from hierarchical analyses of growth factors in latent growth modeling
Note: The best-fitting growth function describing the developmental trajectories for all five anxiety disorder symptom dimensions are in bold type. CFI, comparative fit index; RMSEA, root mean square error of approximation; 90% CI RMSEA, 90% confidence interval of the root mean square error of approximation; Δχ2SBtest, Satorra–Bentler scaled chi-square difference test.
*p < .01. **p < .001.
The severity of GAD symptoms and PD symptoms first decreased, followed by an increase over time. Specifically, the severity of GAD symptoms first decreased from early adolescence to middle adolescence, and then increased in middle adolescence, followed by a leveling off of this increase into late adolescence (see Figure 1; this is an example of cubic growth). The severity of PD symptoms decreased from early adolescence onward, followed by a leveling off of this decrease into middle adolescence, and a slight increase in symptoms from late adolescence onward (see Figure 1; this is an example of quadratic growth). These results are in line with our hypotheses, which expected an increase in GAD symptoms and PD symptoms from respectively early/middle adolescence onward and middle/late adolescence onward.
The severity of SA symptoms and SepAD decreased over time. Specifically, the severity of SA symptoms decreased from early adolescence onward (see Figure 1), and the severity of SepAD symptoms sharply declined from early into middle adolescence, followed by a temporary stabilization and then a further decline into late adolescence (see Figure 1). These results are also in line with our hypotheses, which expected a decrease in SA symptoms and SepAD symptoms throughout adolescence. Finally, the severity of SAD symptoms remained fairly stable from early adolescence to late adolescence (see Figure 1).
Sex differences in development of adolescent anxiety disorder symptoms
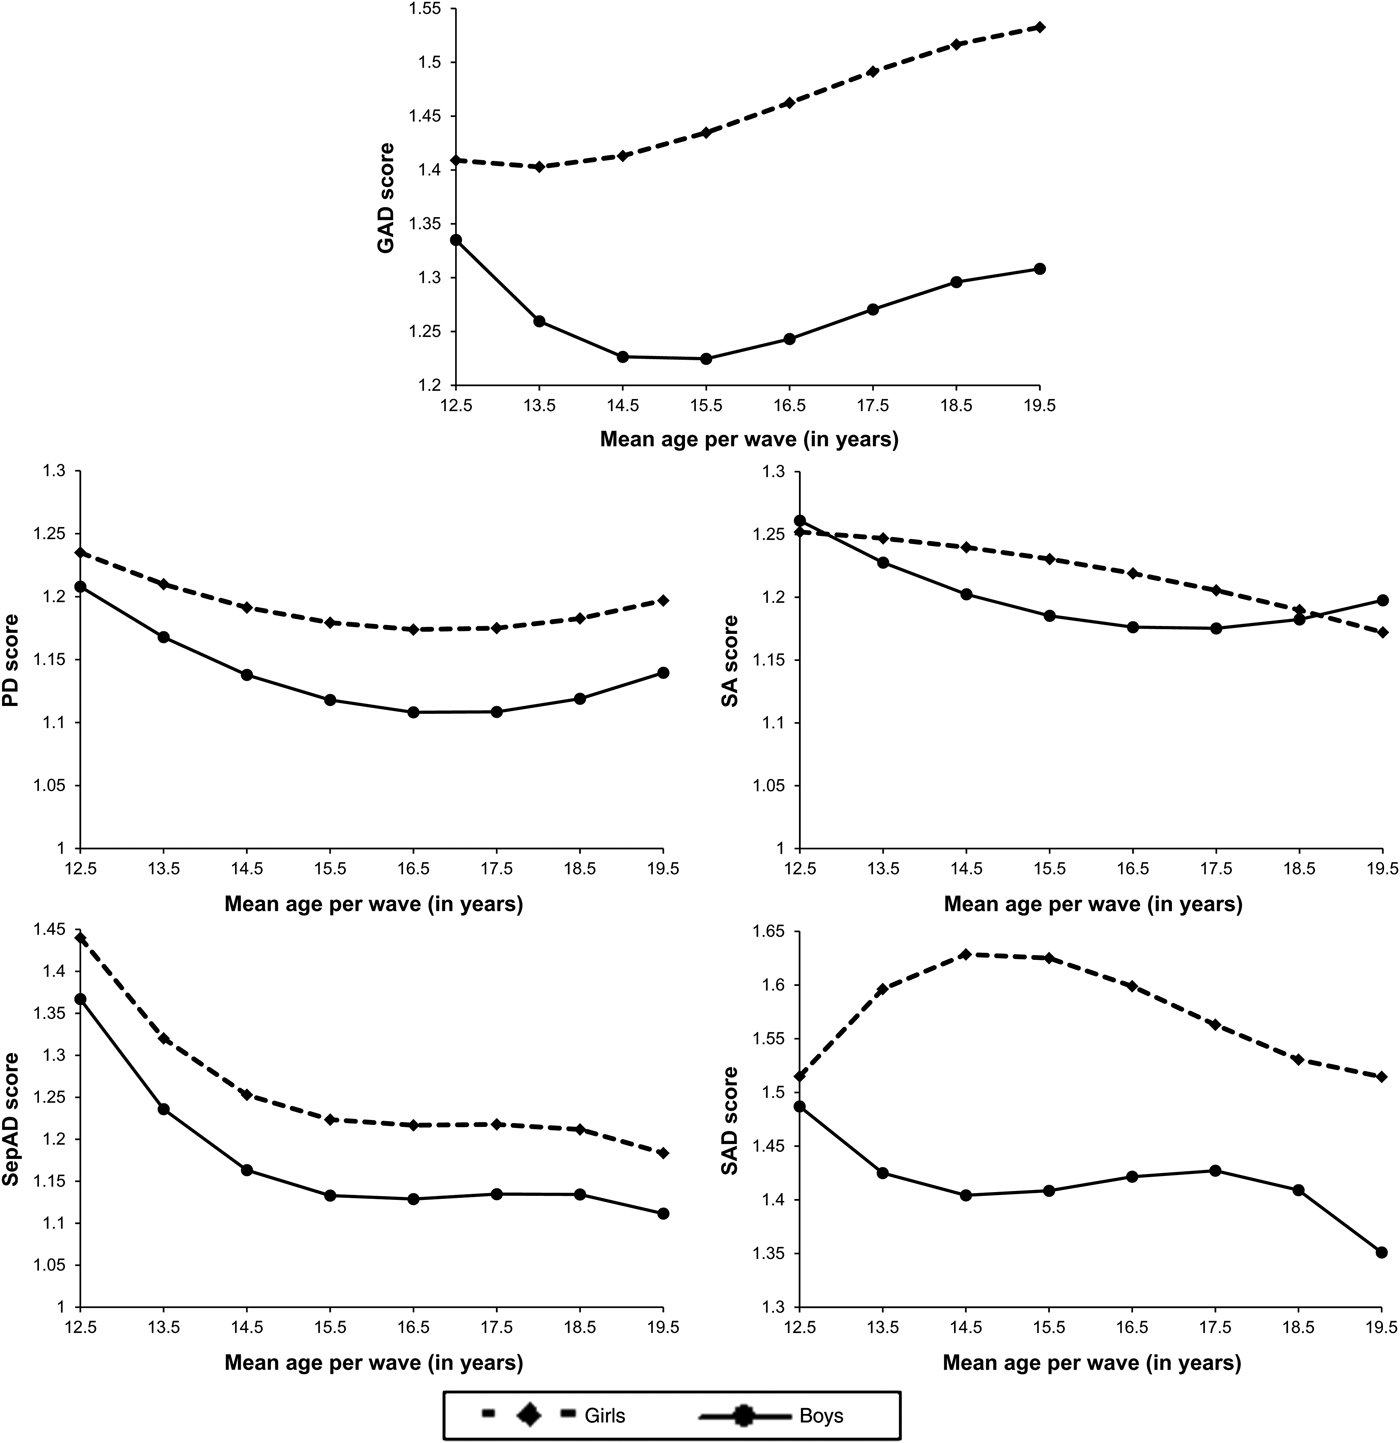
As a first step, we tested whether the same LGM model fitted the data for both boys and girls separately, which was the case for all five anxiety disorder symptom dimensions (CFI > 0.90, RMSEA ≤ 0.08, and/or the 90% CI of RMSEA at least including 0.08). The results from multigroup LGM analyses indicated significant differences between boys and girls in developmental trajectories of GAD symptoms, Δχ2SB (14) = 36.85, p < .001; SepAD symptoms, Δχ2SB (13) = 27.45, p = .01; and SAD symptoms, Δχ2SB (9) = 21.95, p = .01, over time. Girls reported somewhat higher mean levels of GAD and SepAD symptoms across adolescence than did boys (see Figure 2). In addition, boys and girls followed different developmental trajectories of GAD and SAD symptoms, but not SepAD symptoms, across adolescence (see Figure 2). No significant differences were found between boys and girls in mean levels and developmental trajectories of PD, Δχ2SB (9) = 7.32, p = .60; and SA, Δχ2SB (9) = 6.41, p = .70.
Sex differences in developmental trajectories of adolescent anxiety disorder symptoms as resulted from multigroup latent growth modeling. The results showed significant sex differences in developmental trajectories of generalized anxiety disorder symptoms, separation anxiety disorder symptoms, and social anxiety disorder symptoms. The y axis shows mean item scores, which range from 1 to 3. GAD, generalized anxiety disorder symptoms; PD, panic disorder symptoms; SA, school anxiety symptoms; SepAD, separation anxiety disorder symptoms; SAD, social anxiety disorder symptoms.
Heterogeneity in development of adolescent anxiety disorder symptoms
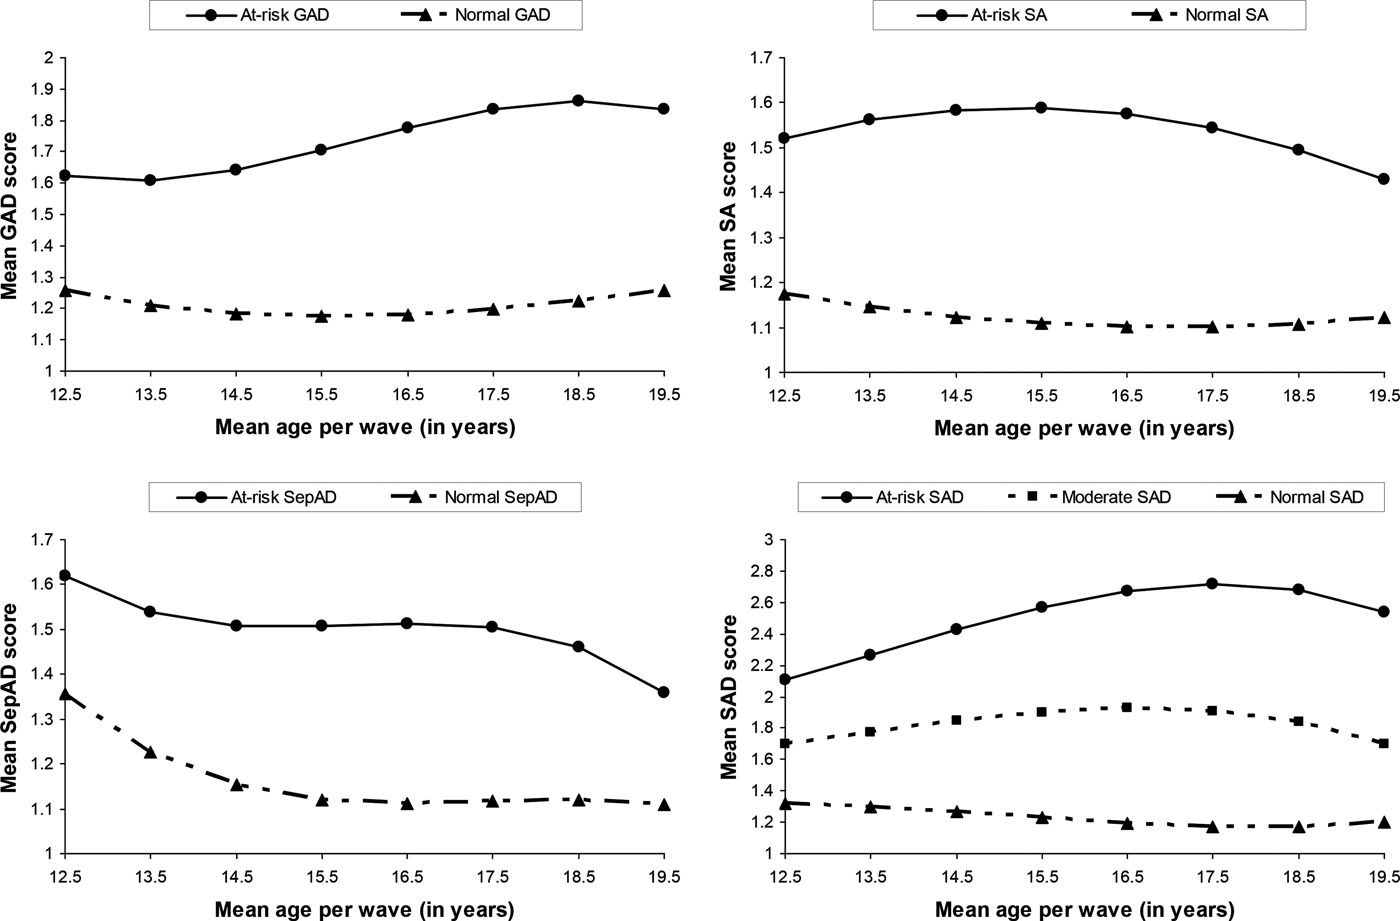
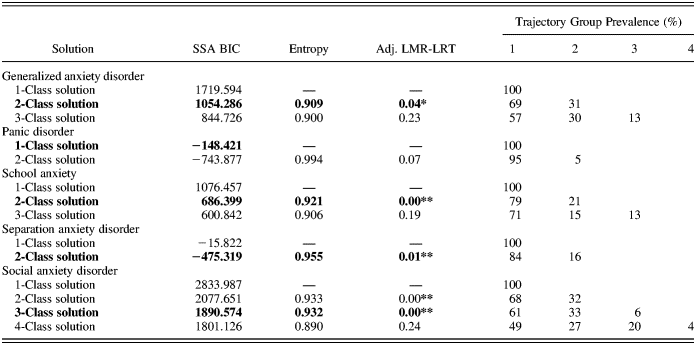
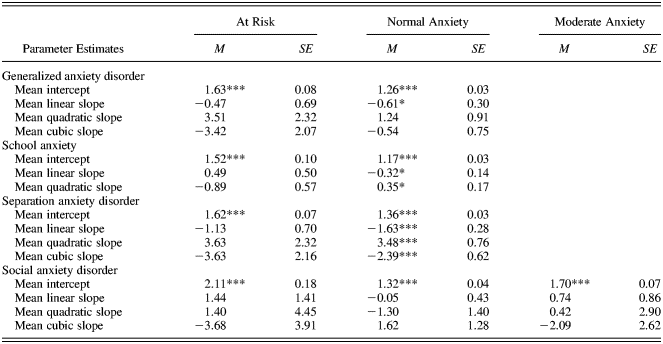
LCGA fit statistics for the five anxiety disorder symptom dimensions are summarized in Table 2. For all anxiety disorder symptoms except PD, more than one group was found to best represent the data. Thus, there appeared to be no heterogeneity in developmental trajectories of PD (i.e., all adolescents were found to follow approximately the same mean growth curve of PD over time), and therefore, PD will not be further discussed from this section on. There did appear to be heterogeneity in developmental trajectories of GAD, SA, SepAD, and SAD (i.e., different groups of adolescents were found to follow different mean growth curves of anxiety disorder symptoms over time). Based on the five criteria previously described, we decided upon a three-class solution as best fitting the LCGA model for SAD and a two-class solution for GAD, SA, and SepAD. Table 3 gives an overview of the growth parameters for the groups in the final LCGA models. In addition, Figure 3 graphically displays the developmental trajectories of GAD, SA, SepAD, and SAD for the groups in the final LCGA model.
Developmental trajectories of the different groups of GAD, SA, SepAD, and SAD as resulted from latent class growth analysis. The y axis shows mean item scores, which range from 1 to 3. GAD, generalized anxiety disorder symptoms; SA, school anxiety symptoms; SepAD, separation anxiety disorder symptoms; SAD, social anxiety disorder symptoms.
Class solutions resulting from latent class growth analyses
Note: The best-fitting class solutions for all five anxiety disorder symptom dimensions are in bold type. Entropy values and the adjusted LMR-LRT are not available for 1 class solutions in latent class growth analysis. SSA BIC, sample size adjusted Bayesian information criterion; adj. LMR-LRT, adjusted Lo–Mendell–Rubin likelihood ratio test.
*p < .05. **p < .01.
Parameter estimates of intercept and slope factors in latent class growth analyses
Note: The factor loadings of the linear slope factor were linearly parameterized for measurement occasions 1 through 8 as 0, 0.1, 0.2, 0.3, 0.4, 0.5, 0.6, and 0.7, respectively. The factor loadings of the quadratic and cubic slope factors were accordingly parameterized (i.e., as 0, 0.1, 0.4, 0.9, 0.16, 0.25, 0.36, and 0.49 and 0, 0.1, 0.8, 0.27, 0.64, 0.125, 0.216, and 0.343, respectively). We used this parameterization to increase the values of slope means and variances to values larger than 0.00.
*p < .05. **p < .01. ***p < .001.
For GAD, the two-class solution best fit the LCGA model. The first group, comprising 69% of the adolescents (47.3% girls), was characterized by a low initial level of GAD symptoms (M intercept = 1.26), which slightly decreased over time. The second group, which consisted of 31% of the adolescents (68.9% girls), was characterized by a higher initial level of GAD symptoms (M intercept = 1.63), which remained fairly stable over time. We labeled the first group normal GAD and the second group at-risk GAD.
For SA, all statistical fit indices were clearly in favor of a two-class solution. The first group, comprising 78.7% of the adolescents (51.6% girls), was characterized by a low initial level of SA symptoms (M intercept = 1.17), which slightly decreased over time. The second group, which consisted of 21.3% of the adolescents (62.7% girls), was characterized by a higher initial level of SA symptoms (M intercept = 1.52), which remained fairly stable over time. We labeled the first group normal SA and the latter group at-risk SA.
For SepAD, we decided that a two-class solution best fit the LCGA model, because adding a third group to the model resulted in serious estimation problems and resulted in a group of only 0.8% (n = 2) of the adolescents. The first group, comprising 83.7% of the adolescents (49.5% girls), was characterized by a low initial level of SepAD symptoms (M intercept = 1.36), which slightly decreased over time. The second group, which consisted of 16.3% of the adolescents (76.9% girls), was characterized by a higher initial level of SepAD symptoms (M intercept = 1.62), which remained fairly stable over time. We labeled the first group normal SepAD and the latter group at-risk SepAD.
For SAD, we decided that a three-class solution best fit the LCGA model. Adding a fourth group did not provide additional unique information (i.e., the fourth group was found to be a variation of one of the groups in the three-class solution) and resulted in a group of only 4% (n = 10) of the adolescents. The first group, comprising 61.5% of the adolescents (46.3% girls), was characterized by a low initial level of SAD symptoms (M intercept = 1.34), which remained fairly stable over time. The second group, which consisted of 5.9% of the adolescents (72.7% girls), was characterized by a higher initial level of SAD symptoms (M intercept = 2.05), which remained fairly stable over time. The third group, which consisted of 32.6% of the adolescents (46.3% girls), was characterized by a moderate initial level of SAD symptoms (M intercept = 1.66), which remained fairly stable over time. We labeled the first group normal SAD, the second group at-risk SAD, and the third latent group moderate SAD, respectively.
Heterogeneity in development of anxiety disorder symptoms and psychosocial development
Because of estimation difficulties for some of the anxiety disorder symptom dimensions, which were due to relatively small sample sizes, we will only present results from the multigroup LGM analyses that have not included sex as a covariate (the results from the analyses including sex as a covariate were roughly similar to the results that are presented in this paper and are available from the first author on request).Footnote 3 Furthermore, an exception to the previously described multigroup analysis strategy had to be made when comparing developmental trajectories of adolescent-perceived maternal support, school commitment, and neuroticism between the three SAD groups, because the at-risk SAD group was too small (containing 5.9% of the total sample) to freely estimate all growth parameters. Therefore, we were only able to look at differences between SAD groups in their mean intercept and mean slope factors, keeping the variances of the intercept and slope factors and the co-variances between the intercept and slope factors equal across SAD groups.
Anxiety disorder symptoms and neuroticism
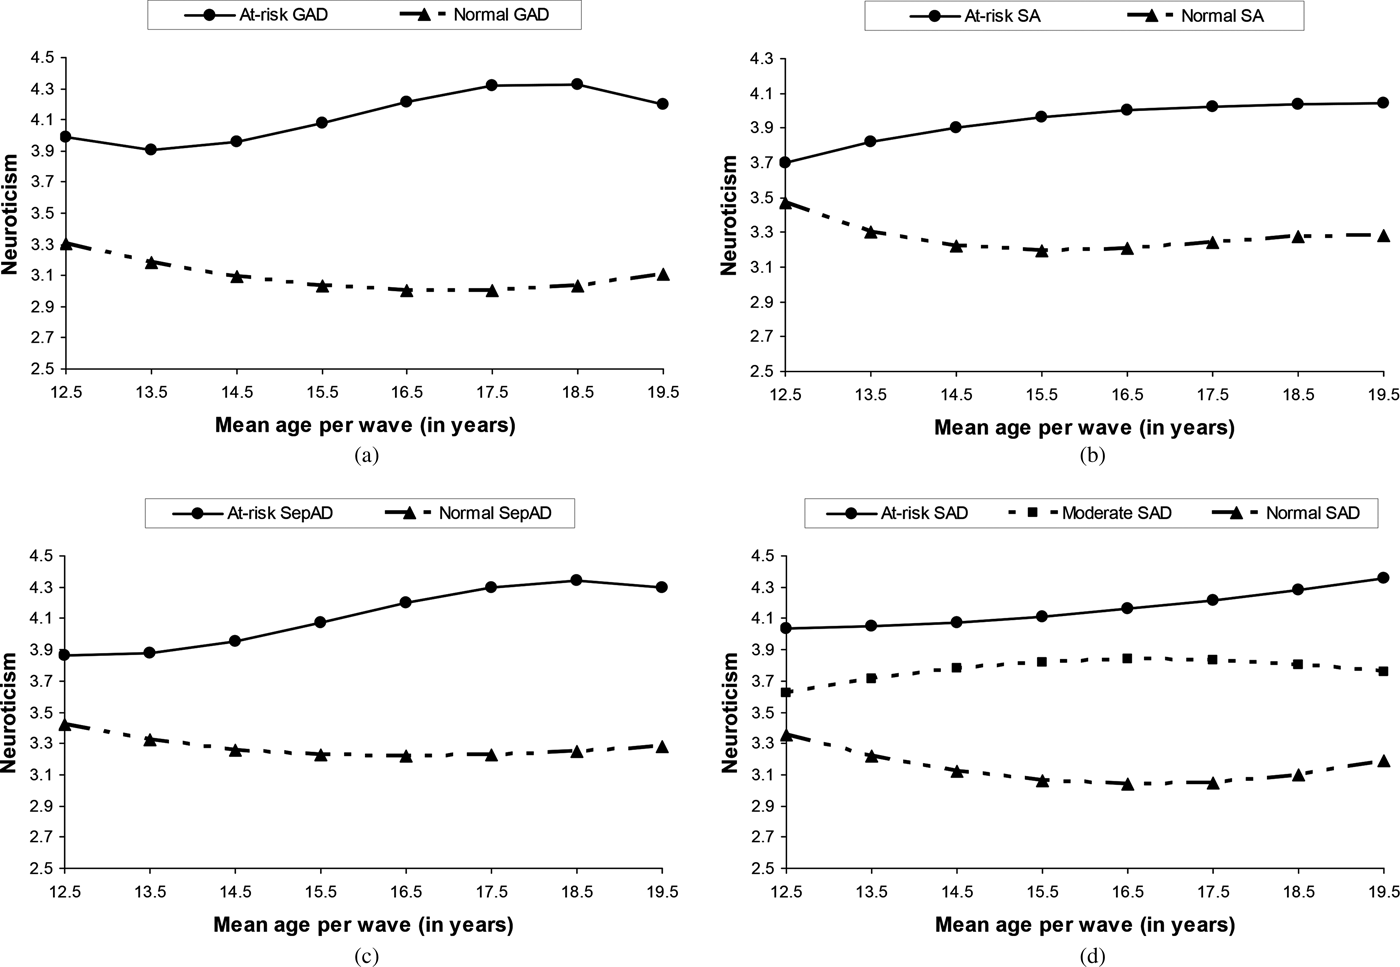
The results from LGM indicated that development of neuroticism over time was best described by cubic growth for GAD, SA, and SepAD symptoms, and quadratic growth for SAD symptoms. The results from multigroup LGM analyses indicated significant differences in developmental trajectories of neuroticism between the developmental profiles of all four anxiety disorder symptom dimensions: GAD, Δχ2SB (13) = 110.77, p < .001; SA, Δχ2SB (14) = 39.52, p < .001; SepAD, Δχ2SB (14) = 55.23, p < .001; and SAD, Δχ2SB (10) = 54.18, p < .001.
Specifically, adolescents in the at-risk GAD group reported relatively high levels of neuroticism, which increased from early into late adolescence, whereas adolescents in the normal GAD group reported lower levels of neuroticism, which remained fairly stable over time, χ2SB (45) = 49.40, CFI = 0.991, RMSEA = 0.029, 90% CI of RMSEA = 0.000, 0.069 (see Figure 4a). Adolescents in the at-risk SA group reported relatively high levels of neuroticism, which remained fairly stable from early into late adolescence, whereas adolescents in the normal SA group reported lower levels of neuroticism, which slightly decreased over time, χ2SB (44) = 53.08, CFI = 0.986, RMSEA = 0.042, 90% CI of RMSEA = 0.000, 0.078 (see Figure 4b). Adolescents in the at-risk SepAD group reported relatively high levels of neuroticism, which remained fairly stable from early into late adolescence, whereas adolescents in the normal SepAD group reported lower levels of neuroticism, which remained fairly stable over time, χ2SB (44) = 79.80, CFI = 0.951, RMSEA = 0.083, 90% CI of RMSEA = 0.053, 0.111 (see Figure 4c). Adolescents in the at-risk SAD group reported relatively high levels of neuroticism, which remained fairly stable from early into late adolescence, adolescents in the moderate SAD group reported moderate levels of neuroticism, which remained fairly stable over time, whereas adolescents in the normal SAD group reported relatively low levels of neuroticism, which slightly decreased from early adolescence to middle adolescence followed by a slight increase after middle adolescence, χ2SB (89) = 111.77, CFI = 0.966, RMSEA = 0.057, 90% CI of RMSEA = 0.000, 0.087 (see Figure 4d). These results are in line with our hypothesis that adolescents in the at-risk developmental profiles would report significantly higher developmental trajectories of neuroticism throughout adolescence compared to adolescents in the normal developmental profiles.
(a) Developmental trajectories of neuroticism for adolescents in the at-risk generalized anxiety disorder group and adolescents in the normal generalized anxiety disorder group (result from multigroup latent growth modeling). The y axis shows mean item scores (1–7). (b) Developmental trajectories of neuroticism for adolescents in the at-risk school anxiety group and adolescents in the normal school anxiety group (result from multigroup latent growth modeling). The y axis shows mean item scores (1–7). (c) Developmental trajectories of neuroticism for adolescents in the at-risk separation anxiety disorder group and adolescents in the normal separation anxiety disorder group (result from multigroup latent growth modeling). The y axis shows mean item scores (1–7). (d) Developmental trajectories of neuroticism for adolescents in the at-risk social anxiety disorder group and adolescents in the normal social anxiety disorder group (result from multigroup latent growth modeling). The y axis shows mean item scores (1–7). GAD, generalized anxiety disorder symptoms; SA, school anxiety symptoms; SepAD, separation anxiety disorder symptoms; SAD, social anxiety disorder symptoms.
Anxiety disorder symptoms and cannabis initiation
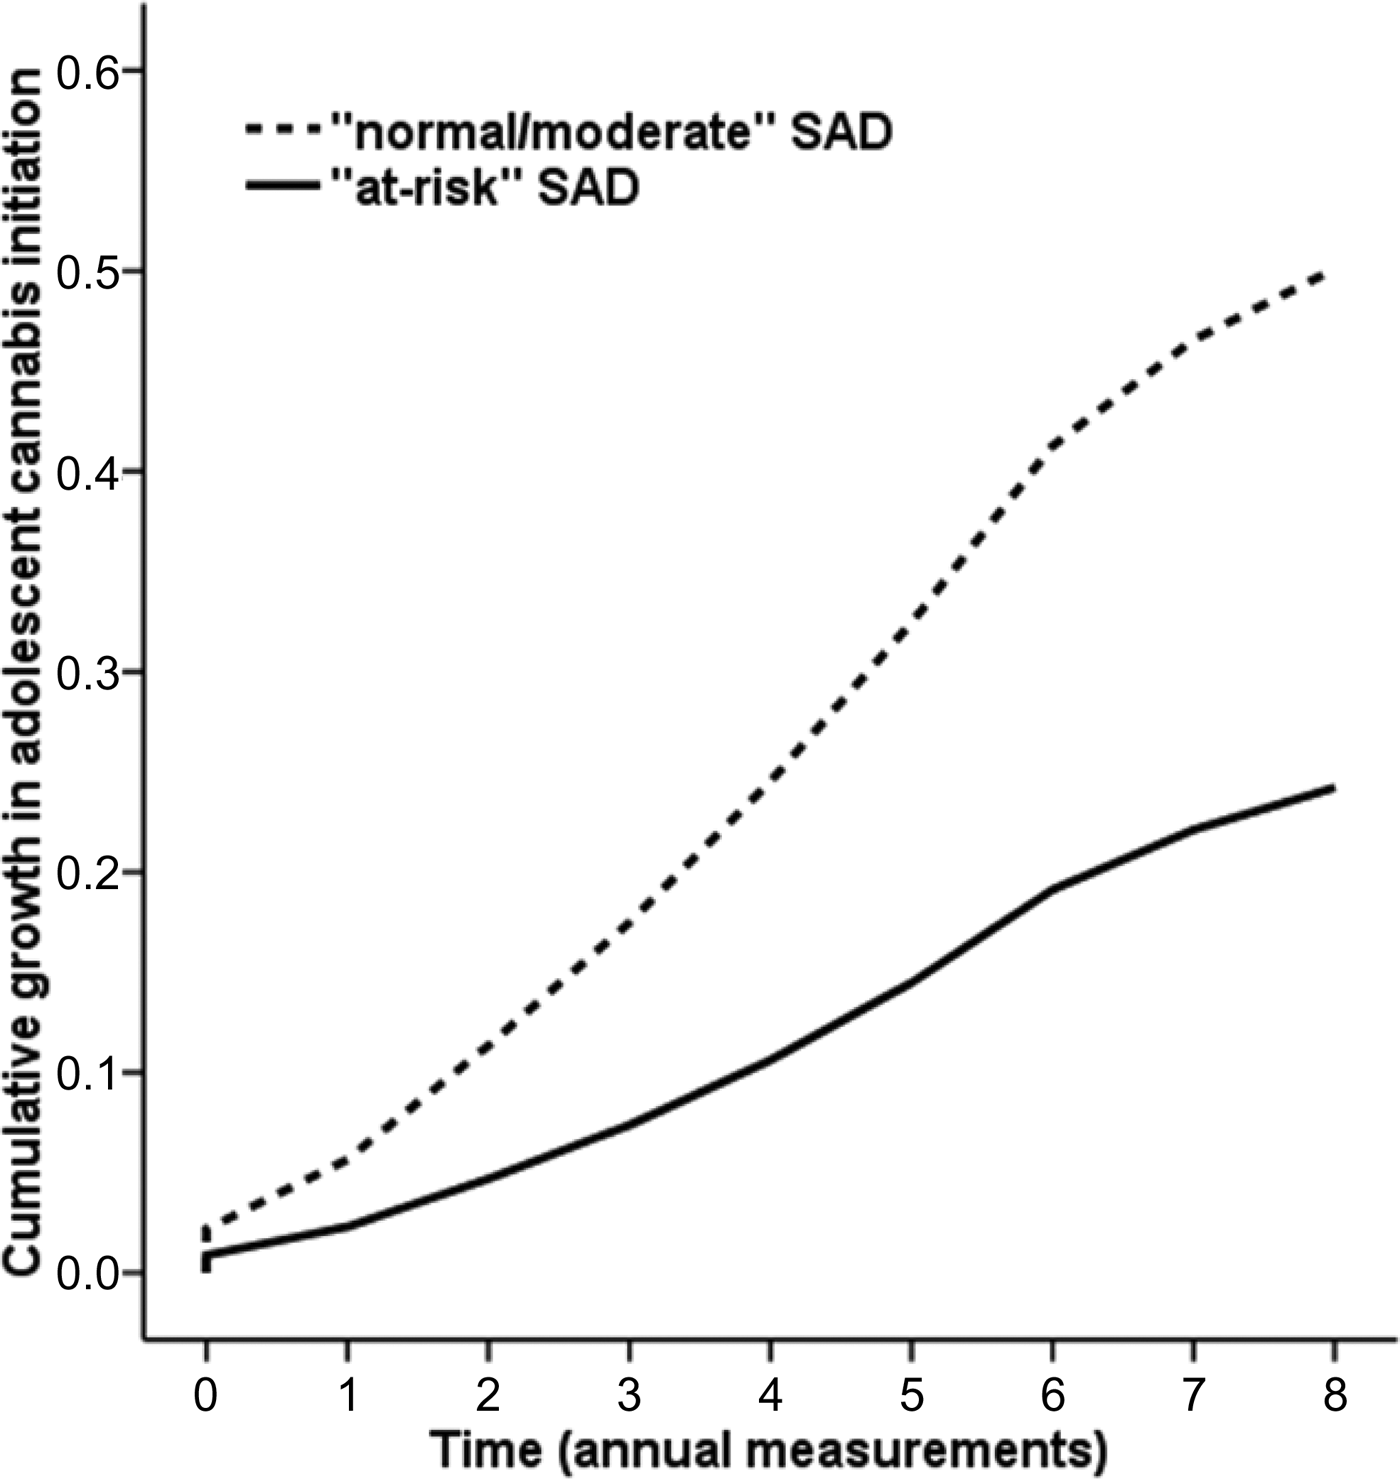
To prevent problems with model estimation for SAD because of the small at-risk group (containing 5.9% of the total sample), we first used exploratory analyses of the survival functions of the three SAD groups that emerged from the LCGA. These analyses indicated that the moderate SAD and the normal SAD groups showed almost exactly the same survival function of cannabis initiation over time. For analytical reasons (i.e., to increase power), we therefore decided to merge these two groups into one group labeled normal/moderate SAD.
The results from the Cox regression survival analysis omnibus test indicated that both sex and the SAD developmental profiles significantly predicted cannabis initiation, χ2 (2) = 7.19, p = .03. Boys were significantly more likely to first use cannabis at an earlier age than girls (odds ratio = 1.45, 95% CI = 1.00, 2.09; p = .05) and, controlled for sex, adolescents in the normal/moderate SAD group were borderline significantly more likely to first use cannabis at an earlier age than adolescents in the at-risk SAD group (odds ratio = 2.51, 95% CI = 1.00, 7.92; p = .06). The results indicated that 79% of the adolescents classified within the at-risk SAD group did not initiate cannabis within the 8 years measured in this study (ages ~12.5–19.5), compared to 50% of the adolescents classified within the normal/moderate SAD group (see Figure 5).
The cumulative growth in adolescent cannabis initiation from 0.0 (0%) to 1.0 (100%) for adolescents classified in the at-risk SAD developmental profile and adolescents classified in the normal/moderate SAD developmental profile. SAD, social anxiety disorder symptoms.
The results further indicated that, controlled for sex, the developmental profiles did not predict survival time in cannabis initiation for GAD, χ2 (1) = 0.03, p = .87; SA, χ2 (1) = 0.14, p = .71; and SepAD symptoms, χ2 (1) = 0.06, p = .81, respectively. These results suggest that survival time did not differ significantly between adolescents in the at-risk and normal developmental profiles of GAD, SA, and SepAD symptoms.
Anxiety disorder symptoms and adolescent-perceived maternal support
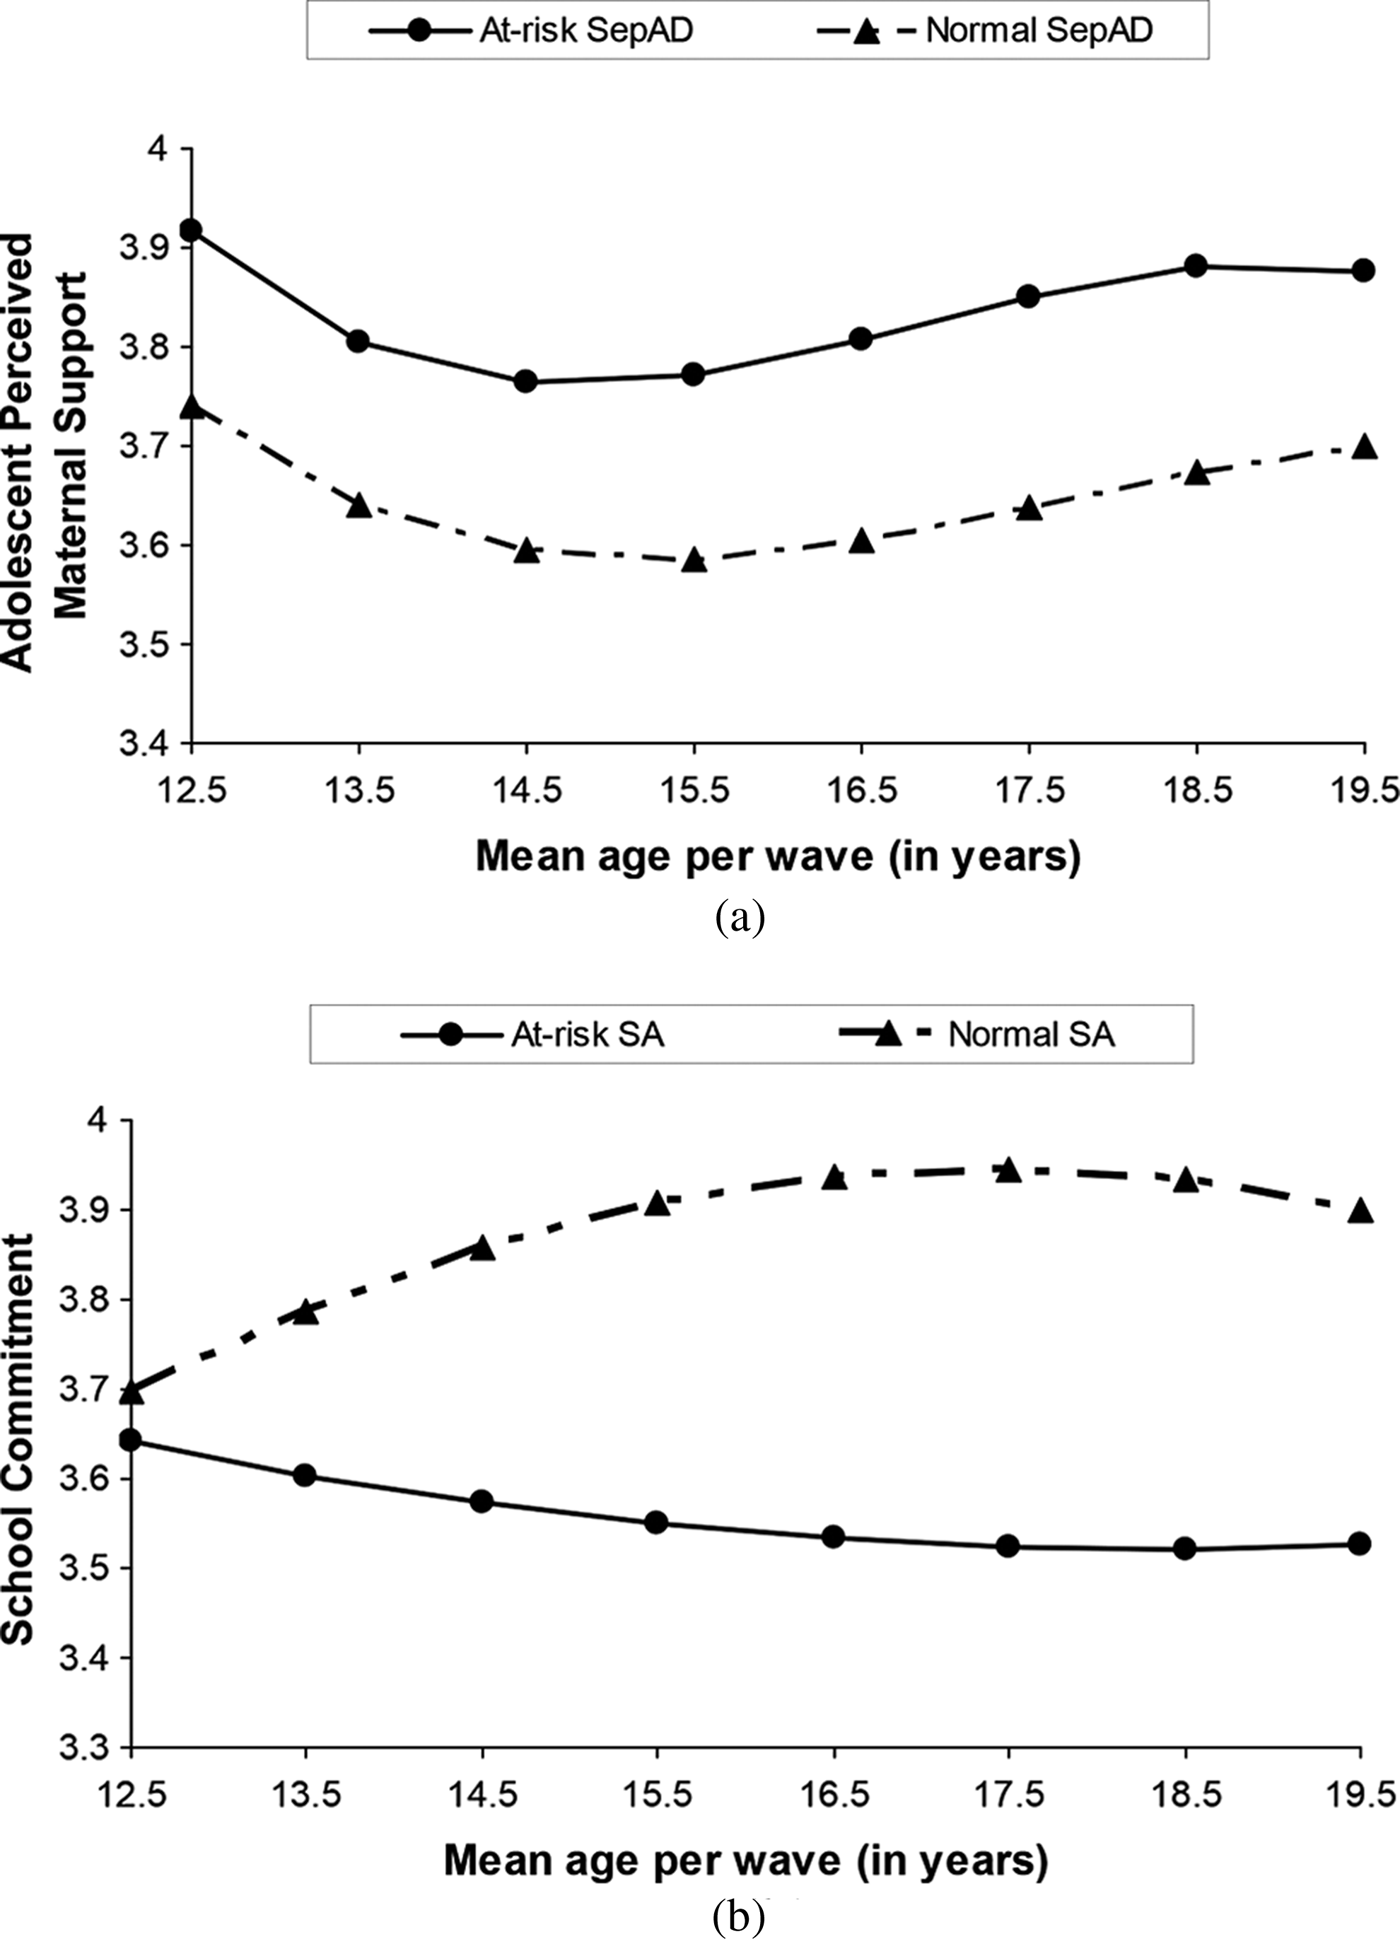
The results from LGM indicated that development of adolescent-perceived maternal support over time was best described by cubic growth for all developmental profiles of the four anxiety disorder symptom dimensions (GAD, SA, SepAD, and SAD). The results from multigroup LGM analyses indicated only significant differences in developmental trajectories of adolescent-perceived maternal support between adolescents in groups of SepAD symptoms, Δχ2SB (10) = 19.10, p = .04, and no significant differences between adolescents in groups of GAD, Δχ2SB (10) = 5.80, p = .83; SA, Δχ2SB (13) = 4.95, p = .98; and SAD symptoms, Δχ2SB (8) = 6.77, p = .56. Specifically, adolescents in the at-risk SepAD group reported higher mean levels of perceived maternal support from early adolescence into late adolescence than did adolescents in the normal SepAD group, χ2SB (52) = 117.90, CFI = 0.921, RMSEA = 0.103, 90% CI of RMSEA = 0.078, 0.128 (see Figure 6a).
(a) Developmental trajectories of adolescent-perceived maternal support for adolescents in the at-risk separation anxiety disorder group and adolescents in the normal separation anxiety disorder group (results from multigroup latent growth modeling). The y axis shows mean item scores (1–5). (b) Developmental trajectories of school commitment for adolescents in the at-risk school anxiety group and adolescents in the normal school anxiety group (results from multigroup latent growth modeling). The y axis shows mean item scores (1–5). SA, school anxiety symptoms; SepAD, separation anxiety disorder symptoms.
Anxiety disorder symptoms and school commitment
The results from LGM indicated that development of school commitment over time was best described by quadratic growth for all developmental profiles of the four anxiety disorder symptom dimensions (GAD, SA, SepAD, and SAD). The results from multigroup LGM analyses indicated only significant differences in developmental trajectories of school commitment between adolescents in groups of SA symptoms, Δχ2SB (6) = 35.55, p < .001, and no significant differences between adolescents in groups of GAD, Δχ2SB (9) = 10.93, p = .28; SepAD, Δχ2SB (8) = 3.81, p = .87; and SAD symptoms, Δχ2SB (6) = 6.85, p = .34. Specifically, adolescents in the at-risk SA group reported low, slightly decreasing levels of school commitment from early adolescence into late adolescence, whereas adolescents in the normal SA group reported rapidly increasing levels of school commitment over time, χ2SB (57) = 65.81, CFI = 0.978, RMSEA = 0.036, 90% CI of RMSEA = 0.000, 0.070 (see Figure 6b).
Conclusion
In summary, results from LGM suggested that there are different developmental trajectories for the five anxiety disorder symptom dimensions (GAD, PD, SA, SepAD, and SAD). Symptoms of GAD and PD displayed a nonlinear increase from early into late adolescence, whereas symptoms of SA and SepAD displayed a nonlinear decrease over time, and SAD symptoms remained fairly stable. Significant sex differences were found for symptoms of GAD, SepAD, and SAD, with girls reporting higher levels of these symptoms over time. These results are largely in accordance with our hypotheses.
The results from LCGA further suggested two groups of adolescents following different mean growth curves for GAD, SA, and SepAD (labeled as normal and at-risk developmental profiles), and three groups of adolescents following different mean growth curves for SAD (labeled as normal, at-risk, and moderate SAD). There appeared to be a somewhat equal percentage of boys and girls in the normal developmental profiles, but a larger percentage of girls than boys in the at-risk developmental profiles.
Finally, results from multigroup LGM suggested that adolescents in the at-risk developmental profiles of GAD, SA, SepAD, and SAD had higher levels of neuroticism throughout adolescence than did adolescents in the normal developmental profiles. This is an important indication that the normal and at-risk developmental profiles we have identified with LCGA are psychologically valid. Survival analysis further indicated borderline significant (p = .06) differences in cannabis initiation only between groups of SAD, with adolescents in the at-risk SAD developmental profile being less likely to initiate cannabis use at an early age than are adolescents in the normal/moderate SAD developmental profile. In addition, multigroup LGM indicated significant differences only between groups of SepAD and SA in adolescent-perceived maternal support and school commitment, respectively. Specifically, adolescents in the at-risk SepAD developmental profile reported higher mean levels of perceived maternal support from early into late adolescence than did adolescents in the normal SepAD developmental profile, and adolescents in the at-risk SA developmental profile reported low, slightly decreasing levels of school commitment from early into late adolescence, whereas adolescents in the normal SA developmental profile reported rapidly increasing levels of school commitment over time. Thus, different anxiety disorder symptom dimensions appear to be differentially related to developmental trajectories of substance use, parenting, and identity development.
Discussion
This study examined the development of GAD, PD, SA, SepAD, and SAD symptoms in an 8-year longitudinal community study covering the entire adolescent years from early to late adolescence (ages ~12–19). The results of this study shed light not only on the mean level development of these five anxiety disorder symptom dimensions across adolescence but also on heterogeneity in these developmental trajectories by distinguishing between normal and at-risk groups of adolescents regarding their anxiety disorder symptom development. Moreover, adolescents in the at-risk developmental profiles showed significantly different developmental trajectories of psychosocial outcomes than did adolescents in the normal developmental profiles, including differential associations between specific anxiety disorder symptom dimensions and psychosocial outcomes (suggesting discriminant validity).
Development of adolescent anxiety disorder symptoms
Our results on normal developmental trajectories of adolescent GAD, PD, SA, SepAD, and SAD are largely consistent with our hypotheses based on developmental theory (Warren & Sroufe, Reference Warren, Sroufe, Ollendick and March2004; Weems, Reference Weems2008; Westenberg et al., Reference Westenberg, Siebelink, Treffers, Silverman and Treffers2001) and previous studies (Hale et al., Reference Hale, Raaijmakers, Muris, Van Hoof and Meeus2008; Van Oort et al., Reference Van Oort, Greaves-Lord, Verhulst, Ormel and Huizink2009). Although the present study consists of a subsample of the 5-year longitudinal study by Hale et al., the results slightly differ. Hale et al. found linear decreases in all anxiety disorder symptoms, except for SAD symptoms, which remained fairly stable, but we found nonlinear decreases for SA and SepAD symptoms and nonlinear increases for GAD and PD symptoms. These differences likely exist because our study longitudinally covers the entire adolescent years in one cohort in a prospective longitudinal design, and the additional waves examined in this study allowed for a more detailed examination of nonlinear development throughout adolescence.
More specifically, our findings suggested that GAD symptoms first declined in early adolescence, followed by a sharp increase in symptoms from middle adolescence onward, whereas PD symptoms slightly decreased from early into middle adolescence, followed by a slight increase in symptoms from late adolescence onward (see Figure 1). The initial decrease in GAD and PD symptoms could be interpreted as a result of the, often stressful, transition from childhood into early adolescence, which is accompanied by a transition from primary to secondary school for most children. The stress accompanied by this transition may be reflected in initially higher levels of anxiety in early adolescence, which decline over time. The subsequent increase in GAD and PD symptoms in middle and late adolescence, respectively, could be related to normative developmental changes, such as cognitive maturation (Muris, Merckelbach, Meesters, & Van Den Brand, Reference Muris, Merckelbach, Meesters and Van Den Brand2002; Van Oort et al., Reference Van Oort, Greaves-Lord, Verhulst, Ormel and Huizink2009; Westenberg et al., Reference Westenberg, Siebelink, Treffers, Silverman and Treffers2001).
However, significant sex differences in developmental trajectories of GAD should be taken into account in interpretation of our findings (see Figure 2). Although boys showed a slight decrease in GAD symptoms followed by a slight increase in symptoms from middle adolescence onward, mean levels of GAD symptoms in early and late adolescence were comparable for boys. In contrast, girls showed rather stable levels of GAD followed by an increase in symptoms from middle adolescence onward. This suggests that girls appear to be especially vulnerable for increasing levels of GAD across adolescence and, thus, appear to be at heightened risk.
Symptoms of SA and SepAD showed a nonlinear decline over time (see Figure 1). This decrease could reflect improved adaptation to the school environment (decreasing SA symptoms) and successful separation and individuation processes throughout adolescence (decreasing SepAD symptoms). In contrast, symptoms of SAD remained fairly stable (see Figure 2), which is in line with some previous studies (e.g., Hale et al., Reference Hale, Raaijmakers, Muris, Van Hoof and Meeus2008; Westenberg et al., Reference Westenberg, Gullone, Bokhorst, Heyne and King2007, p. 477, on absolute scores of social evaluation fears) but does not seem to fit nicely within theoretical suggestions on the increase of SAD symptoms in adolescence due to increased fear of negative social evaluation.
However, significant sex differences appear to be especially important to take into account in interpretation of this last finding (see Figure 2). Although boys showed a nonlinear decrease in SAD symptoms during adolescence, girls showed a steep increase in SAD symptoms from early to middle adolescence, followed by a decrease in symptoms from middle adolescence onward. According to our results, the heightened levels of SAD expected in midadolescence by developmental theory seem to apply only to girls but less so to boys. However, some studies suggest that age-related changes in adolescent SAD symptoms (i.e., increase) could be obscured by the relative decline in overall anxiety (Weems & Costa, Reference Weems and Costa2005) and that the theoretically expected increase in SAD symptoms is revealed when relative social concerns (Weems & Costa, Reference Weems and Costa2005) and type of social anxiety (Westenberg et al., Reference Westenberg, Drewes, Siebelink and Treffers2004) are taken into consideration. Regarding SAD symptoms, a discrepancy remains between empirical findings and developmental theory; thus, there is a further need for better integration.
Overall, the reported sex differences were all in the expected direction and are in line with previous findings, which suggest that adolescent girls report more anxiety disorder symptoms compared to adolescent boys and are at a higher risk for developing anxiety disorders (Bosquet & Egeland, Reference Bosquet and Egeland2006; Lewinsohn et al., Reference Lewinsohn, Lewinsohn, Gotlib, Seeley and Allen1998; for a systematic review, see McLean & Anderson, Reference McLean and Anderson2009). The nonsignificant sex differences in the development of PD and SA symptoms during adolescence are also in line with previous studies (e.g., Hale et al., Reference Hale, Raaijmakers, Muris, Van Hoof and Meeus2008; Van Oort et al., Reference Van Oort, Greaves-Lord, Verhulst, Ormel and Huizink2009), although SA has received much less study than other anxiety disorder symptom dimensions, because it is not an official DSM-IV-TR anxiety disorder. Furthermore, PD symptoms appear to be fairly rare in adolescence, but as the prevalence of PD symptoms increases further in adulthood, sex differences may then become apparent (Reed & Wittchen, Reference Reed and Wittchen1998).
Clearly, different anxiety disorder symptom dimensions show different developmental trajectories from early into late adolescence. Our results further emphasize the importance of looking at separate dimensions of anxiety disorder symptoms in contrast to looking at anxiety as a general construct. When different anxiety disorder symptoms are grouped together as one general construct, findings occurring from this grouping can obscure age-related normative developmental changes during adolescence (Weems, Reference Weems2008). The resulting nuances provided by the examination of specific anxiety disorder symptoms are especially important for distinguishing between adolescents at risk for further anxiety disorder development and those adolescents with normative and transient anxiety disorder symptoms. Altogether, our findings extend previous findings on the normal development of anxiety disorder symptoms and advance our understanding of normal developmental changes in the expression of anxiety throughout adolescence.
Heterogeneity in development of adolescent anxiety disorder symptoms
The results from LCGA further suggested heterogeneity in developmental trajectories of adolescent GAD, SA, SepAD, and SAD symptoms, but not PD symptoms (which was best described by just one single group of adolescents following approximately the same developmental trajectory). For the anxiety disorder symptom dimensions of GAD, SA, SepAD, and SAD, a majority of adolescents (61.5%–83.7%) followed a developmental trajectory with persistent low anxiety disorder symptoms from early into late adolescence (this group was labeled normal), and a minority of adolescents (5.9%–31%) followed a developmental trajectory with persistent high anxiety disorder symptoms from early into late adolescence (this group was labeled at risk). Although boys and girls were equally represented in the normal developmental profiles, a much larger percentage of girls than boys was represented in the at-risk developmental profiles.
The results on heterogeneity in GAD, SA, and SepAD symptoms are in line with our expectations. However, the results suggested little interindividual differences (no heterogeneity) in developmental trajectories of adolescent PD symptoms and large interindividual differences (much heterogeneity) in developmental trajectories of adolescent SAD symptoms. Because PD symptoms appear to be relatively rare throughout adolescence, both sex differences (Reed & Wittchen, Reference Reed and Wittchen1998) and interindividual differences in developmental trajectories of PD symptoms may become apparent only later in life, as the prevalence of PD symptoms increases further in adulthood. The large interindividual differences in developmental trajectories of SAD symptoms were mainly attributable to differences in mean levels of SAD symptoms over time. This suggests that large interindividual differences between adolescents in the severity of SAD symptoms at the start of adolescence remain fairly stable over time, which could be taken to underline the importance of early prevention and intervention for those adolescents with relatively high levels of SAD symptoms at the start of adolescence.
Our results emphasize the continuity of anxiety disorder symptoms, because adolescents in the at-risk developmental profiles displayed persistent heightened levels of anxiety disorder symptoms over 8 successive years. Therefore, adolescents in the at-risk developmental profiles deserve special attention from researchers and clinicians, because a percentage of these adolescents are at heightened risk for ultimately developing a full-blown anxiety disorder. Interpretation of the current findings in terms of clinical implications for adolescent psychopathology should be made with caution, however, because the current study involves a normal population sample of adolescents, not a clinical sample. Thus, it should be recognized that the at-risk status of adolescents in the at-risk developmental profiles is not the same as a psychiatric diagnosis. According to the concept of multifinality (Cicchetti & Rogosch, Reference Cicchetti and Rogosch1996, Reference Cicchetti and Rogosch2002), adolescents in the at-risk developmental trajectory groups share a common risk status, namely showing continuing high levels of anxiety disorder symptoms over the course of 8 successive years, but this may not necessarily result in the development of a full-blown anxiety disorder. Many complex interactions between the individual and biological, behavioral, cognitive, and social experiences influence the specific trajectories followed by individuals, and they could result in (dis)continuation of a certain developmental trajectory. Thus, although the common risk status of adolescents in the at-risk developmental profiles puts them at heightened risk for continuing high levels of anxiety disorder symptoms and the potential development of actual DSM-IV-TR anxiety disorders, not all adolescents will continue to follow this problematic developmental trajectory. This study's results may provide important insights for researchers and clinicians alike, because these findings provide a better look into the development of at-risk anxiety disorder symptoms over the entire adolescence; a picture which has been lacking in previous studies.
Heterogeneity in development of anxiety disorder symptoms and psychosocial development
The validity of the normal and at-risk developmental profiles of anxiety disorder symptoms found in LCGA was supported longitudinally. Adolescents in the at-risk developmental profiles were found to follow significantly different overlapping developmental trajectories of specific psychosocial developmental outcomes (i.e., personality, substance use, parenting, and identity) compared to adolescents in the normal developmental profiles. Our first goal was to validate the distinction between the normal and at-risk developmental profiles found in LCGA by showing that adolescents in the at-risk profiles reported significantly higher levels of neuroticism over time than did adolescents in the normal profiles. Neuroticism appeared to be a common dimension in all anxiety disorder symptoms, with our results demonstrating that adolescents in the at-risk developmental profiles of GAD, SA, SepAD, and SAD all reported higher developmental trajectories of neuroticism than did adolescents in the normal developmental profiles. The finding that neuroticism is a common dimension found in all of these anxiety disorder symptom dimensions is in accordance with previous suggestions of neuroticism's being at the core of many depressive and anxiety disorders (e.g., Watson, Reference Watson1999; Weinstock & Whisman, Reference Weinstock and Whisman2006). In this line of reasoning, often referred to as the tripartite model (or, hierarchical models of depression and anxiety), neuroticism is considered to be a general individual vulnerability. High levels of neuroticism make individuals vulnerable to developing anxiety symptoms in general (such as a genotype), but context factors determine the specific expression of this vulnerability and, thereby, determine the expression of specific anxiety disorder symptoms (such as a phenotype). Therefore, the separate anxiety disorder symptom dimensions studied in this paper could conceivably be considered to be distinct expressions of an underlying vulnerability (i.e., neuroticism).
In addition to this general association with neuroticism, the at-risk developmental profiles of SA, SepAD, and SAD were found to be differentially related to school commitment, adolescent-perceived maternal support, and cannabis initiation, respectively, suggesting discriminant validity. These results further underscore the importance of examining separate dimensions of anxiety disorder symptoms in contrast to examining anxiety as a general construct, because the anxiety disorder symptoms showed differential longitudinal associations with theoretically expected developmental outcomes. Specifically, adolescents in the at-risk developmental profile of SA showed stable low levels of school commitment whereas adolescents in the normal developmental profile of SA showed a steady nonlinear increase of school commitment over time (Figure 6b). Higher levels of SA thus seem to interfere with one of the fundamental aspects of adolescent identity formation, namely commitment in the school domain. Strong feelings of affiliation, engagement, and commitment to school are likely diminished by SA symptoms.
Furthermore, adolescents in the at-risk developmental profile of SepAD showed higher mean levels of perceived maternal support over time than did adolescents in the normal developmental profile of SepAD (Figure 6a), and adolescents in the at-risk developmental profile of SAD were more likely to show later cannabis initiation than were adolescents in the normal developmental profile of SAD (Figure 5). This last result seems to suggest that heightened levels of SAD may serve a protective function, providing support for the buffer perspective (Myers et al., Reference Myers, Tomlinson, Aarons and Stein2003; Shedler & Block, Reference Shedler and Block1990, Siebenbruner et al., Reference Siebenbruner, Englund, Egeland and Hudson2006). Although both of the above-reported developmental outcomes may seem healthier for adolescents in the at-risk developmental profiles, suggesting a potential protective role of anxiety, this is not necessarily the case. Risk behaviors, such as cannabis use, appear to be part of normal development in adolescence, with many of these risk behaviors representing normal, healthy explorative, experimental, and adolescent-limited behaviors. From this point of view, later cannabis initiation by adolescents in the at-risk SAD developmental profile could be considered to be a result of reduced normal exploration and experimentation behavior. In addition, it may represent dysfunctional peer relationships, because many risk behaviors during adolescence, including cannabis use, are conducted within the peer context (e.g., Engels & Ter Bogt, Reference Engels and Ter Bogt2001; Griffith-Lendering et al., Reference Griffith-Lendering, Huijbregts, Huizink, Ormel, Verhulst and Vollebergh2011; Steinberg, Reference Steinberg2004, Reference Steinberg2007).
In a comparable line of reasoning, adolescent separation and individuation, autonomy development, and increased reliance on peer relationships compared to parental relationships are important developmental tasks and changes in adolescence, generally resulting in lower levels of perceived parental support (De Goede, Branje, & Meeus, Reference De Goede, Branje and Meeus2009; Shanahan, McHale, Crouter, & Osgood, Reference Shanahan, McHale, Crouter and Osgood2007). Therefore, higher levels of perceived maternal support during adolescence could represent less successful separation and individuation processes and autonomy development for adolescents in the at-risk developmental profile of SepAD. Because adolescents with high SepAD symptoms are characterized by fear of unfamiliar people and settings, the relatively high levels of perceived parental support may indicate that these adolescents cling to their parents instead of going through normal processes of separation and individuation and autonomy development. Therefore, even though our results may seem to suggest better developmental outcomes for adolescents in the at-risk developmental profiles regarding substance use and parenting, this does not necessarily have to be the case when considering normal developmental tasks and challenges during adolescence.
Limitations and directions for future research
Our results should be considered in light of some limitations. First, this study does not allow for any conclusions on direction of effects, because the longitudinal approach in this study merely focused on the overlapping development between adolescent anxiety disorder symptoms and different psychosocial outcomes and not on predictors or consequences of adolescent anxiety disorder symptoms. Future research should further examine potential predictors and consequences of adolescent anxiety disorder symptom development. Second, even though this study provides a unique longitudinal insight into adolescent development of anxiety disorder symptoms over 8 years in an adolescent sample from the general community, this study was conducted with a relatively small sample size (N = 239) and even smaller subgroups of adolescents (i.e., normal and at-risk groups); thus, future research with a larger sample is suggested. Although small sample sizes make it more difficult to find statistically significant results (especially in respect to the survival analysis that was conducted for cannabis initiation), we did find statistically significant effects in the expected directions, which suggests that our results are likely to be trustworthy.
Third, sample size and model selection criteria are important issues in semiparametric growth modeling, such as LCGA, influencing how many distinct groups of individuals are found. Larger sample sizes, as well as more tolerant model selection criteria, often result in more distinguished groups of individuals. Our rather stringent model selection procedure suggested that two groups of adolescents (stable high and stable low) fitted our relatively small sample size best for most anxiety disorder symptoms, in contrast to a four-group result (stable high, stable low, increasers, and decreasers) consistent with theoretical predictions (Weems, Reference Weems2008) and some previous studies (e.g., Feng et al., Reference Feng, Shaw and Silk2008). Although we were able to distinguish between more groups of adolescents (including those with increasing and decreasing anxiety disorder symptoms over time), these groups did not provide a statistically significant better fit to our data. With more tolerant model selection criteria (such as using only the BIC, as done by Feng et al., Reference Feng, Shaw and Silk2008) and/or a larger and more ethnically diverse sample, we might have been able to conclude that an LCGA solution including increasers and decreasers would have fitted our data better. Thus, sample size and model selection criteria are important issues to be considered in future research using semiparametric growth modeling.
Fourth, another limitation is our sole reliance on adolescent self-reports. A multiple-informant approach, such as including parent reports or observations, could provide additional information regarding the development of adolescent anxiety disorder symptoms and their association with other psychosocial developmental outcomes. However, adolescents appear to be better judges of their own anxiety disorder symptoms than are parents (Cosi, Canals, Hernández-Martinez, & Vigil-Colet, Reference Cosi, Canals, Hernández-Martinez and Vigil-Colet2010; Stallings & March, Reference Stallings, March and March1995), and, therefore, adolescent self-reports are essential in examining anxiety disorder symptom development. A multiple-informant and multimethod approach could provide important additional information on the researched issues in future research, however, especially with regard to the association between adolescent self-reported anxiety disorder symptoms and other psychosocial outcomes.
Our mere focus on neuroticism as a measure of adolescent personality could be considered another limitation of our study, because personality traits other than neuroticism may show very interesting relationships with anxiety disorder symptoms. However, in relation to our aim of validating the normal and at-risk developmental profiles, neuroticism seems to be the best choice for a personality trait because of its strong relationship with anxiety disorder symptoms. Similarly, our focus on cannabis initiation as a measure of substance use may be considered to be a limitation of our study, because initiation only covers part of cannabis use. It would have been interesting to combine an examination of cannabis initiation in relation to anxiety disorder symptoms with other measures of cannabis use, such as quantity or persistence of use over time. However, we believe that even though our in-depth understanding of adolescent cannabis use was limited by our study's methods, cannabis initiation (which contains both elements of normal adolescent engagement in risk behavior and normal adolescent exploration and experimentation as well as elements of positive peer interaction and social adjustment) by itself is an interesting and important correlate to examine in relation to distinct anxiety disorder symptoms (which is underlined by our results in relation to SAD). In a similar vein, parenting dimensions other than support may be interesting for future research to examine in relation to anxiety disorder symptom dimensions.
Furthermore, we anticipate that there may be concerns regarding the interpretation of our findings on the relation between anxiety disorder symptoms and cannabis initiation because of the rather complex Dutch policies regarding cannabis use in the Netherlands. However, even though Dutch policies could be considered to be rather permissive in comparison to many other countries, nationally representative numbers in the Netherlands suggest that Dutch adolescents’ cannabis use (ages 15–16) is not above average compared to other European countries and even lower than, for example, cannabis use in the United States (Van Laar et al., Reference Van Laar, Cruts, Van Ooyen-Houben, Meijer, Croes and Brunt2011). Therefore, the results of this study may also apply to adolescents in other Western countries.
Finally, we have not focused on sex differences in the associations between normal and at-risk developmental profiles of anxiety disorder symptoms and psychosocial developmental outcomes, because of relatively small sample sizes for some of the anxiety disorder symptom dimensions that would create estimation difficulties. However, future research that employs larger samples could analyze the potential effects of sex when relating anxiety disorder symptoms (either dimensionally or categorically in normal and at-risk developmental profiles) to other psychosocial developmental outcomes.
Conclusion
The results from this study have demonstrated different age-related normative developmental changes during adolescence for different anxiety disorder symptoms, emphasizing the importance of distinguishing between separate dimensions of anxiety disorder symptoms in contrast to examining adolescent anxiety problems as a general construct. Our results further suggest that anxiety disorder symptoms represent normal and transient developmental phenomena in most adolescents. However, for a minority of adolescents, anxiety disorder symptoms represent serious and persistent problems. These problems are not only limited to the persistence of high levels of anxiety disorder symptoms and increased risk for developing full-blown anxiety disorders but are also related to dysfunction in other areas of psychosocial development, such as personality and identity development. However, as problematic as high and persistent levels of certain anxiety disorder symptoms clearly are according to most of our results, we also found some evidence that high levels of anxiety are not “all bad”; for example, they may prevent socially anxious adolescents from engaging in risky behaviors such as early cannabis initiation.