1 Introduction
Spray cooling is a process capable of achieving a very high, nearly uniform heat flux and therefore high cooling performance. Spray cooling is used in various industrial applications, like cooling of micro-chips and other high powered electronics or electrical parts (Mudawar Reference Mudawar2001; Bar-Cohen, Arik & Ohadi Reference Bar-Cohen, Arik and Ohadi2006; Ebadian & Lin Reference Ebadian and Lin2011), cooling of metal products in metallurgy during quenching processes, in metalworking (Chen & Tseng Reference Chen and Tseng1992), cooling of tools for hot forging (Pola, Gelfi & La Vecchia Reference Pola, Gelfi and La Vecchia2013), of solar panels (Nižetić et al. Reference Nižetić, Čoko, Yadav and Grubišić-Čabo2016; Sargunanathan, Elango & Mohideen Reference Sargunanathan, Elango and Mohideen2016) and in many other technological processes.
The phenomena of spray impingement onto a very hot substrate can be significantly influenced by the wall temperature since the flow generated by each drop impact is influenced by various micro-scale thermodynamic effects, governed by an intensive evaporation. The hydrodynamics and heat transfer during single drop impact onto a heated wall have been intensively investigated (Chandra & Avedisian Reference Chandra and Avedisian1991; Bernardin, Stebbins & Mudawar Reference Bernardin, Stebbins and Mudawar1997; Bertola Reference Bertola2015; Staat et al. Reference Staat, Tran, Geerdink, Riboux, Sun, Gordillo and Lohse2015). The regimes of single drop impact observed in the experiments include single phase cooling, nucleate boiling, transition regime, thermal atomization (Roisman, Breitenbach & Tropea Reference Roisman, Breitenbach and Tropea2018) and film boiling, if the wall temperature rises above the Leidenfrost condition.
A detailed review of the current state of the art in the field of spray cooling can be found in Kim (Reference Kim2007), Cheng et al. (Reference Cheng, Zhang, Chen and Hu2016), Liang & Mudawar (Reference Liang and Mudawar2017a ,Reference Liang and Mudawar b ) and Breitenbach, Roisman & Tropea (Reference Breitenbach, Roisman and Tropea2018). Many studies deal with the influence of different parameters on the performance of spray cooling. These studies are mostly focused on the determination of the critical (maximum) heat flux and on obtaining the boiling curves, which describe the dependence of the heat flux on the substrate temperature. An example for empirical correlations can be found in Mudawar & Deiters (Reference Mudawar and Deiters1994). Among the governing parameters are spray properties, such as droplet velocity, droplet diameter, mass flux density, or liquid properties (Estes & Mudawar Reference Estes and Mudawar1995; Yang, Chow & Pais Reference Yang, Chow and Pais1996; Chen, Chow & Navedo Reference Chen, Chow and Navedo2002; Puschmann & Specht Reference Puschmann and Specht2004; Wendelstorf, Spitzer & Wendelstorf Reference Wendelstorf, Spitzer and Wendelstorf2008). Moreover, experiments of Cebo-Rudnicka, Malinowski & Buczek (Reference Cebo-Rudnicka, Malinowski and Buczek2016) with different target materials demonstrated that the heat transfer is influenced also by the thermal conductivity of the surface.
Most of the models for the heat flux and for the critical heat flux are completely empirical. The main goal of the present study is to develop a predictive theoretical model for fast transient cooling of a very hot thick substrate by spray impact based on the identification of the main influencing physical parameters. These influencing parameters are different for the film boiling regime and for the nucleate boiling regime.
The model is developed using measurements of heat flux during impingement of an accurately characterized spray onto a initially heated target, whose thickness is much thicker than the thickness of the thermal boundary layer which develops in the substrate. The temperature and the heat flux measurements are accompanied by high-speed visualizations of an impacting spray at different time instants, which allows us to identify various hydrodynamic and thermodynamic regimes of the spray cooling process.
A one-dimensional model for heat transfer associated with spray cooling is developed which accounts for the development of the thermal boundary layer in the substrate. A remote asymptotic solution for the heat flux is developed for the heat flux in the fully developed nucleate boiling regime when the entire substrate surface is covered by a thin liquid film. The theoretical predictions the heat flux agree very well with the experimental data. The model accounts for different spray fluids, but it is only validated for water sprays having different fluid temperatures.
2 Experimental methods
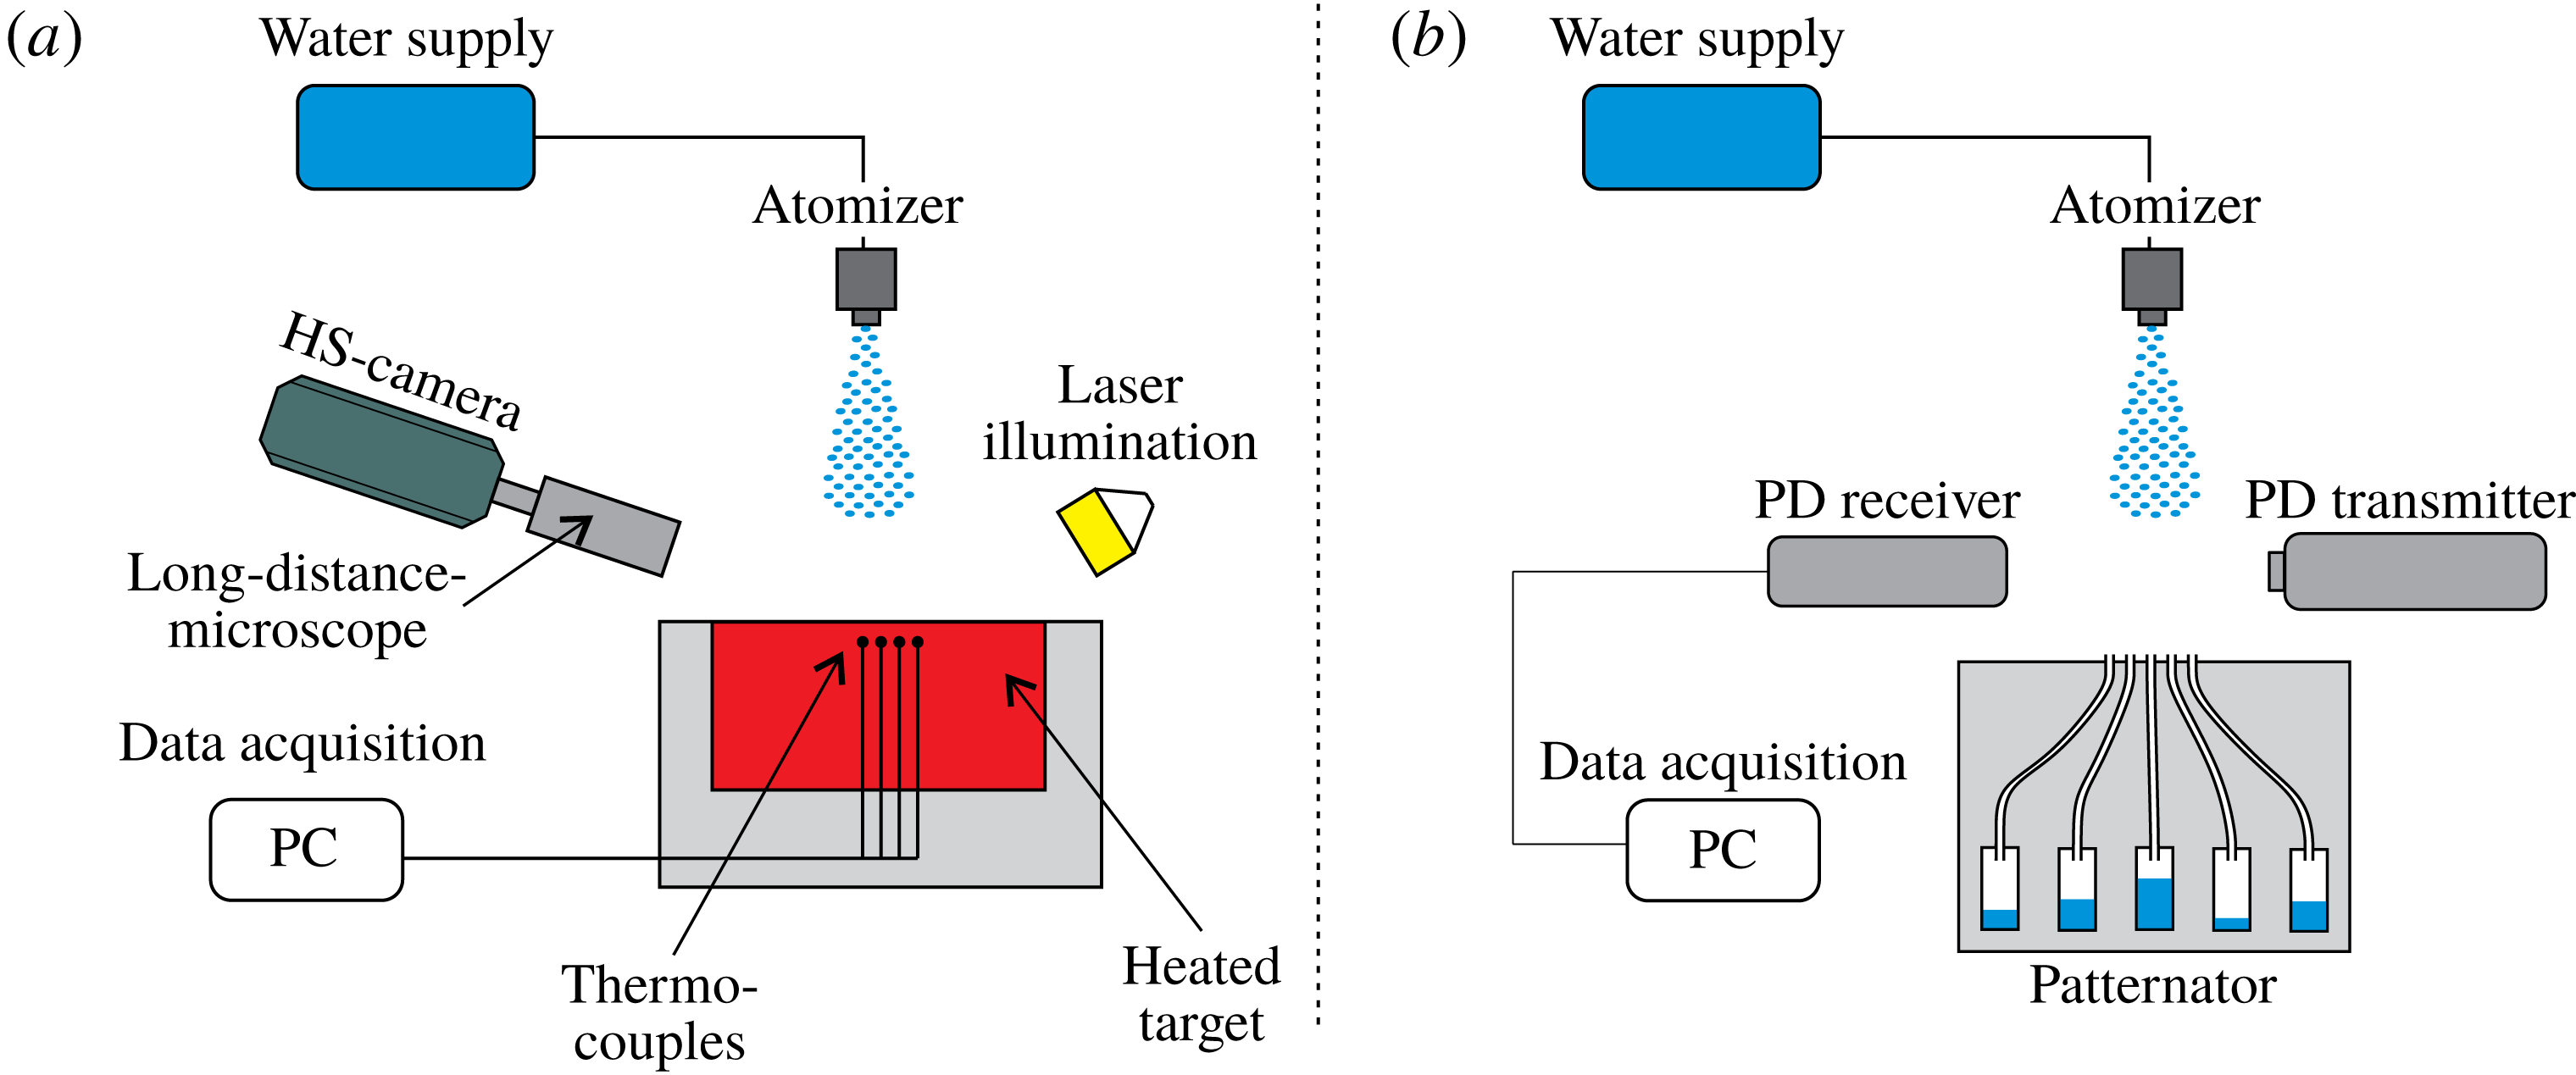
The experimental set-up designed for spray cooling experiments consists of six main systems, as shown in figure 1: a water supply system, heated target, temperature measurement and control system, spray characterization system, optical observation system and data acquisition system.
Schematic of experimental set-up. (a) Heat flux measurements with thermocouples and visualization with high-speed (HS) camera. (b) Spray characterization with phase Doppler measurement system and patternator. PC, personal computer; PD, phase Doppler.

A conventional pressure driven, full-cone atomizer is supplied with water, purified by a reverse osmosis device, from a pressurized tank. By adjusting the distance between the nozzle and the heated surface, and varying the pressure supplied to the nozzle, sprays of different properties upon impact can be generated. The resulting spray is described by the local properties: mass flux density
 ${\dot{m}}$
, mean drop diameter
 $D_{10}$
and mean drop velocity
 $U$
.
The heated surface of the spray impact target is the top end of a circular cylinder (diameter
 $d=100~\text{mm}$
and height
 $h=53.2~\text{mm}$
) built of stainless steel (1.4841). The target is heated by four cartridge heaters with an overall power of
 $2~\text{kW}$
. All of the heaters are placed in a copper disc which is screwed to the bottom of the cylinder. The side and bottom of the target are insulated in order to assume that heat transfer only occurs through the top surface. The target is placed in a water resistant housing. The average roughness of the impinging surface is
 $0.03~\unicode[STIX]{x03BC}\text{m}$
. The set-up is designed for surface temperatures up to
 $500\,^{\circ }\text{C}$
.
The temperature just below the substrate surface is monitored using eight thermocouples (type K, class 1, isolated,
 $0.5~\text{mm}$
diameter) embedded inside the test specimen. Six of them are located in two rows (three each row)
 $0.5~\text{mm}$
and
 $3.5~\text{mm}$
below the impingement surface. Their radial spacing is
 $1.75\,\text{mm}$
and the first is placed in the centre of the circular target.
For control of the heating system two thermocouples are installed at the bottom and in the middle of the specimen. All thermocouples are placed inside holes with
 $0.6~\text{mm}$
diameter, which were produced using spark erosion. To ensure good thermal contact between the thermocouples and the material they are bonded inside the holes with a thermally high conductive adhesive (Aremco Ceramabond 569).
To evaluate the response time, a thermocouple was immersed from ambient air into water having a temperature of
 $80\,^{\circ }\text{C}$
and the time until the temperature readings showed
 $90\,\%$
was measured. The quantified response time is in the range of
 $0.8~\text{s}$
. This time is independent of the temperature increment.
The instantaneous radial temperature distribution in the target, the local heat flux and the target surface temperature (where direct measurements are not possible) are computed by solving the two-dimensional inverse heat conduction problem, using the thermocouples as input data. The solution is obtained using an analytical approach and a code published by Woodfield, Monde & Mitsutake (Reference Woodfield, Monde and Mitsutake2006). The solution is based on solving the second-order partial differential equation for heat conduction using a Laplace transform technique.
The observation system consists of a high-speed camera (Phantom v12.1 with the frame rate of
 $55\,000~\text{f.p.s.}$
) equipped with a Questar QM-100 long distance microscope and a pulsed Cavilux HF laser (pulse duration is
 $400~\text{ns}$
) backlight used as an illumination source. The field of view is approximately 3 mm in width at a resolution of
 $384\times 240~\text{px}$
. The visualization and heat flux measurements are temporally matched and therefore visual observations can be directly associated with the instantaneous local heat flux and target surface temperature.
The main spray properties are accurately characterized using a phase Doppler instrument (Dantec Dynamics, Dual – Mode) for measurements of the distributions of the drop diameter and two components of the drop velocity in the spray. Phase Doppler data are acquired under free-stream conditions without the presence of the target. A custom built patternator is used for measurement of the spatial distribution of the local mass flux density of the spray. The patternator collects the spray in 17 small tubes of inner diameter of
 $4~\text{mm}$
placed in a row at a distance of
 $6~\text{mm}$
from one another. Similar devices are described in Lefebvre (Reference Lefebvre1988). The orifices of the tubes are positioned at the top surface of a bluff body having the same dimensions as the heated target to ensure the same airflow encountered during cooling experiments. The high spatial resolution resolves inhomogeneities of the spray, providing the local mass flux density at the position where the heat flux measurements have been computed.
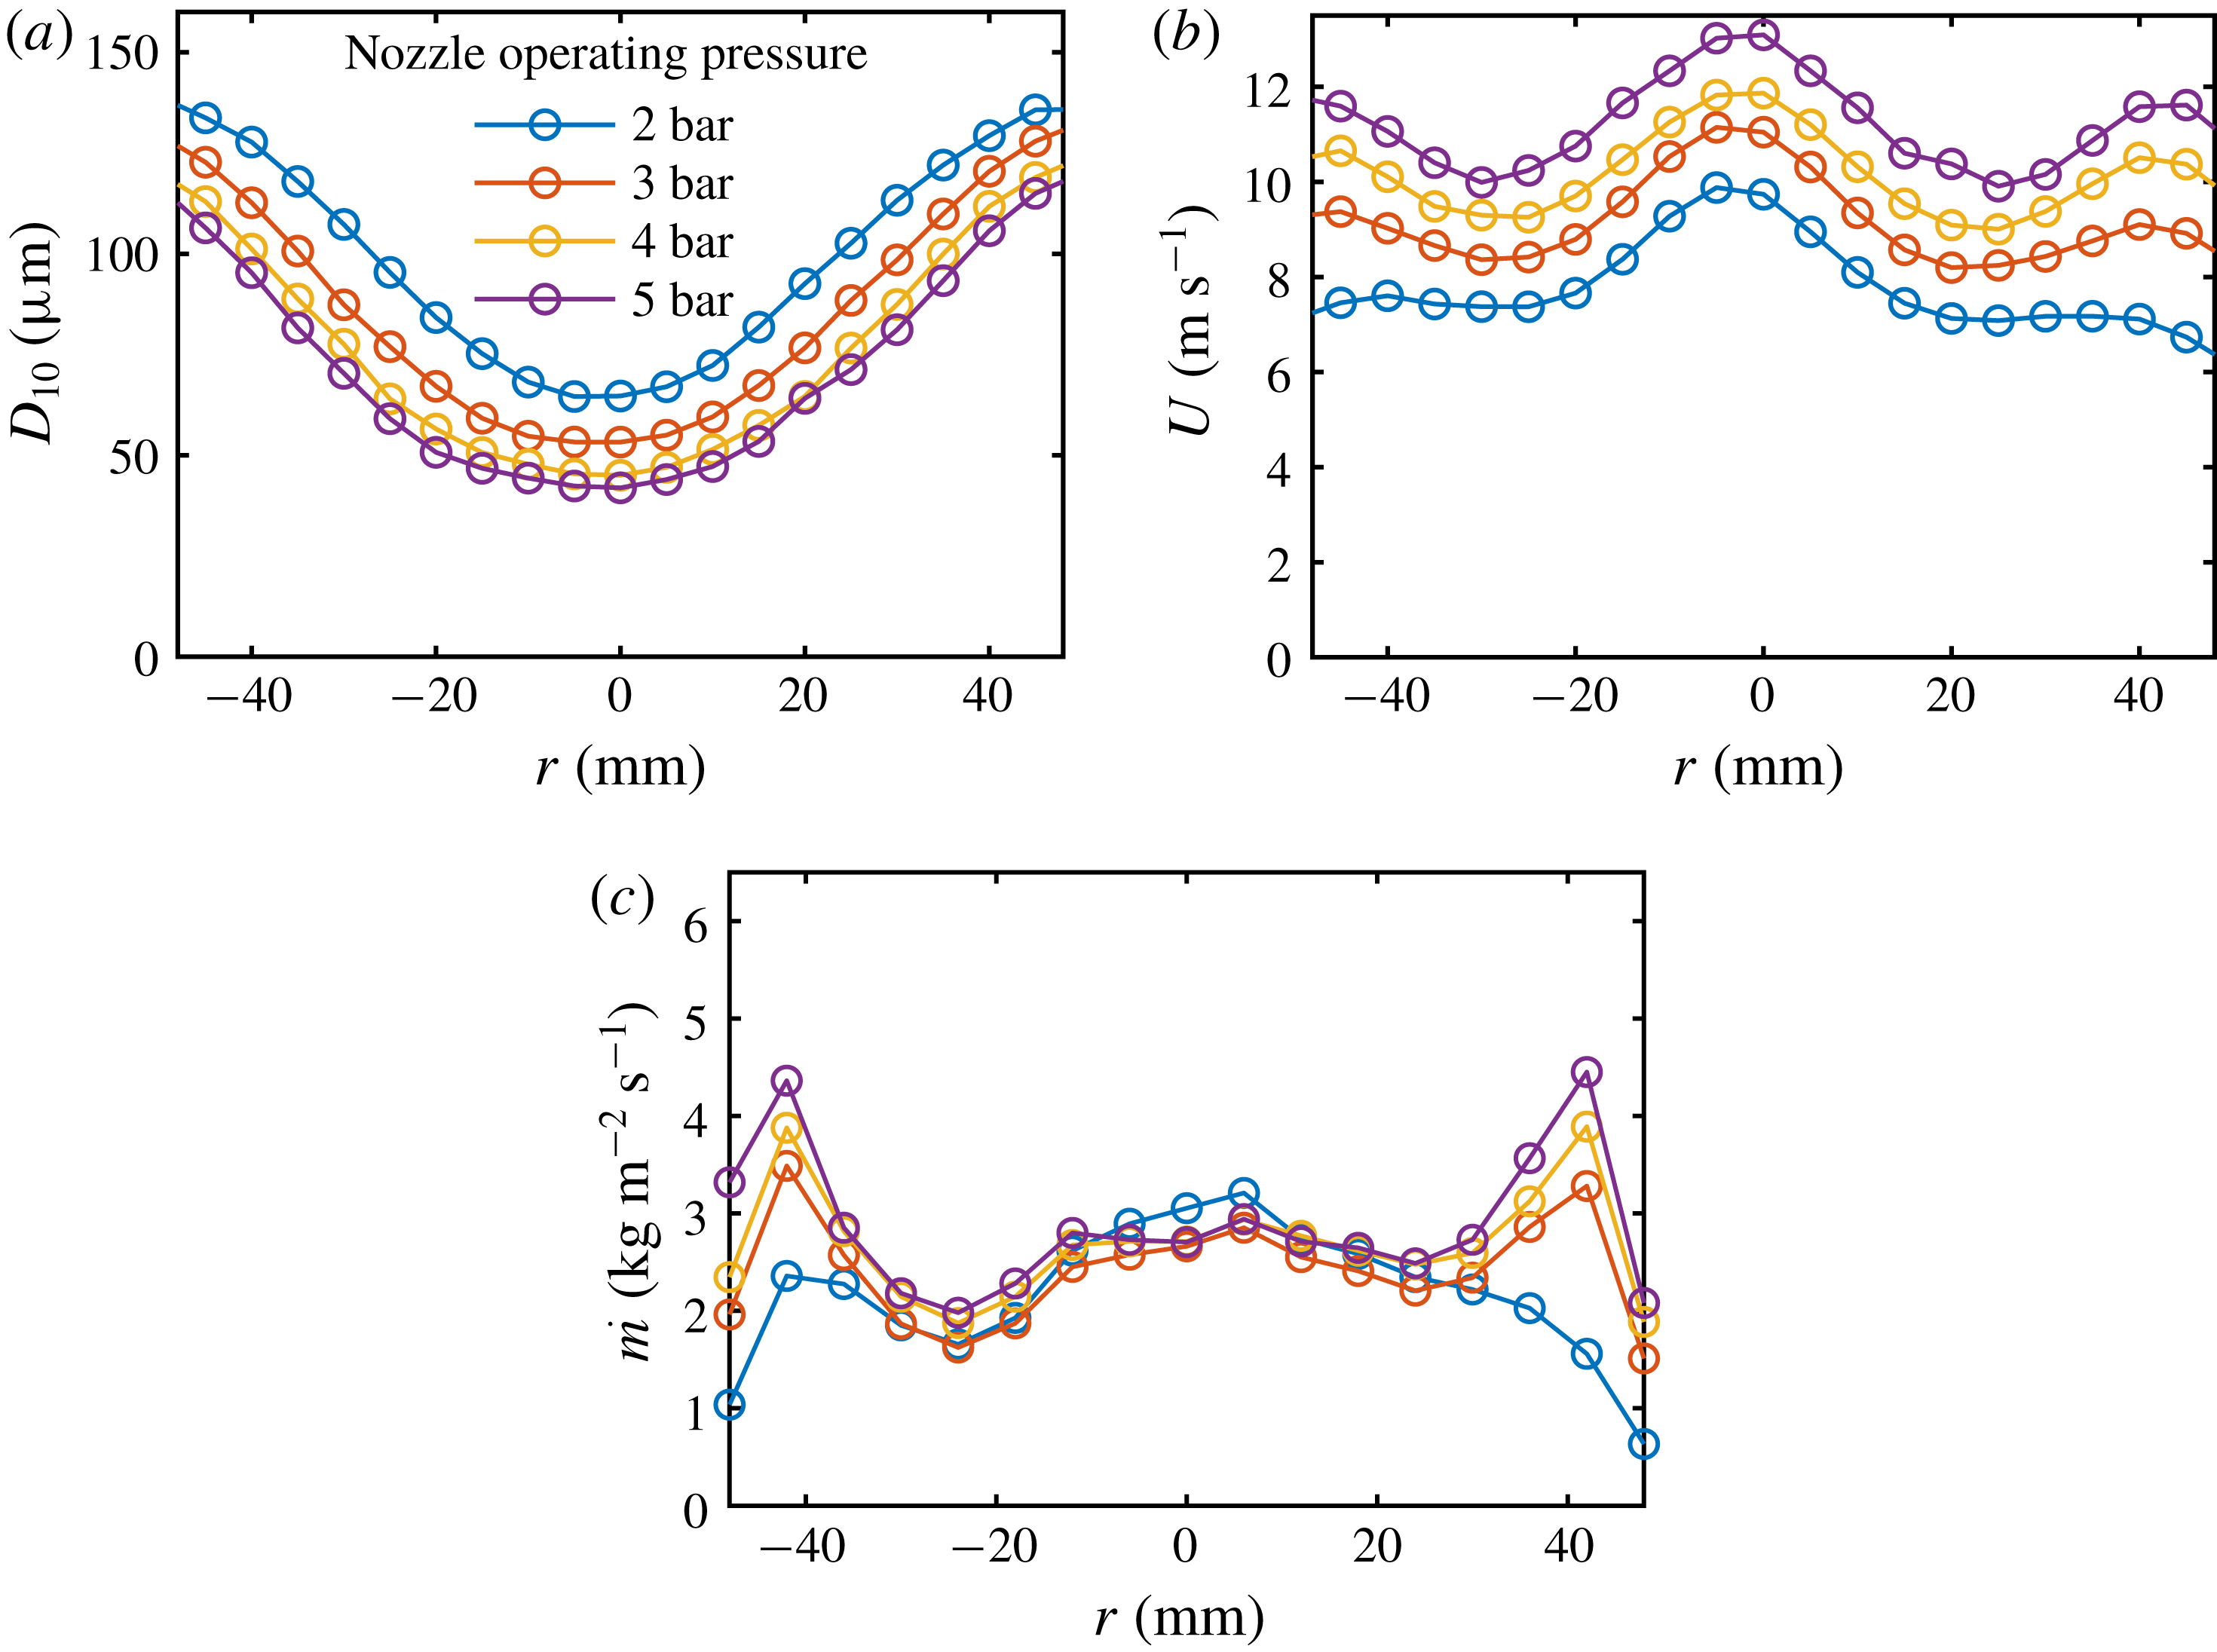
Mean drop diameter (
 $D_{10}$
), mean axial velocity of drops (
 $U$
) in the impacting spray and the axial mass flux
 ${\dot{m}}$
as a function of radial position. Position
 $r=0~\text{mm}$
corresponds to the axis of the nozzle orifice.

In figure 2 the mean drop diameter
 $D_{10}$
, the mean impact velocity
 $U$
and the local mass flux density
 ${\dot{m}}$
are shown at
 $100~\text{mm}$
from the nozzle as a function of the radial coordinate
 $r$
. The position
 $r=0$
corresponds to the axis of the nozzle. As expected, the average drop diameter reaches a minimum at the axis and decreases for higher injection pressures. The average drop velocity is maximum at the axis.
It is interesting that the mass flux density at the centre depends only weakly on the injection pressure. For the nozzles used in the experiments the pressure influences mainly the flux distribution in the outer ring of the spray cross-section. In these experiments the magnitude of the mass flux density is varied by changing the distance between the nozzle and the cooling target and the injection pressure.
The gradients of the main spray integral properties near the centre are rather small. The spray near the axis on a spot of radius
 $5{-}10~\text{mm}$
can be considered as nearly uniform.
Since the phase Doppler measurements were performed in the absence of the target, the question arises whether these free-stream results are comparable to those in presence of the heated target. For that reason we performed additional measurements in the presence of a bluff body having the same dimensions as the heated target. The measurement plane was located
 $10~\text{mm}$
above the surface of the target. During data processing we included only those droplets having a mean velocity in the downward direction, to exclude those droplets that had already impacted at the surface and rebounded. In an exemplary case the integral spray characteristics are for free-stream conditions:
 $D_{10}=59~\unicode[STIX]{x03BC}\text{m}$
and
 $U=9.6~\text{m}~\text{s}^{-1}$
. Due to the presence of the bluff body the values changed to:
 $D_{10}=81~\unicode[STIX]{x03BC}\text{m}$
and
 $U=9.7~\text{m}~\text{s}^{-1}$
. Especially the small droplets are affected by the displacement of the target resulting in the higher
 $D_{10}$
, since only a smaller portion of them reach the surface. However, because the largest influence on the heat flux is the mass flux density and the previously mentioned differences are rather small, we conclude that it is reasonable to use the droplet diameter and velocity acquired under free-stream conditions as input data for the present work. Perhaps even more significant is however the fact that the measurement of the mass flux density using the patternator does mimic exactly the conditions prevailing with the heated target.
3 Measurements of the heat flux
In many studies of heat transfer, in order to evaluate the boiling curve, the set-up is designed to keep the substrate temperature constant. In this study the effect of the transient phenomena is investigated, since this situation is relevant to many industrial applications mentioned in the introduction section.
Therefore, the target is initially heated until it achieves a given practically uniform initial temperature. The spray parameters are kept constant during the entire experiment. The influence of the start-up phase during the initial development of the spray is avoided by using a shutter in front of the nozzle. The experiment is started only when the spray is fully developed and the target is heated uniformly. At the instant
 $t=0$
the heating of the target is switched off simultaneously with the opening of the spray shutter. At this instant the substrate temperature starts to change due to the heat flux associated with spray impact.
The typical evolution of the temperature field inside the substrate, the surface temperature and the heat flux is illustrated in figures 3–5. The initial wall temperature is
 $450\,^{\circ }\text{C}$
. The spray parameters for this case are:
 ${\dot{m}}=2.9~\text{kg}~\text{m}^{-2}~\text{s}^{-1}$
,
 $D_{10}=55~\unicode[STIX]{x03BC}\text{m}$
and
 $U=10.3~\text{m}~\text{s}^{-1}$
.
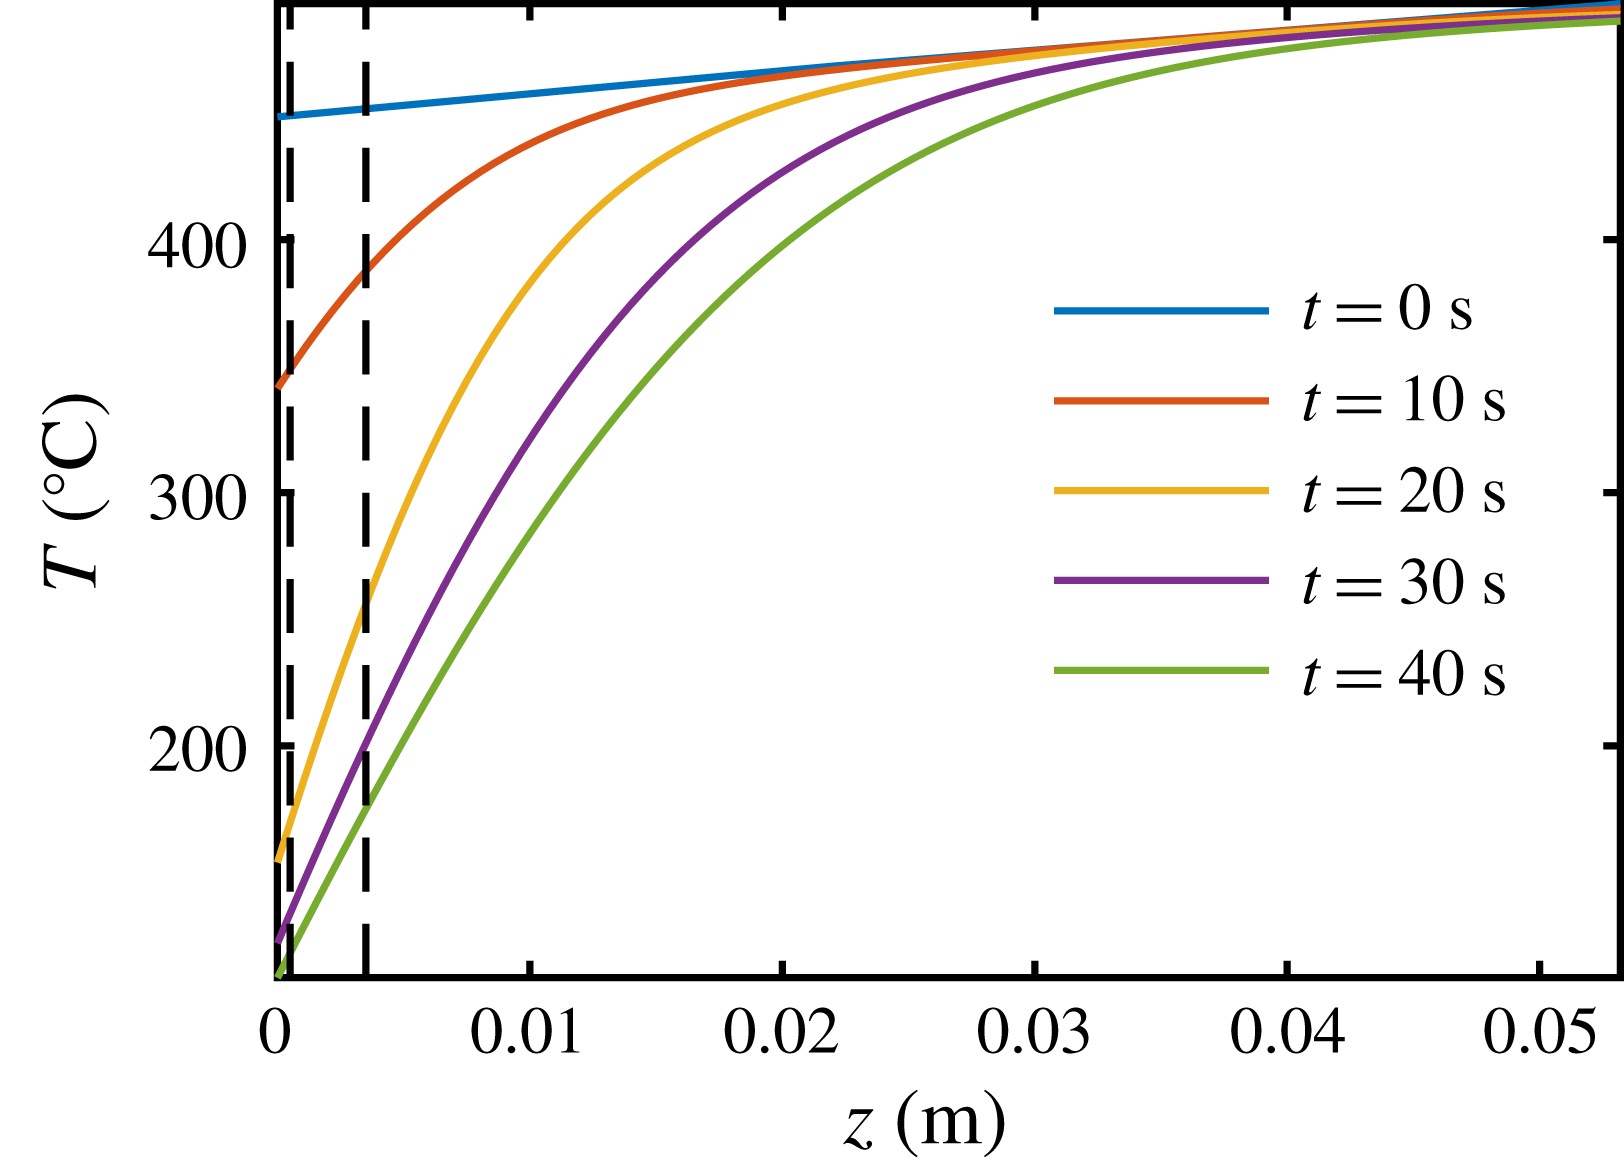
The evolution of the temperature profiles
 $T(z)$
, calculated by solving the inverse heat conduction problem, is shown in figure 3 for different times
 $t$
. The
 $z$
coordinate coincides with the spray axis while the position
 $z=0$
corresponds to the wall surface, where the spray impact takes place. The bottom of the heated plate corresponds to
 $z=53.2~\text{mm}$
.
The vertical dashed lines in figure 3 indicate the position of the thermocouples at
 $z_{1}=0.5~\text{mm}$
and
 $z_{2}=3.5~\text{mm}$
. The temperature measurements of the thermocouples are used as the input data in the solution of the inverse heat conduction problem.
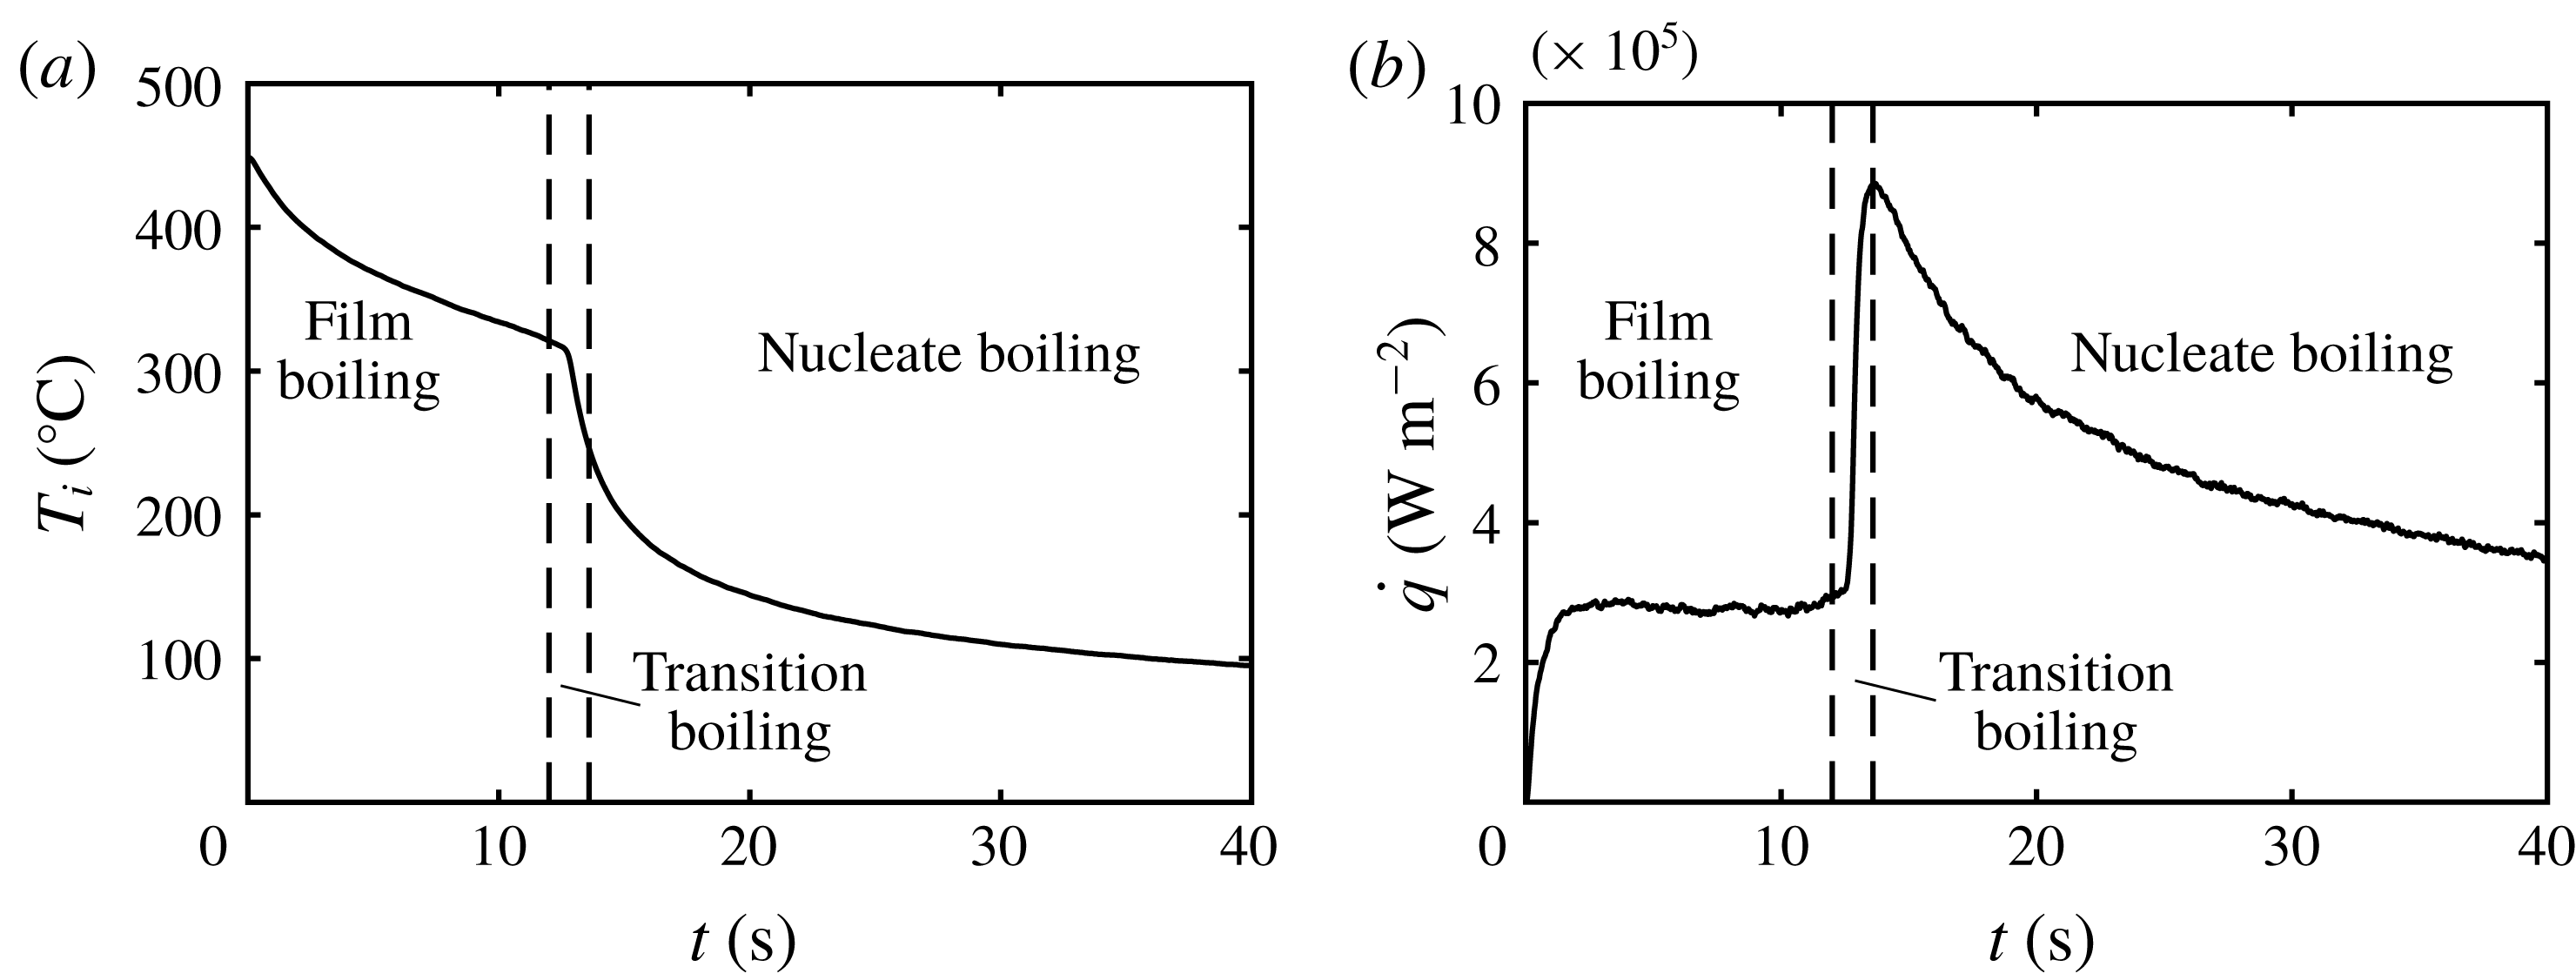
The corresponding time series of the surface temperature and heat flux are plotted in figure 4. The vertical dashed lines in figure 4 correspond to the bounds of the boiling regimes: film boiling, transition boiling and nucleate boiling regime, which are described in more detail in figures 5 and 6.
Calculated temperature
 $T$
inside the substrate as a function of the depth
 $z$
for different times
 $t$
. The dashed lines indicate the position of the thermocouples at
 $z_{1}=0.5~\text{mm}$
and
 $z_{2}=3.5~\text{mm}$
.

Typical temporal evolution of the surface temperature
 $T_{i}(t)$
and instantaneous local heat flux
 $\dot{q}(t)$
. The vertical dashed lines indicate the boundaries between the film boiling, transition and nucleate boiling regimes.

Spray cooling regimes at different surface temperatures
 $T_{i}(t)$
around the Leidenfrost point. (a) Measured heat flux
 $\dot{q}$
as a function of surface temperature
 $T_{i}$
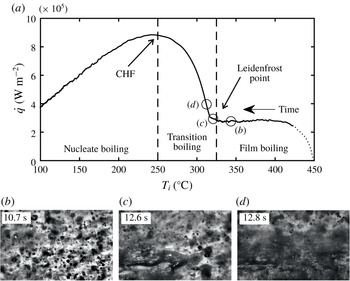
; (b) visualized spray impact in the film boiling regime; (c) at the Leidenfrost point, characterized by the first appearance of liquid patches; and (d) the fast expansion of the liquid spots and increased influence of nucleate boiling. The videos of the spray impact at different time instants are provided in the supplementary material. CHF, critical heat flux.

In figure 5 the instantaneous local heat flux
 $\dot{q}(t)$
in the central area of the target and spray is plotted as a function of the surface temperature
 $T_{i}(t)$
for the same experimental data, whereby time
 $t$
increases following the curve to the left.
The precision of the thermal measurements at the initial stage of cooling is not high and this is caused by the very high temperature gradients during the initial fast temperature changes. The rise time of the thermocouples is not short enough and the thermal inertia of the material between the tip of the thermocouple and the surface is too high to precisely capture these fast temperature changes. This part of the plot, where the measurement precision is not well quantified, is indicated here and in the following figures by a dotted curve.
In figure 5(b–d) images of spray impact and hydrodynamic phenomena at the surface captured at different instants after the spray cooling begins are shown. The time instants chosen for these images are marked on the graph in figure 5(a). The corresponding movie of spray impact is provided in the supplementary material available at https://doi.org/10.1017/jfm.2019.743.
The hydrodynamic phenomena visualized in figure 5(b–d) are each different, since they correspond to different drop and spray impact thermodynamic regimes.
In figure 5(b) each drop impact onto the wall leads to its break up, formation of multiple secondary droplets (Roisman et al. Reference Roisman, Breitenbach and Tropea2018) and rebound. The contact time is short and there is no remaining wetting of the surface. As a result, the heat flux is low, which is typical for the film boiling regime.
At the Leidenfrost point, illustrated in figure 5(c), a few impacting drops start to wet and spread on the surface – a part of the surface is covered by initial liquid patches.
Phenomena of spray impact regimes at different surface temperatures
 $T_{i}(t)$
. (a) Measured heat flux
 $\dot{q}$
as a function of surface temperature
 $T_{i}$
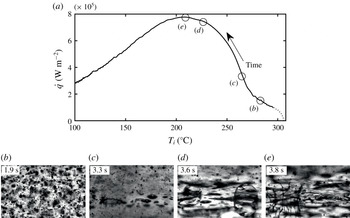
; (b) image of the substrate exposed to spray impact in the film boiling regime; (c) inception of the transition regime; (d) image corresponding to the fast expansion of the wetted area; (e) apparently completely wetted surface at the instant corresponding to the critical heat flux. The videos of the spray impact at different time instants are provided in the supplementary material.

At the next instant the area of the wet patches increases, figure 5 d, and the heat flux starts to rapidly increase. These phenomena correspond to the transition boiling regime.
Similar phenomena in the film and transition regimes are observed in figure 6(b) and (c), respectively. The images are of higher contrast, since the mass flux of the spray is smaller in the experiment shown in figure 6. In figure 6(a) the measured heat flux is plotted as a function of the surface temperature measured during continuous spraying. In the illustrated case the spray properties are:
 ${\dot{m}}=0.9~\text{kg}~\text{m}^{-2}~\text{s}^{-1}$
,
 $D_{10}=43~\unicode[STIX]{x03BC}\text{m}$
and
 $U=9.8~\text{m}~\text{s}^{-1}$
. In this example the target is initially heated to a surface temperature of
 $306\,^{\circ }\text{C}$
.
Shortly before the point where the maximum heat flux is achieved a large portion of the surface is wetted by a liquid water film, as shown in figure 6(c). Small nucleation bubbles form, grow and collapse. The heat flux increases significantly, since the wetted area of the substrate increases rapidly. Heat goes into the overheating of the liquid (sensible heat) and into the formation of bubbles.
At the instant corresponding to the critical heat flux, figure 6(d)
 $170\,^{\circ }\text{C}$
, the surface area is almost completely wetted by liquid. The appearance of a corona of an impacting drop is clear evidence that the drop impacts onto a liquid film.
At larger times the substrate is completely covered by a thin boiling liquid film. The film is continuously fed by fresh water from the spray and increases in coverage and depth. The heat flux reduces with time. This regime corresponds to fully developed nucleate boiling of spray cooling.
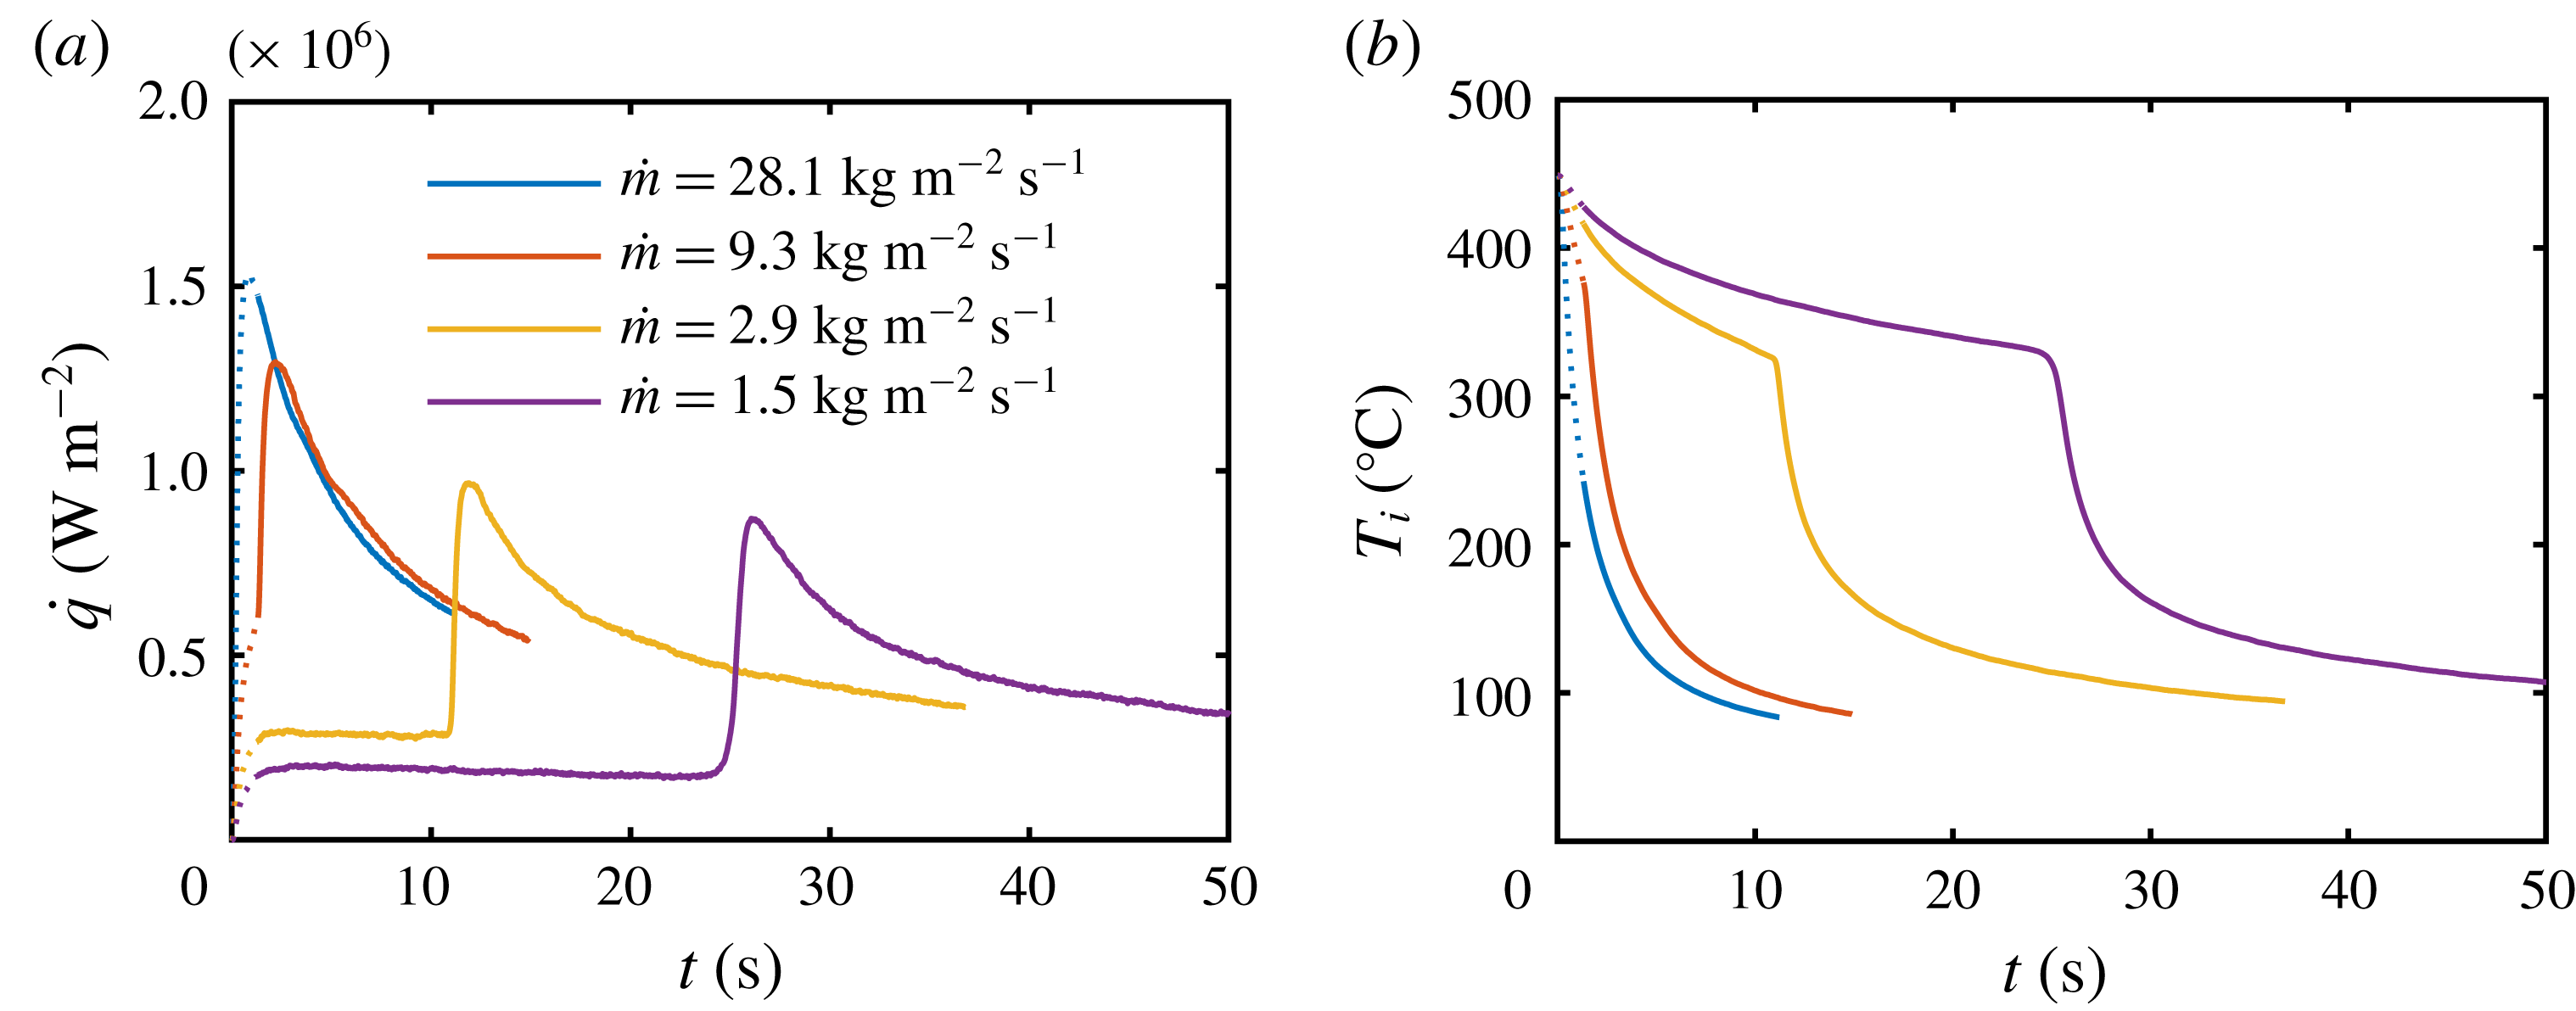
To better understand the influence of the main spray parameters on heat transfer, measurements with different mass flux densities were performed. Figure 7(a) shows the heat flux
 $\dot{q}$
as a function of time
 $t$
for the mass fluxes
 $28.1$
,
 $9.3$
,
 $2.9$
and
 $1.5~\text{kg}~\text{m}^{-2}~\text{s}^{-1}$
. The variation of other spray parameters remain in a relatively narrower range (
 $D_{10}=43{-}52~\unicode[STIX]{x03BC}\text{m}$
and
 $U=11.2{-}17.4~\text{m}~\text{s}^{-1}$
). The initial substrate temperature is
 $450\,^{\circ }\text{C}$
for all the tests in figure 7. The experiments were stopped when the first thermocouple reading reached
 $100\,^{\circ }\text{C}$
. Increasing the mass flux density results in an increased heat flux at all times and boiling regimes. The corresponding surface temperature
 $T_{i}$
as a function of time
 $t$
is shown in figure 7(b).
Influence of different mass flux densities
 ${\dot{m}}$
on: (a) heat flux and (b) surface temperature
 $T_{i}$
dependence on time
 $t$
.

The slopes of the curves are similar, especially in the nucleate boiling regime, and differ mainly at high temperatures between the start of the cooling experiments and the Leidenfrost point. In this region the heat flux is much lower for sparse sprays (
 $1.5$
and
 $2.9~\text{kg}~\text{m}^{-2}~\text{s}^{-1}$
) than for the more dense sprays (
 $9.3$
and
 $28.1~\text{kg}~\text{m}^{-2}~\text{s}^{-1}$
). Moreover, for
 ${\dot{m}}=9.3$
and
 $28.1~\text{kg}~\text{m}^{-2}~\text{s}^{-1}$
no film boiling regime can be identified, since the time of the film boiling regime is very short. This can be explained by the limited response time of the thermocouples which prevents the detection of the Leidenfrost point and film boiling regime in the case of this very fast cooling process.
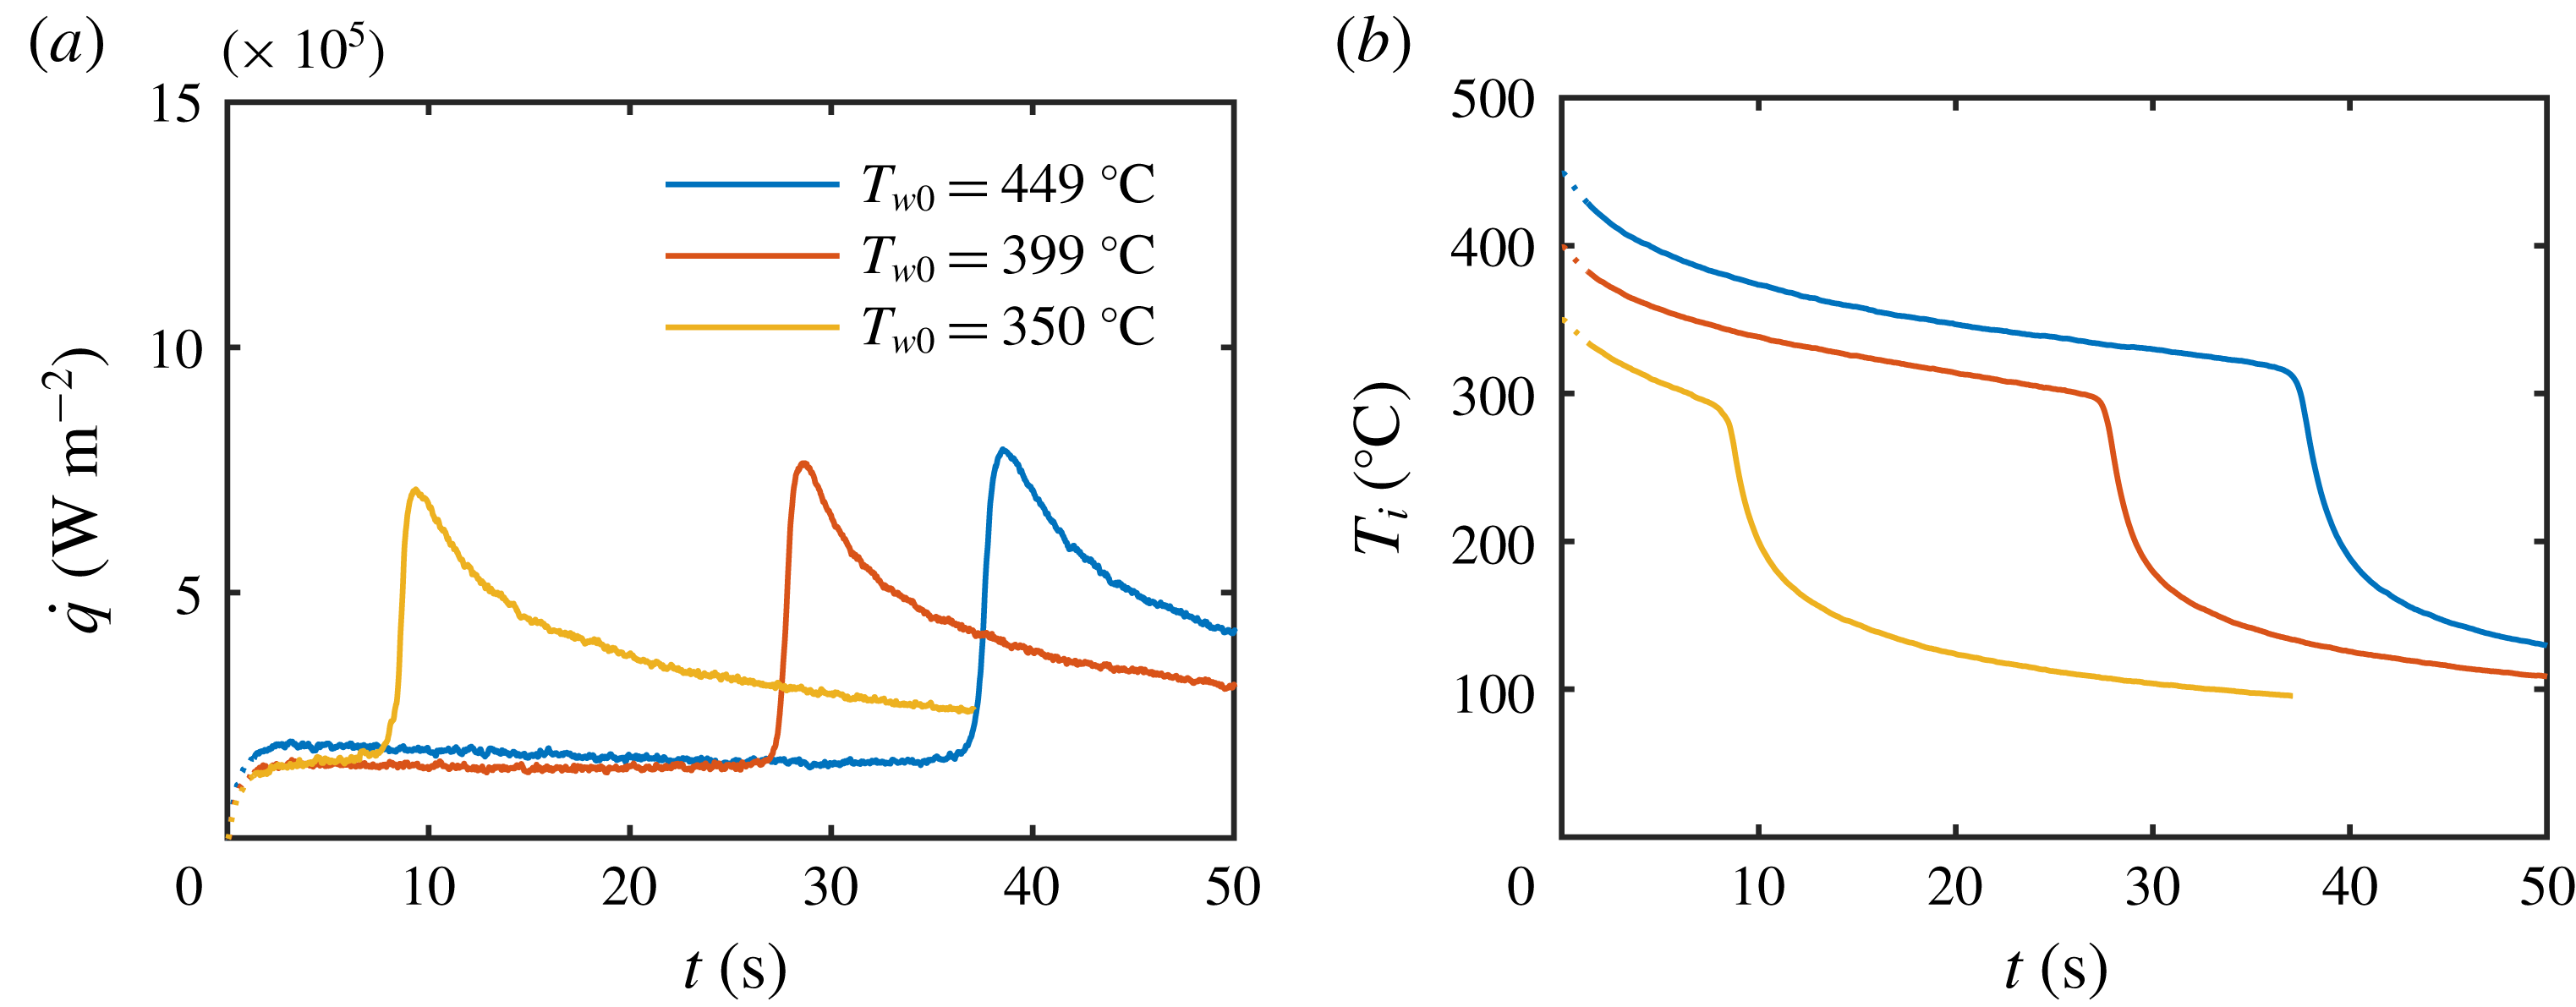
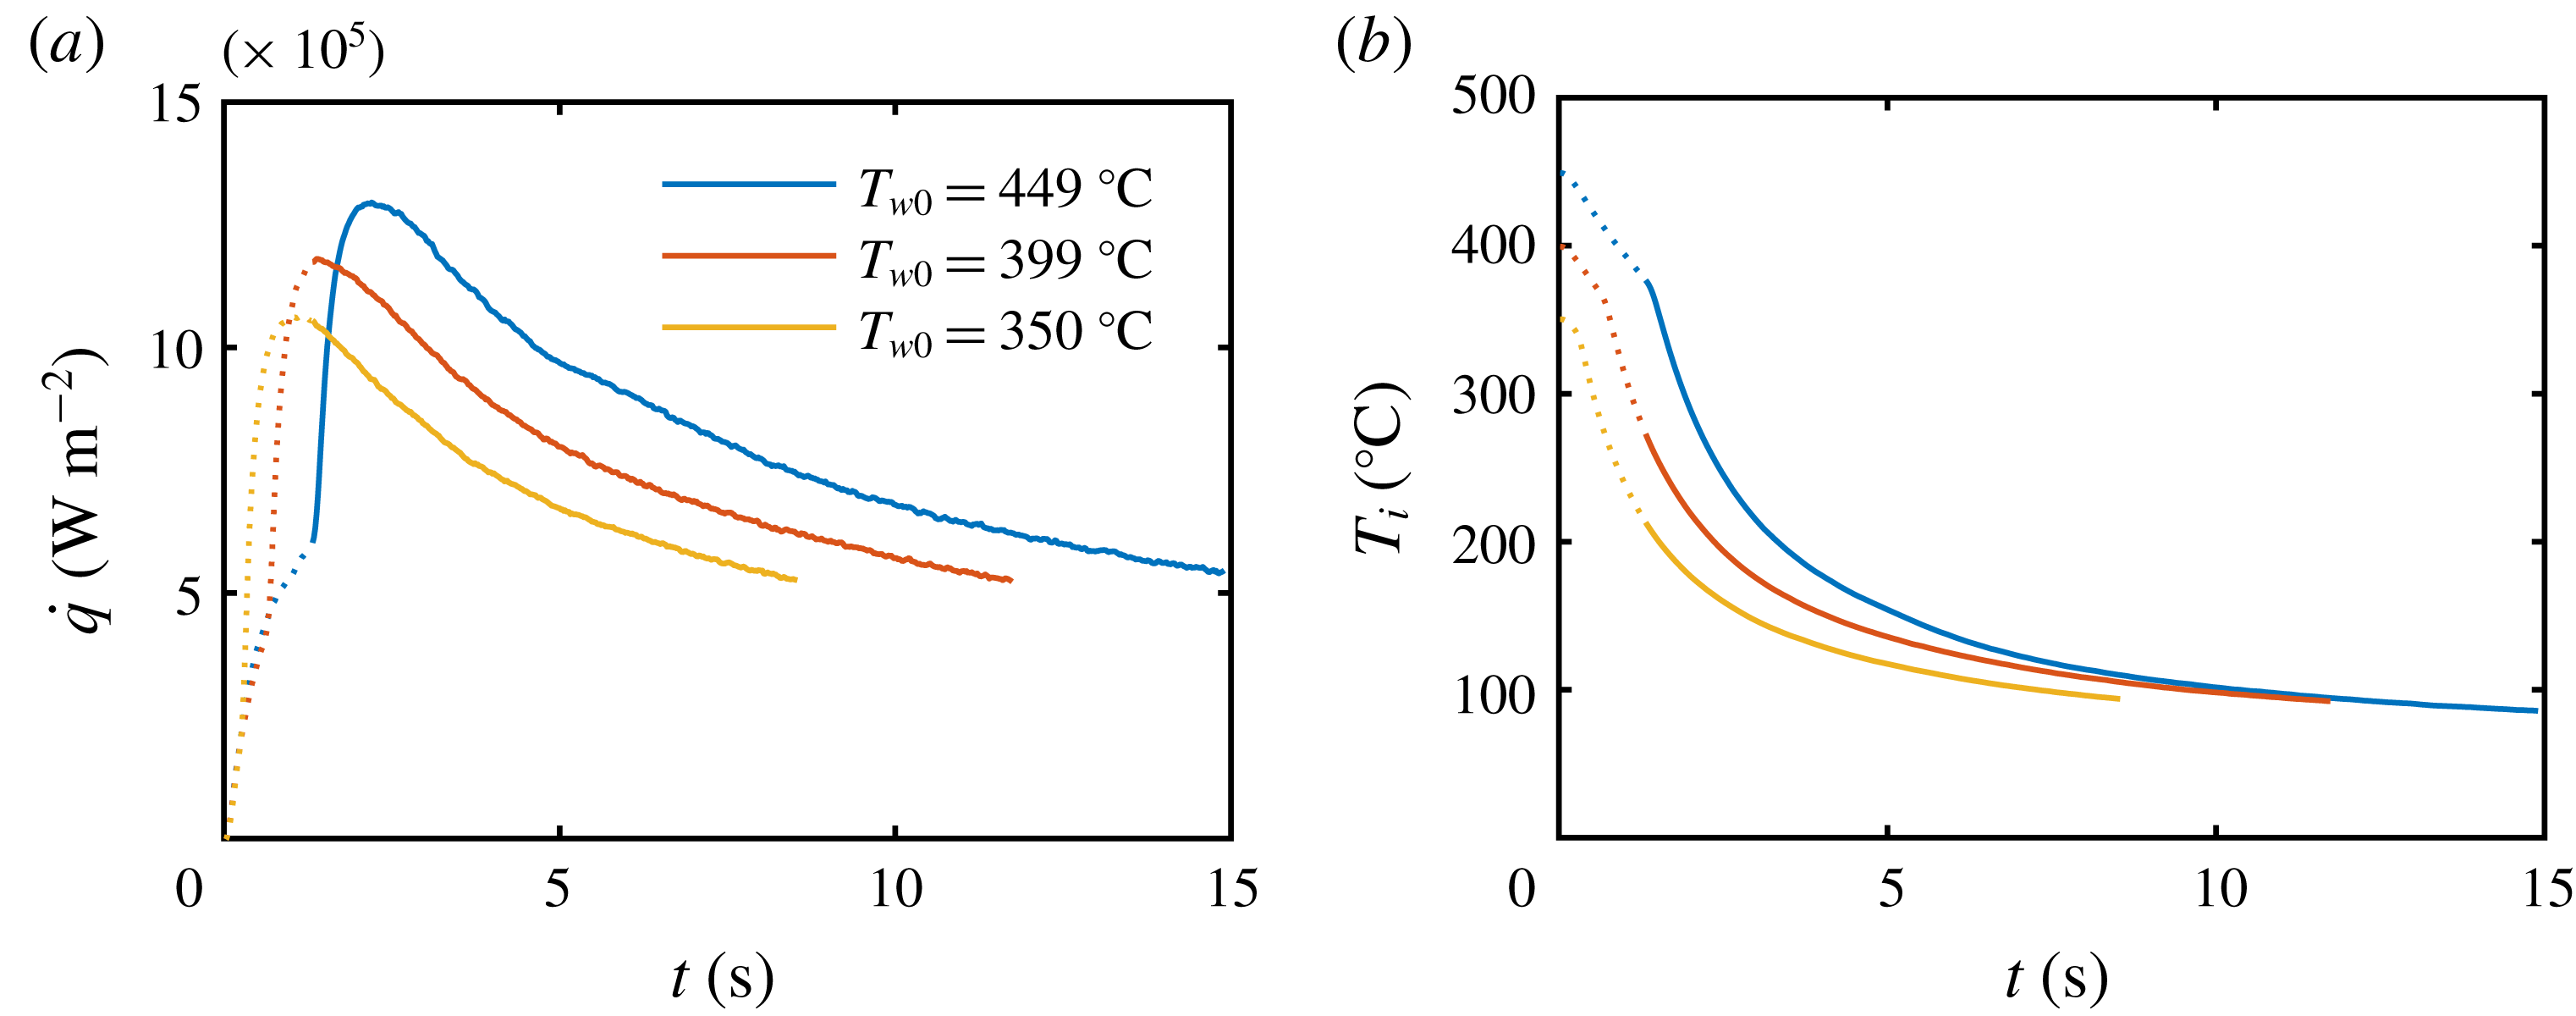
Influence of the initial wall temperature
 $T_{w0}$
on (a) heat flux and (b) surface temperature
 $T_{i}$
dependence on time
 $t$
for a small mass flux density of
 ${\dot{m}}=1.6~\text{kg}~\text{m}^{-2}~\text{s}^{-1}$
.

In figure 8 the heat flux and surface temperature are shown as a function of time for various initial substrate temperatures:
 $350$
,
 $400$
and
 $450\,^{\circ }\text{C}$
. The spray properties are:
 ${\dot{m}}=1.6~\text{kg}~\text{m}^{-2}~\text{s}^{-1}$
,
 $D_{10}=64~\unicode[STIX]{x03BC}\text{m}$
and
 $U=8~\text{m}~\text{s}^{-1}$
. To highlight the transient behaviour the temporal axis is limited to
 $t<50\,\text{s}$
. Some minor influence of the initial temperature on the heat flux in the film boiling regime can be identified. However, the overall trend of the curves remain the same. The time shift is a direct result of the different initial substrate temperatures.
Similar curves, but this time for a larger mass flux density, are shown in figure 9. The spray properties are:
 ${\dot{m}}=9.3~\text{kg}~\text{m}^{-2}~\text{s}^{-1}$
,
 $D_{10}=48~\unicode[STIX]{x03BC}\text{m}$
and
 $U=15.6~\text{m}~\text{s}^{-1}$
. Again the slopes are comparable but the heat flux at the critical heat flux is higher for the higher initial substrate temperatures. Furthermore, no typical film boiling regime is visible. This can again be explained by the small time scales in the film boiling regimes which are of the same order as the rise time of the thermocouples.
Influence of the initial wall temperature
 $T_{w0}$
on (a) heat flux and (b) surface temperature
 $T_{i}$
dependence on time
 $t$
for a higher mass flux density of
 ${\dot{m}}=9.3~\text{kg}~\text{m}^{-2}~\text{s}^{-1}$
.

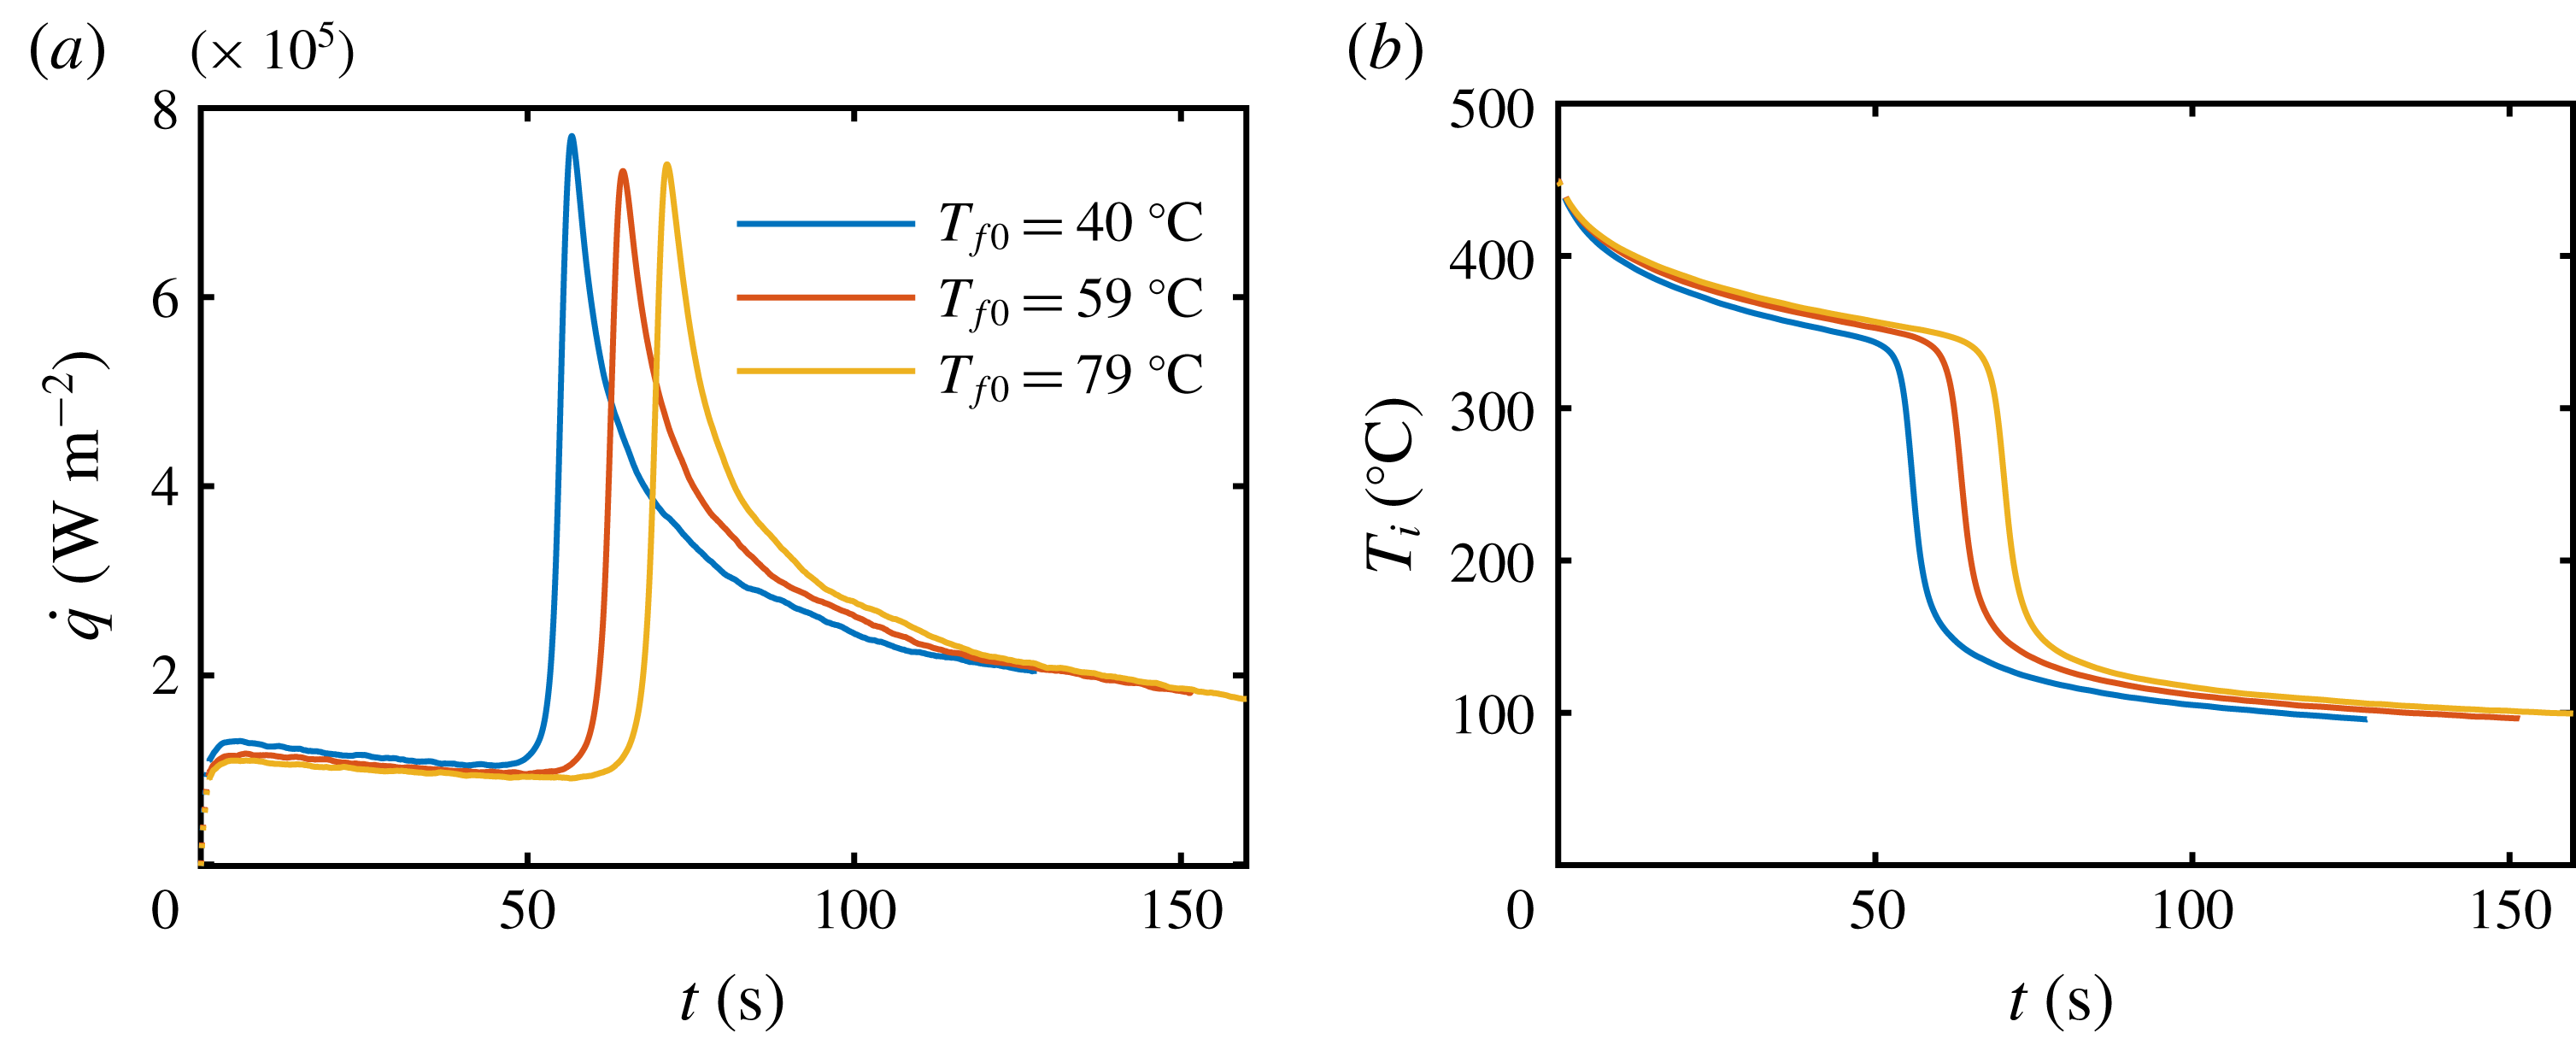
Since there is obviously an influence of the spray fluid temperature on the heat flux, experiments with different spray fluid temperatures
 $T_{f0}=20{-}80\,^{\circ }\text{C}$
were performed. An exemplary result in the known form of heat flux dependence on the surface temperature is shown in figure 10. The spray parameters are
 ${\dot{m}}=0.9~\text{kg}~\text{m}^{-2}~\text{s}^{-1}$
,
 $D_{10}=43~\unicode[STIX]{x03BC}\text{m}$
and
 $U=9.9~\text{m}~\text{s}^{-1}$
. An increasing spray fluid temperature results in a nonlinear decrease of the heat flux in the film boiling regime. The Leidenfrost point remains nearly constant.
Influence of the spray fluid temperature
 $T_{f0}$
on (a) heat flux and (b) surface temperature
 $T_{i}$
dependence on time
 $t$
.

Heat flux can ‘remember’ the initial wall temperature only through the processes occurring in the substrate, since the times associated with drop impacts in the spray are very short. These processes are determined by the heat conduction in a thin thermal boundary layer in the substrate, as analysed in the next section.
4 Analysis of heat transfer during spray cooling
Let us analyse heat transfer during very intensive transient spray cooling of an initially uniformly heated substrate. Consider for simplicity one-dimensional heat conduction in a semi-infinite solid substrate. This assumption is valid for cases when the thickness of the thermal boundary layer,
 $\sqrt{\unicode[STIX]{x1D6FC}t}$
, is much smaller than the thickness of the target, and the temperature gradients in this boundary are much higher than the gradients associated with the spray distribution in the radial direction. Here
 $\unicode[STIX]{x1D6FC}=\unicode[STIX]{x1D706}/\unicode[STIX]{x1D70C}c_{p}$
is the thermal diffusivity, where
 $\unicode[STIX]{x1D706}$
is the thermal conductivity,
 $\unicode[STIX]{x1D70C}$
is the density and
 $c_{p}$
is the heat capacity of the target material.
In our case the material properties of the substrate are:
 $\unicode[STIX]{x1D706}=18~\text{W}~\text{m}^{-1}~\text{K}^{-1}$
,
 $\unicode[STIX]{x1D70C}=7900~\text{kg}~\text{m}^{-3}$
and
 $c_{p}=500~\text{J}~\text{kg}^{-1}~\text{K}^{-1}$
. The longest experiments last approximately
 $200~\text{s}$
. This results in a thermal boundary layer thickness of approximately
 $30~\text{mm}$
which is comparable to the half of the target height. Therefore the heat conduction in the target can be considered as semi-infinite. Since the spray parameters are nearly constant in the centre area the assumption of a one-dimensional problem is valid.
Consider also a coordinate system
 $\{z,t\}$
fixed at the interface
 $z=0$
of the semi-infinite target, belonging to the interval
 $0<z<\infty$
. The temperature field
 $T(z,t)$
in the target can be calculated by solving the one-dimensional energy equation
 $$\begin{eqnarray}\frac{\unicode[STIX]{x2202}T}{\unicode[STIX]{x2202}t}=\unicode[STIX]{x1D6FC}\frac{\unicode[STIX]{x2202}^{2}T}{\unicode[STIX]{x2202}z^{2}}.\end{eqnarray}$$
Following Duahamel’s theorem (Özışık Reference Özışık1980), the solution which satisfies the boundary condition far from the target interface and the initial condition
 $$\begin{eqnarray}T=T_{w0}\quad \text{at }\quad (t=0\wedge z\in [0,\infty ])\quad \vee \quad (t>0\wedge z\rightarrow \infty )\end{eqnarray}$$
is
 $$\begin{eqnarray}T(t)=T_{w0}+\int _{0}^{t}A(\unicode[STIX]{x1D70F})\text{erfc}\left[\frac{z}{2\sqrt{\unicode[STIX]{x1D6FC}(t-\unicode[STIX]{x1D70F})}}\right]\text{d}\unicode[STIX]{x1D70F},\end{eqnarray}$$
where
 $A(\unicode[STIX]{x1D70F})$
is a function determined by the conditions at the target interface
 $z=0$
,
 $\text{erfc}$
is the complementary error function and
 $T_{w0}$
is the initial wall temperature. As usual, the limit
 $z\rightarrow \infty$
denotes a position at a final distance much larger than the thickness of the thermal boundary layer in the wall. The expression (4.3) allows the general solution for the interface temperature
 $T_{i}(t)$
and for the heat flux
 $\dot{q}(t)$
to be determined
 $$\begin{eqnarray}T_{i}(t)=T_{w0}+\int _{0}^{t}A(\unicode[STIX]{x1D70F})\text{d}\unicode[STIX]{x1D70F},\quad \dot{q}(t)=-\frac{\unicode[STIX]{x1D716}_{w}}{\sqrt{\unicode[STIX]{x03C0}}}\int _{0}^{t}\frac{T_{i}^{\prime }(\unicode[STIX]{x1D70F})}{\sqrt{t-\unicode[STIX]{x1D70F}}}\text{d}\unicode[STIX]{x1D70F},\end{eqnarray}$$
where
 $\unicode[STIX]{x1D716}_{w}=\sqrt{\unicode[STIX]{x1D706}\unicode[STIX]{x1D70C}c_{p}}$
is the thermal effusivity of the wall.
4.1 Temperature and heat flux evolution in the film boiling regime
The theoretical model (Breitenbach, Roisman & Tropea Reference Breitenbach, Roisman and Tropea2017b
) for the heat transfer from a single drop and during spray cooling in the film boiling regime is based on the analysis of the heat conduction in the substrate, heat convection in the liquid region and in an expanding thin vapour layer emerging between the impacting drop and the very hot substrate. The mass flux of the vapour generated at the lower liquid interface is determined from the energy balance at this interface. This model has already been validated by comparison with experimental results from the literature (Wendelstorf et al.
Reference Wendelstorf, Spitzer and Wendelstorf2008). Moreover, the predicted vapour layer thickness agrees well with the direct measurements of Tran et al. (Reference Tran, Staat, Prosperetti, Sun and Lohse2012) and Chaze et al. (Reference Chaze, Caballina, Castanet, Pierson, Lemoine and Maillet2019). Predictions for the evolution of the heat flux
 $\dot{q}(t)$
also agree with accurate measurements based on the infrared technique (Chaze et al.
Reference Chaze, Caballina, Castanet, Pierson, Lemoine and Maillet2019).
The total heat transferred during the impact of a single drop
 $Q_{\mathit{single}}$
is determined by the integration of the heat flux
 $\dot{q}(t)$
over the ‘apparent contact area’ during the contact time. It should be noted that the contact area cannot be based on the drop spreading diameter since the free lamella in the remote regions can levitate (Roisman et al.
Reference Roisman, Breitenbach and Tropea2018). Therefore the values of
 $D_{0}^{2}$
and
 $D_{0}/U_{0}$
are used as the scales for the contact area and for the contact duration, where
 $U_{0}$
and
 $D_{0}$
are the impact velocity and drop diameter, respectively.
This analysis (Breitenbach et al. Reference Breitenbach, Roisman and Tropea2017b ) allows the heat flux during spray impact in the film boiling regime to be predicted
 $$\begin{eqnarray}\displaystyle & \displaystyle \dot{q}=S\unicode[STIX]{x1D716}_{w}(T_{i}-T_{\mathit{sat}}), & \displaystyle\end{eqnarray}$$
 $$\begin{eqnarray}\displaystyle & \displaystyle S=8.85\unicode[STIX]{x1D712}\frac{{\dot{m}}}{\unicode[STIX]{x1D70C}_{f}D_{10}^{1/2}U^{1/2}\left[1-b+\sqrt{(1-b)^{2}+w}\right]}, & \displaystyle\end{eqnarray}$$
 $$\begin{eqnarray}w=\frac{8(T_{i}-T_{\mathit{sat}})\unicode[STIX]{x1D716}_{w}^{2}}{\unicode[STIX]{x03C0}\unicode[STIX]{x1D706}_{v}\unicode[STIX]{x1D70C}_{f}L},\quad b=\frac{2\sqrt{5}\unicode[STIX]{x1D716}_{w}\unicode[STIX]{x1D716}_{f}(T_{\mathit{sat}}-T_{f0})}{\unicode[STIX]{x03C0}\unicode[STIX]{x1D70C}_{f}\unicode[STIX]{x1D706}_{v}L},\end{eqnarray}$$
where
 $L$
is the latent heat of evaporation,
 $\unicode[STIX]{x1D712}$
is a dimensionless fitting parameter which depends on the substrate wetting properties and roughness,
 $T_{\mathit{sat}}$
is the saturation temperature of the liquid and
 $T_{f0}$
is the initial spray fluid temperature. All the terms with the subscript ‘
 $f$
’ correspond to the liquid (fluid) component, ‘
 $w$
’ to the wall and ‘
 $v$
’ to the vapour.
Since the sprays used in the experiments and in practical applications are always polydisperse, the average drop diameter and velocity,
 $D_{10}$
and
 $U$
, are used in the model. The parameter
 $\unicode[STIX]{x1D712}$
thus inherently accounts also for the drop size and velocity distributions.
In this study the model (4.5)–(4.7) is used for prediction of the evolution of the wall temperature with time. The predictions are then compared with our experimental data.
In our experimental conditions,
 $T_{i}=340\,^{\circ }\text{C}$
,
 $T_{\mathit{sat}}=99\,^{\circ }\text{C}$
,
 $\unicode[STIX]{x1D716}_{w}=8432~\text{J}~\text{K}^{-1}~\text{m}^{-2}~\text{s}^{-1/2}$
,
 $\unicode[STIX]{x1D706}_{v}=0.0248~\text{W}~\text{m}^{-1}~\text{K}^{-1}$
,
 $\unicode[STIX]{x1D70C}_{f}=998~\text{kg}~\text{m}^{-3}$
,
 $L=2453~\text{kJ}~\text{kg}^{-1}$
,
 $\unicode[STIX]{x1D716}_{f}=1581~\text{J}~\text{K}^{-1}$
 $\text{m}^{-2}~\text{s}^{-1/2}$
,
 $T_{f0}=20\,^{\circ }\text{C}$
, the estimated values for
 $w$
and
 $b$
defined in (4.7) are
 $w\approx 700$
and
 $b\approx 25$
. Since
 $b\gg 1$
and
 $b^{2}$
and
 $w$
are of the same order of magnitude, the effect of the dependence of
 $S$
on the changing temperature
 $T_{i}$
in the expression for
 $w$
can be neglected. The value of
 $S$
can be estimated by using
 $T_{w0}$
instead of
 $T_{i}(t)$
in the expression (4.7).
Expressions (4.4) and (4.5) lead to the following integral equation for the surface temperature, presented in dimensionless form
 $$\begin{eqnarray}\unicode[STIX]{x1D6E9}(\unicode[STIX]{x1D709})+\int _{0}^{\unicode[STIX]{x1D709}}\frac{\unicode[STIX]{x1D6E9}^{\prime }(\unicode[STIX]{x1D701})}{\sqrt{\unicode[STIX]{x1D709}-\unicode[STIX]{x1D701}}}\,\text{d}\unicode[STIX]{x1D701}=0,\end{eqnarray}$$
where the surface temperature is made dimensionless using
 $$\begin{eqnarray}\unicode[STIX]{x1D6E9}=\frac{T_{i}(t)-T_{\mathit{sat}}}{T_{w0}-T_{\mathit{sat}}},\quad \unicode[STIX]{x1D709}=t\unicode[STIX]{x03C0}S^{2},\quad \unicode[STIX]{x1D701}=\unicode[STIX]{x1D70F}\unicode[STIX]{x03C0}S^{2}.\end{eqnarray}$$
This equation can be solved numerically subject the initial condition
 $\unicode[STIX]{x1D6E9}(0)=1$
. The analytical solution for
 $\unicode[STIX]{x1D6E9}(\unicode[STIX]{x1D709})$
can be represented as a series
 $$\begin{eqnarray}\unicode[STIX]{x1D6E9}(\unicode[STIX]{x1D709})=1+\mathop{\sum }_{i=1}^{\infty }a_{i}\unicode[STIX]{x1D709}^{i/2},\end{eqnarray}$$
 $$\begin{eqnarray}a_{1}=-\frac{2}{\unicode[STIX]{x03C0}},\quad a_{2}=\frac{1}{\unicode[STIX]{x03C0}},\quad a_{3}=-\frac{4}{3\unicode[STIX]{x03C0}^{2}},\ldots \quad a_{i+1}=-a_{i}\frac{2^{-i}\unicode[STIX]{x1D6E4}(i+1)}{\unicode[STIX]{x1D6E4}\left[\frac{i+1}{2}\right]\unicode[STIX]{x1D6E4}\left[\frac{i+3}{2}\right]},\end{eqnarray}$$
where
 $\unicode[STIX]{x1D6E4}$
is the gamma function.
The corresponding heat flux
 $\dot{q}$
can be estimated using (4.4)
 $$\begin{eqnarray}\displaystyle & \displaystyle \dot{q}=S\unicode[STIX]{x1D716}_{w}(T_{w0}-T_{\mathit{sat}})\unicode[STIX]{x1D6F7}(\unicode[STIX]{x1D709}), & \displaystyle\end{eqnarray}$$
 $$\begin{eqnarray}\displaystyle & \displaystyle \unicode[STIX]{x1D6F7}(\unicode[STIX]{x1D709})=-\int _{0}^{\unicode[STIX]{x1D709}}\frac{\unicode[STIX]{x1D6E9}^{\prime }(\unicode[STIX]{x1D701})}{\sqrt{\unicode[STIX]{x1D709}-\unicode[STIX]{x1D701}}}\,\text{d}\unicode[STIX]{x1D701},\quad \unicode[STIX]{x1D6E9}^{\prime }(\unicode[STIX]{x1D701})=\frac{1}{2}\mathop{\sum }_{i=1}^{\infty }a_{i}i\unicode[STIX]{x1D701}^{i/2-1}. & \displaystyle\end{eqnarray}$$
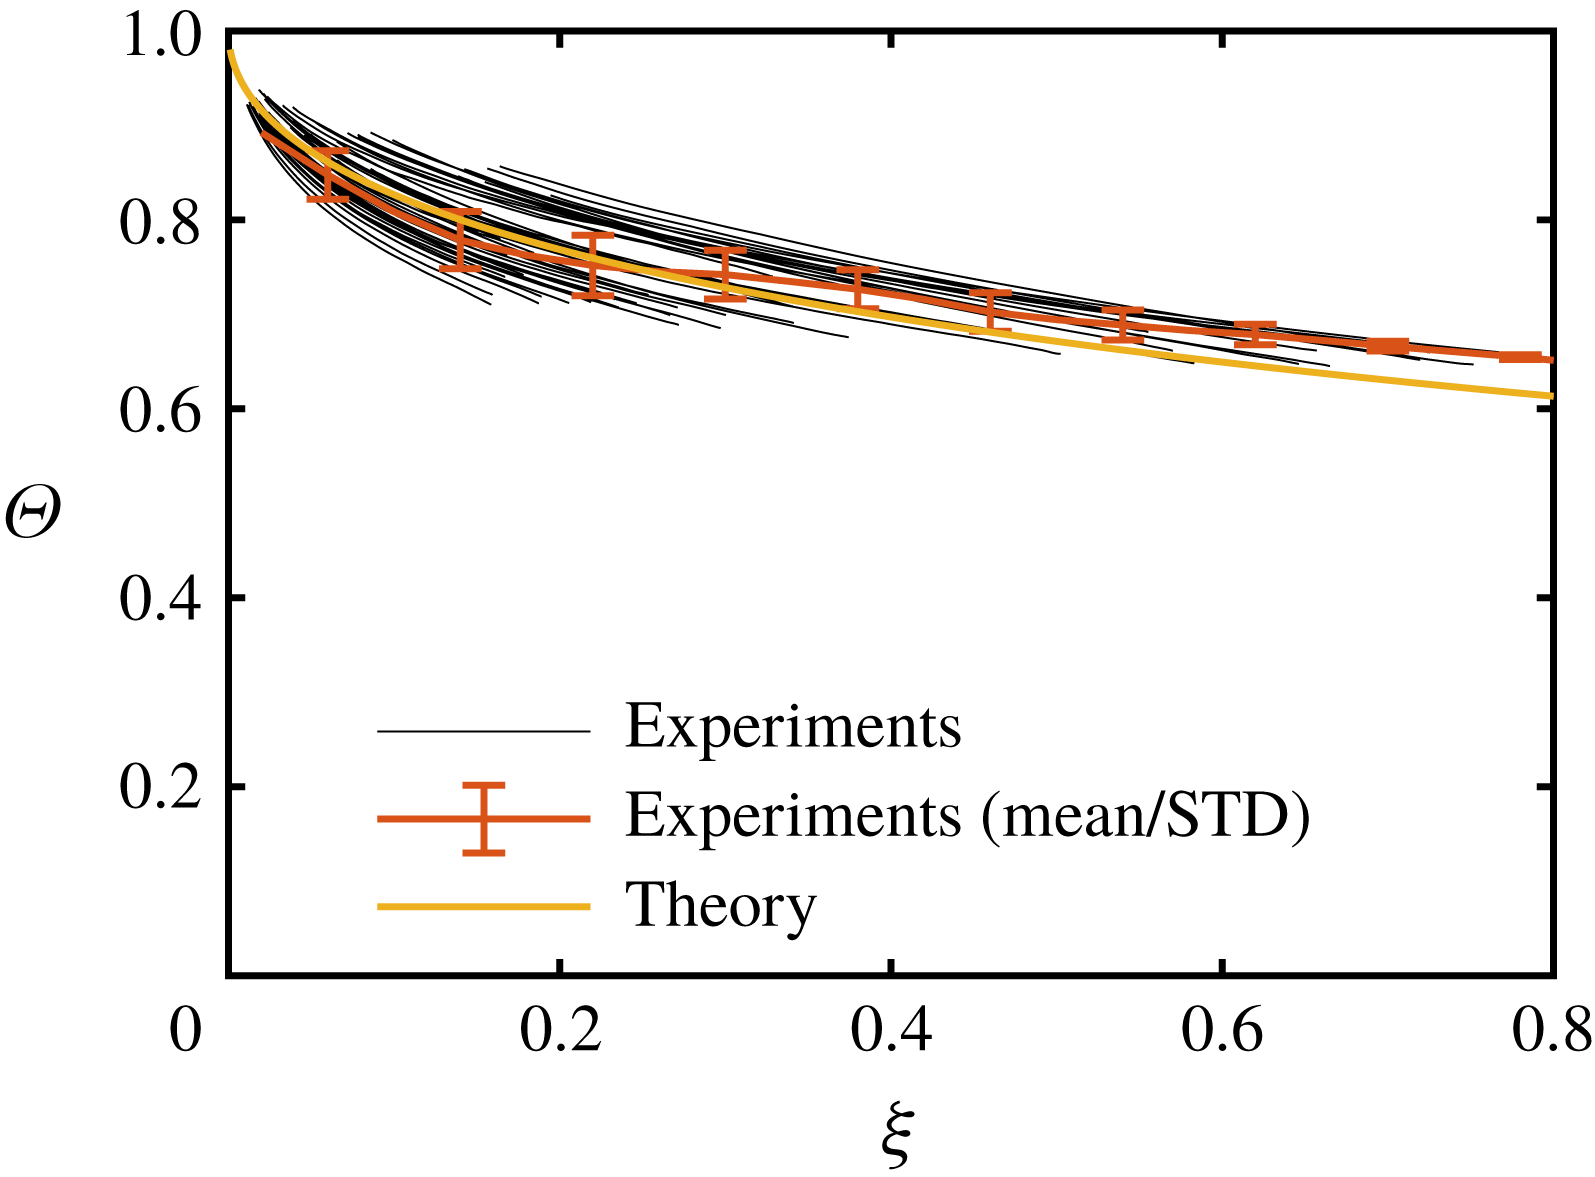
In figure 11 the measured evolution of the dimensionless surface temperature
 $\unicode[STIX]{x1D6E9}(\unicode[STIX]{x1D709})$
as a function of dimensionless time
 $\unicode[STIX]{x1D709}$
is plotted for the theoretical prediction (4.10) and for experimental results. The computation of the theoretical solution is based on the first 50 terms in the series. It converges in the interval
 $0<\unicode[STIX]{x1D709}<22$
. The line shown for the experiments is the mean and the error bars indicate the standard deviation computed over
 $49$
experiments. For the reduction of the experimental data
 $T_{i}$
and
 $t$
,
 $\unicode[STIX]{x1D712}$
in (4.6) is fitted to the experimental data using a least square fit, resulting in
 $\unicode[STIX]{x1D712}=2.2$
. Only the experiments exhibiting clear film boiling behaviour are chosen and the experimental data comprising the film boiling regime are plotted. We skip the experiments showing no film boiling behaviour because of the previously mentioned limited temporal response of the measurement system. The experimental parameters corresponding to the shown experimental data span the following ranges:
 ${\dot{m}}=0.5{-}9.1~\text{kg}~\text{m}^{-2}~\text{s}^{-1}$
,
 $D_{10}=43{-}78~\unicode[STIX]{x03BC}\text{m}$
,
 $U=6.7{-}15.9~\text{m}~\text{s}^{-1}$
,
 $T_{w0}=350{-}450\,^{\circ }\text{C}$
and
 $T_{f0}=18{-}80\,^{\circ }\text{C}$
. Although the parameter range in this study is quite small, the authors in Breitenbach et al. (Reference Breitenbach, Roisman and Tropea2017b
) show that the model is valid for a much lager parameter span.
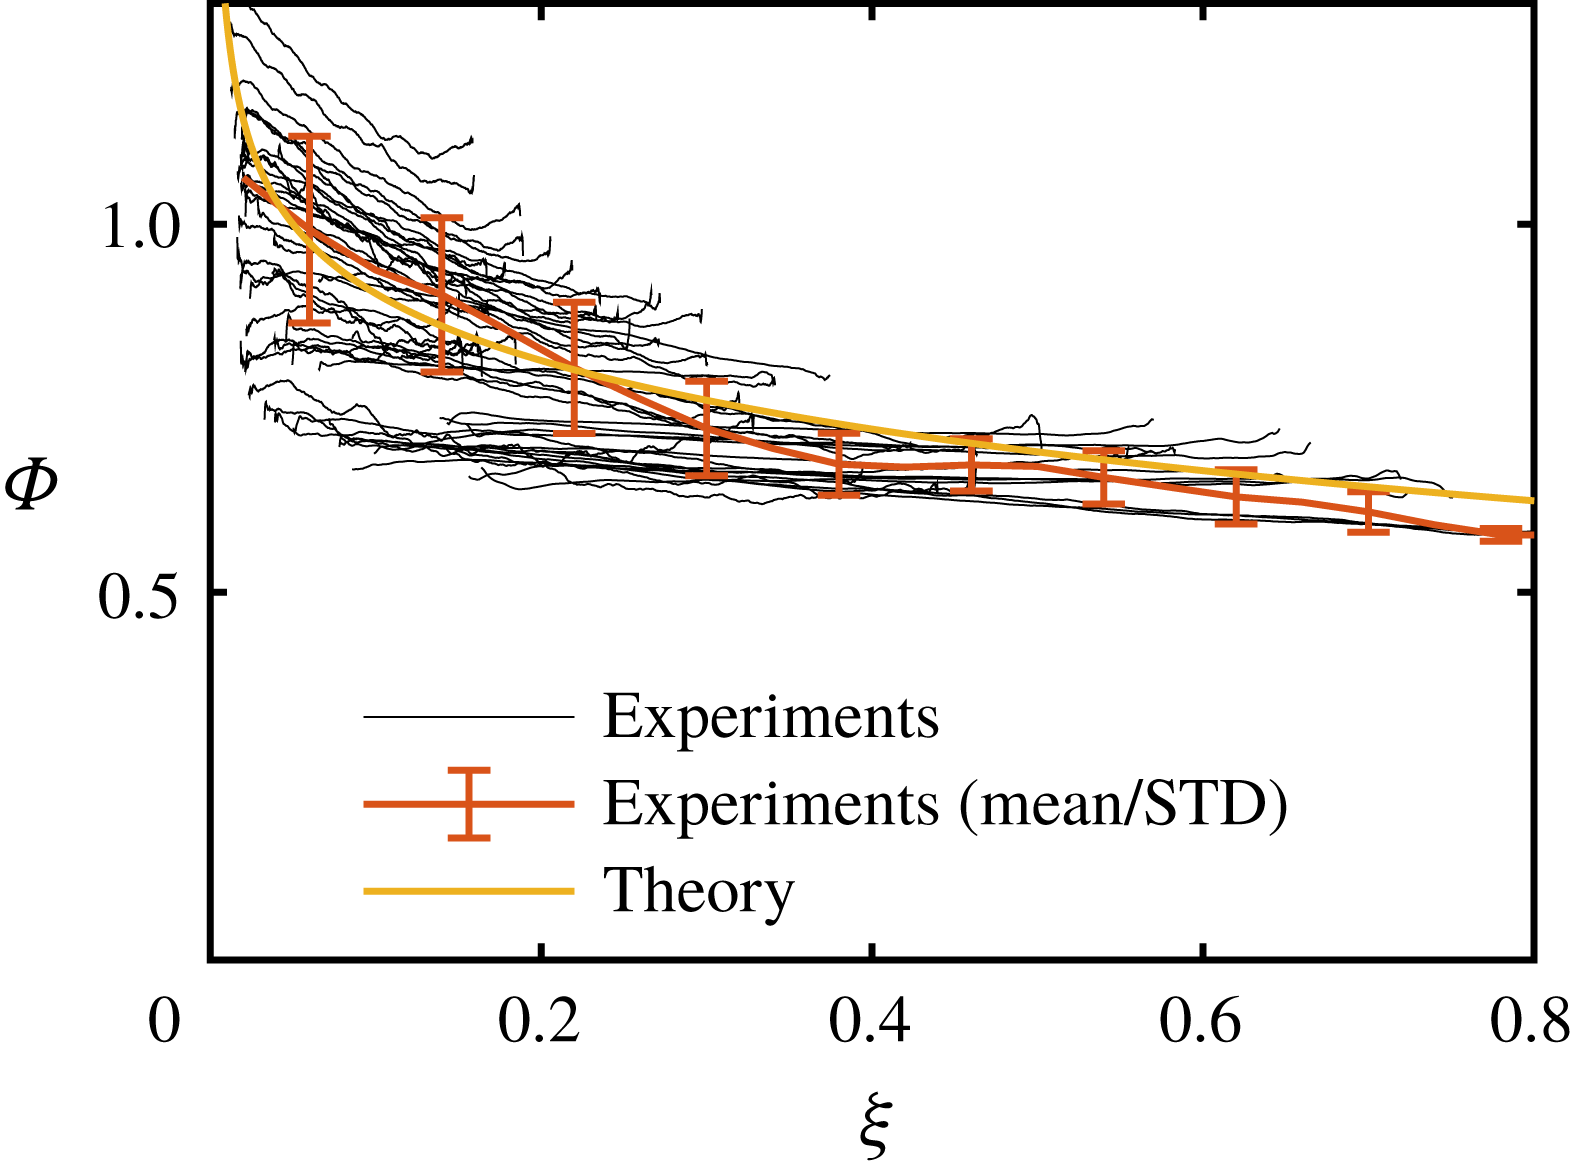
In figure 12 the corresponding evolution of the dimensionless heat flux for the same experiments is shown and compared to theory. Although there is obviously a large scatter in the experimental data, very good agreement between the experiments and theory can be observed. Especially
 $\unicode[STIX]{x1D712}$
, being close to unity, indicates the performance of the theory, which obviously captures all main physical players. The shown data consist of different sources like phase Doppler, patternator and heat flux data, each having numerous sources of uncertainty. Keeping that in mind, the scatter is acceptable and therefore the good agreement between experiment and theory indicates a good understanding of the physics of spray cooling in the film boiling regime.
Evolution of the dimensionless substrate temperature
 $\unicode[STIX]{x1D6E9}(\unicode[STIX]{x1D709})$
, defined in (4.9) as a function of the dimensionless time
 $\unicode[STIX]{x1D709}$
for the experimental data in the film boiling regime compared with the theoretical prediction obtained by integration of (4.8). STD, standard deviation.


4.2 Transitional spray cooling regime below the Leidenfrost point
At some instant
 $t_{L}$
the conditions at the surface correspond to the Leidenfrost point. We identify the Leidenfrost point from the time series of the measurement data as the point when the heat flux reaches its minimum in the film boiling regime. The value of the surface temperature at the Leidenfrost point in our study is not a fixed value but variable. This temperature depends not only on the impact parameters of the drops in the spray or mass flux density, but probably on the rate of the wall cooling in the film boiling regime. At this stage it is not easy to develop a complete and reliable model for the Leidenfrost temperature. In our experiments it is in the range
 $315{-}360\,^{\circ }\text{C}$
. At this stage we leave the exact modelling of the Leidenfrost temperature for future studies and focus on the description of the nucleate boiling at lower temperatures.
Denoting the surface temperature at the Leidenfrost point as
 $T_{iL}$
, the corresponding heat flux
 $\dot{q}_{L}$
can be estimated using (4.5).
Further cooling leads to a rapid increase of the heat flux, caused by the partial wetting of the surface. The area of the wetted spots quickly grows. The duration of this transitional spray cooling regime is rather short. At this instant both modes of drop impact can be observed: drop impact onto dry regions in the film boiling regime and drop impact onto wetted spots. The relative area of the wetted spots grows with increasing time; hence, with decreasing surface temperature.
Evolution of the heat flux as a function of time for an exemplary experiment. The parameters of the spray are:
 ${\dot{m}}=1.4~\text{kg}~\text{m}^{-2}~\text{s}^{-1}$
,
 $D_{10}=43~\unicode[STIX]{x03BC}\text{m}$
and
 $U=11~\text{m}~\text{s}^{-1}$
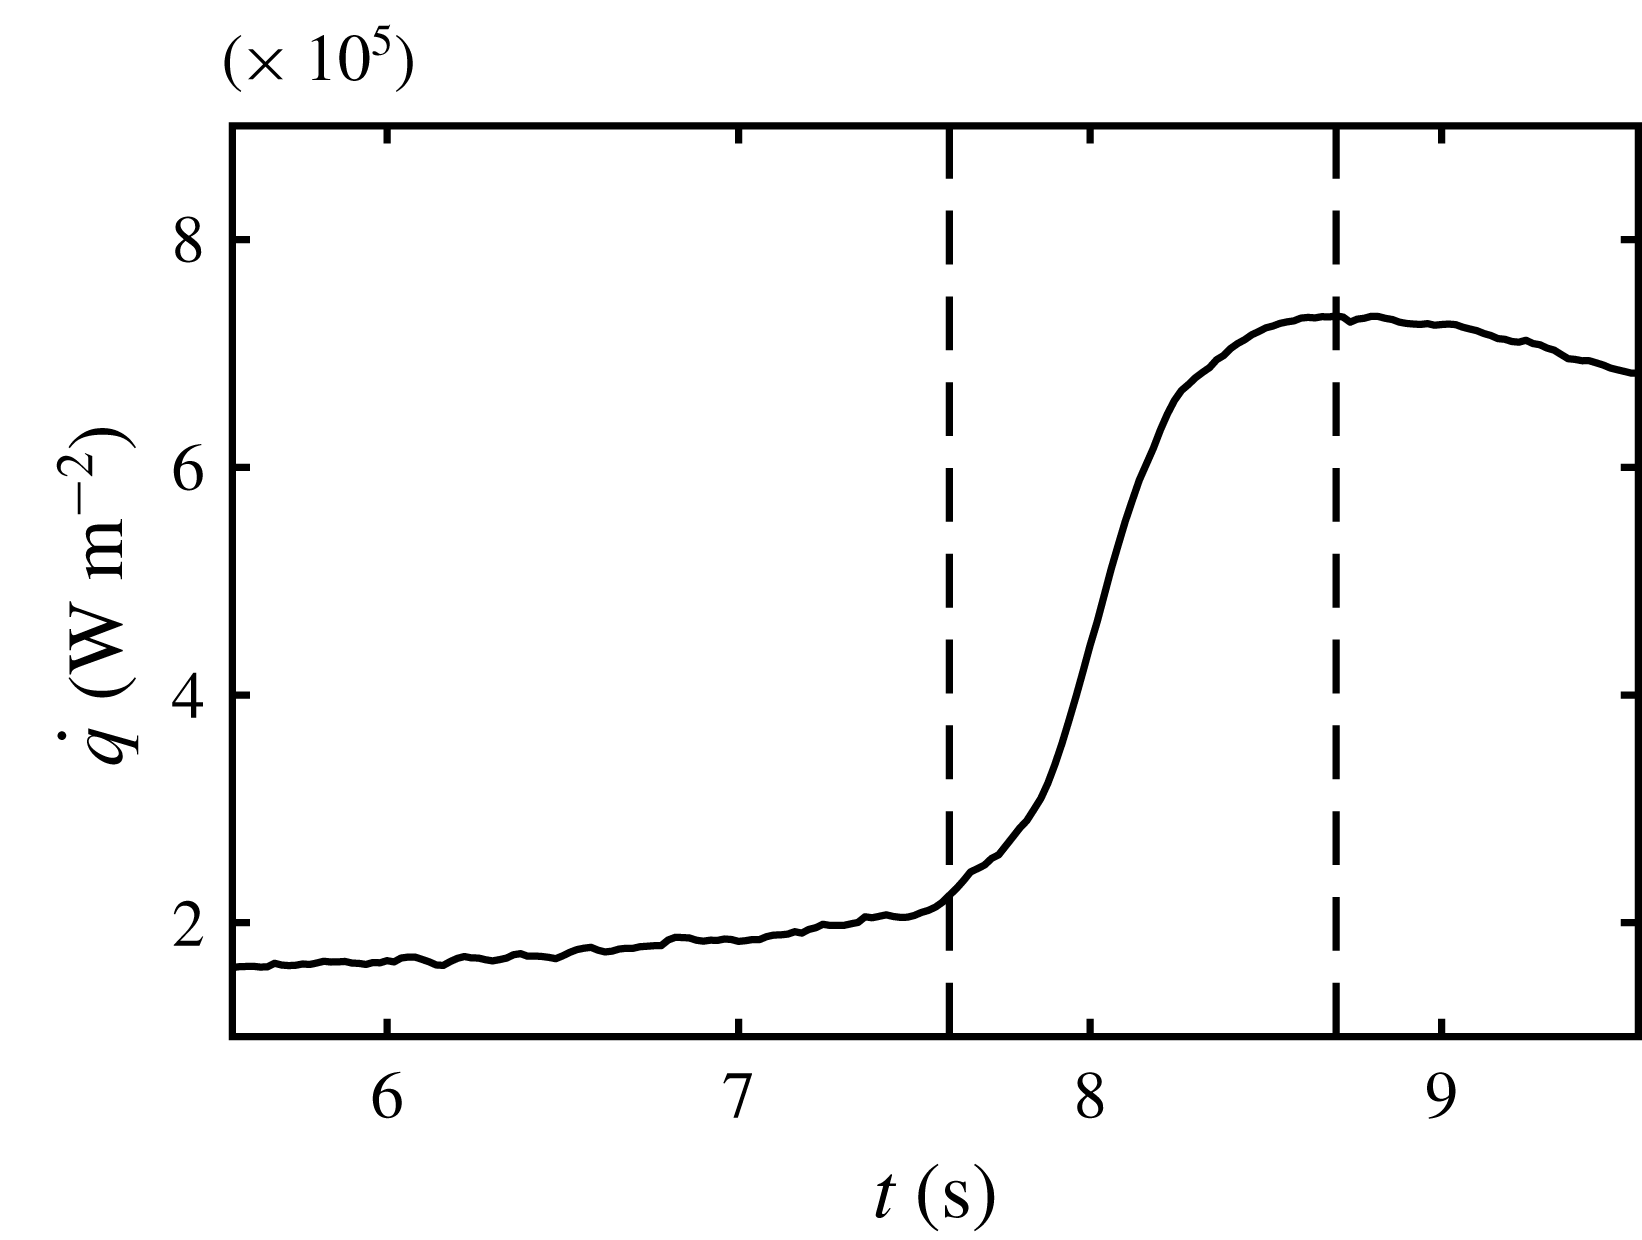
. The dashed vertical lines bound the transition boiling regime.

In figure 13 an exemplary dependence of the heat flux on time is shown. Here we limit the temporal span to the time between the end of the film boiling regime and the beginning of the nucleate boiling regime in order to illustrate the behaviour in the transition boiling regime. The corresponding spray parameters are:
 ${\dot{m}}=1.4~\text{kg}~\text{m}^{-2}~\text{s}^{-1}$
,
 $D_{10}=43~\unicode[STIX]{x03BC}\text{m}$
and
 $U=11~\text{m}~\text{s}^{-1}$
. We can clearly identify the instant when the Leidenfrost point occurs (
 $t_{L}$
) at around
 $7.6~\text{s}$
and the instant when the critical heat flux is reached (
 $t_{\mathit{CHF}}$
) at
 $8.7~\text{s}$
. This small time of slightly more than
 $1~\text{s}$
between both events is similar to the rise time of the thermocouples. We obtain no reasonable temperature readings in the range between both events and therefore can make no prediction of the surface temperature and the heat flux in the transition boiling regime or the critical heat flux.
This short time in the transition boiling regime is very small compared to the overall cooling process and therefore the heat which is transferred during this short time can be neglected. In the present case the transition boiling regime therefore plays no role with respect to the cooling process. Having this short time in mind we can image the transition boiling regime to be non-existent and replaced by a jump of the heat flux towards infinity at the Leidenfrost point. The typical trend we see in our measurements of heat flux is only due to the limited temporal resolution of the measurement equipment and is probably only valid for very low mass flux density or cooling rates in general.
4.3 Nucleate boiling regime, a remote asymptotic solution
For longer times
 $t>t_{L}$
, during the nucleate boiling regime of spray cooling, the heat flux can be estimated from (4.4) accounting for the very short duration of the transient boiling regime and very high temperature time derivative during this regime. Denoting
 $\unicode[STIX]{x0394}T_{L}$
as the temperature jump during the transition boiling, in this case the expression (4.4) yields
 $$\begin{eqnarray}\dot{q}(t)=-\frac{\unicode[STIX]{x1D716}_{w}}{\sqrt{\unicode[STIX]{x03C0}}}\int _{0}^{t_{L}}\frac{T_{i,film}^{\prime }(\unicode[STIX]{x1D70F})}{\sqrt{t-\unicode[STIX]{x1D70F}}}\text{d}\unicode[STIX]{x1D70F}+\frac{\unicode[STIX]{x1D716}_{w}}{\sqrt{\unicode[STIX]{x03C0}}}\frac{\unicode[STIX]{x0394}T_{L}}{\sqrt{t-t_{L}}}-\frac{\unicode[STIX]{x1D716}_{w}}{\sqrt{\unicode[STIX]{x03C0}}}\int _{t_{L}}^{t}\frac{T_{i,\mathit{nucleate}}^{\prime }(\unicode[STIX]{x1D70F})}{\sqrt{t-\unicode[STIX]{x1D70F}}}\text{d}\unicode[STIX]{x1D70F}.\end{eqnarray}$$
On the right-hand side of (4.14) the first term is associated with the thermal history during the film boiling regime, the second term is associated with the temperature jump
 $\unicode[STIX]{x0394}T_{L}$
during the transition regime at
 $\unicode[STIX]{x1D70F}=t_{L}$
and the last term is based on the temperature evolution during the nucleate boiling at times
 $t_{L}<\unicode[STIX]{x1D70F}<t$
.
In order to model the heat flux in the nucleate boiling regime the values of
 $\unicode[STIX]{x0394}T_{L}$
and the evolution of the surface temperature
 $T_{i}(\unicode[STIX]{x1D70F})$
(which is required for the computation of the time derivative
 $T_{i}^{\prime }(\unicode[STIX]{x1D70F})$
) are necessary.
In the estimation of an upper bound for heat flux during the nucleate boiling regime of single drop impact (Breitenbach, Roisman & Tropea Reference Breitenbach, Roisman and Tropea2017a
) the temperature at the wetted part of the wall interface is approximated by the saturation temperature
 $T_{\mathit{sat}}$
.
The nucleate boiling regime is characterized by an intensive nucleation and expansion of vapour bubbles. The temperature in the vicinity of the contact line of the each expanding bubble is close to the saturation temperature. However, some overheating of the surrounding liquid is required for the bubble growth. The heat transfer in the liquid phase during the nucleate boiling regime is governed by the convection in the liquid flow between the bubbles. The heat mainly goes into vaporization at the bubble interfaces where
 $T=T_{\mathit{sat}}$
. Therefore, the upper bound for the heat flux during nucleate boiling regime can be estimated by the assumption that the temperature at the wetted wall interface is
 $T_{\mathit{sat}}$
. Surprisingly the duration of a single drop evaporation in the nucleate boiling regime, predicted using this rough estimation of
 $\dot{q}$
, agrees very well with numerous experimental data (Itaru & Kunihide Reference Itaru and Kunihide1978; Tartarini, Lorenzini & Randi Reference Tartarini, Lorenzini and Randi1999; Abu-Zaid Reference Abu-Zaid2003).
In this study the upper bound for the heat flux
 $\dot{q}$
during spray cooling is estimated also, as in the case of a single drop impact, using the assumption that the substrate temperature is equal to the saturation temperature at
 $t>t_{L}$
. The third term on the right-hand side of the (4.14), associated with the time gradient of the surface temperature at
 $t>t_{L}$
, can be neglected in comparison to the effect of the temperature jump at the Leidenfrost point. The temperature jump during the transition boiling regime can be estimated as
 $\unicode[STIX]{x0394}T_{L}=T_{iL}-T_{\mathit{sat}}$
.
The heat flux can be obtained from (4.14), neglecting the value of the last term, in the form
 $$\begin{eqnarray}\dot{q}=\frac{\unicode[STIX]{x1D716}_{w}}{\sqrt{\unicode[STIX]{x03C0}}}\frac{T_{iL}-T_{\mathit{sat}}}{\sqrt{t-t_{L}}}-S\unicode[STIX]{x1D716}_{w}\frac{T_{w0}-T_{\mathit{sat}}}{2}\mathop{\sum }_{i=1}^{\infty }a_{i}i\text{B}\left[\frac{\unicode[STIX]{x1D709}_{L}}{\unicode[STIX]{x1D709}};\frac{i}{2},\frac{1}{2}\right]\unicode[STIX]{x1D709}^{(i-1)/2},\end{eqnarray}$$
where
 $\text{B}[\cdot ;\cdot ,\cdot ]$
is the incomplete beta function. Expression (4.15) is valid only for very fast substrate cooling, when the time interval between the Leidenfrost point and the point corresponding to the critical heat flux is very short. It can be further modified using (4.9)
 $$\begin{eqnarray}\dot{q}=\frac{\unicode[STIX]{x1D716}_{w}}{\sqrt{\unicode[STIX]{x03C0}}}\frac{T_{w0}-T_{\mathit{sat}}}{\sqrt{t-t_{L}}}\left[\unicode[STIX]{x1D6E9}(\unicode[STIX]{x1D709}_{L})-\frac{S\sqrt{\unicode[STIX]{x03C0}}\sqrt{t-t_{L}}}{2}\mathop{\sum }_{i=1}^{\infty }a_{i}i\text{B}\left[\frac{\unicode[STIX]{x1D709}_{L}}{\unicode[STIX]{x1D709}};\frac{i}{2},\frac{1}{2}\right]\unicode[STIX]{x1D709}^{(i-1)/2}\right].\end{eqnarray}$$
Moreover, at large times,
 $t\gg t_{L}$
, the expression (4.16) approaches the following remote asymptotic solution
 $$\begin{eqnarray}\dot{q}\approx \frac{\unicode[STIX]{x1D716}_{w}}{\sqrt{\unicode[STIX]{x03C0}}}\frac{T_{w0}-T_{\mathit{sat}}}{\sqrt{t-t_{L}}}\left[\unicode[STIX]{x1D6E9}(\unicode[STIX]{x1D709}_{L})+\frac{2S\sqrt{t_{L}}}{\sqrt{\unicode[STIX]{x03C0}}}\right].\end{eqnarray}$$
Rearranging (4.17) leads to
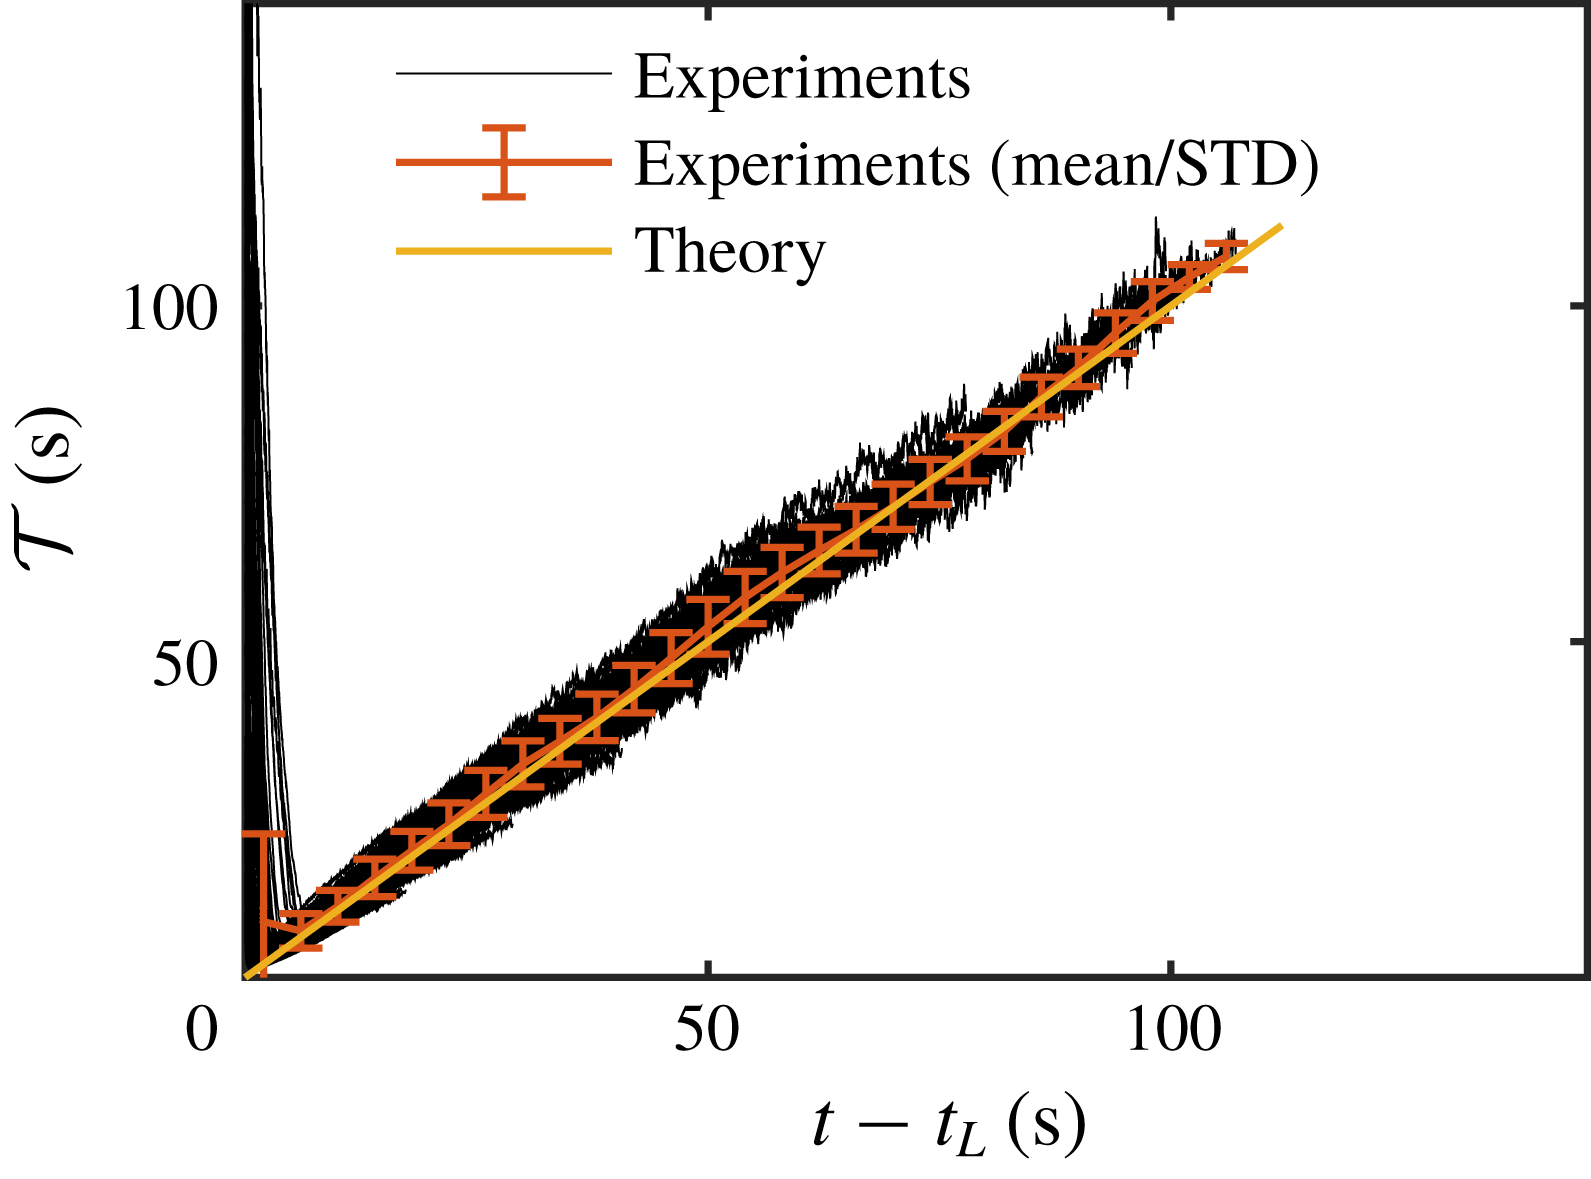
 $$\begin{eqnarray}{\mathcal{T}}\equiv \frac{\unicode[STIX]{x1D716}_{w}^{2}\unicode[STIX]{x0394}T^{2}}{\unicode[STIX]{x03C0}\dot{q}(t)^{2}}\approx k(t-t_{L}),\end{eqnarray}$$
where
 $k$
is a constant which can be determined from the experiments and
 $\unicode[STIX]{x0394}T=T_{w0}-T_{\mathit{sat}}$
.
Scaling of the heat flux, expressed through
 ${\mathcal{T}}$
, defined in (4.18), plotted as a function of time. The straight line, having a slope of unity, indicates good agreement between the theory and the experimental data.

In figure 14 the values of the term
 ${\mathcal{T}}\equiv \unicode[STIX]{x1D716}_{w}^{2}\unicode[STIX]{x0394}T^{2}/\unicode[STIX]{x03C0}\dot{q}^{2}$
, measured for various spray parameters and different initial substrate temperatures, are shown as a function of
 $t-t_{L}$
. The parameters of the 86 experiments used in the plotting of the data in figure 14 are varied over wide ranges: mass flux
 ${\dot{m}}$
from 0.5 to
 $29.5~\text{kg}~\text{m}^{-2}~\text{s}^{-1}$
, average drop diameter
 $D_{10}$
from 43 to
 $78~\unicode[STIX]{x03BC}\text{m}$
, average impact velocity
 $U$
from 6.7 to
 $17.7~\text{m}~\text{s}^{-1}$
, initial wall temperature
 $T_{w0}$
from 350 to
 $450\,^{\circ }\text{C}$
and spray fluid temperature
 $T_{f0}$
from 18 to
 $80\,^{\circ }\text{C}$
. Additionally, a line corresponding to the average value of
 ${\mathcal{T}}$
for all the experiments and the error bars indicating one standard deviation are shown in the graph. As predicted by the remote asymptotic solution (4.18), the term
 ${\mathcal{T}}$
is very close to the time increment
 $t-t_{L}$
in all the experiments with
 $k=1.05$
for all the sets of the operational parameters.
Finally, our experiments show that the heat flux during fully developed nucleate boiling regime depends significantly on the time. It is estimated as
 $$\begin{eqnarray}\dot{q}\approx \frac{\unicode[STIX]{x1D716}_{w}}{\sqrt{\unicode[STIX]{x03C0}}}\frac{T_{w0}-T_{\mathit{sat}}}{\sqrt{t-t_{L}}}.\end{eqnarray}$$
Note that the measured values for
 ${\mathcal{T}}$
deviate significantly from the theoretical prediction at small times, associated with the film boiling and transition regimes, for which the scaling (4.18) is not applicable.
The remote asymptotic solution (4.19) is valid only for a semi-infinite hot substrate and uniform spray. In practice this means that thickness and the width of the substrate are much larger than the thickness of the thermal boundary layer in the substrate
 $\sqrt{\unicode[STIX]{x1D6FC}t}$
.
4.4 Heat flux
 $\dot{q}$
and its upper bound

The measured heat flux during the nucleate boiling regime is described very well by the upper bound estimation (4.19) obtained from the assumption that the interface temperature is equal to
 $T_{\mathit{sat}}$
. The reason for this agreement is not immediately clear since some liquid overheat is expected during the nucleate boiling.
This interesting result can be explained by the fact that the interface temperature oscillates due to the nucleation of multiple bubbles, their expansion and subsequent collapse (Carey Reference Carey2018). The bubble contact lines of the wall-bounded bubbles, whose temperatures are close to
 $T_{\mathit{sat}}$
, quickly propagate along the interface. The characteristic time of bubble formation
 $t_{\mathit{bubble}}$
in the experiments (Breitenbach et al.
Reference Breitenbach, Roisman and Tropea2017a
) is approximately
 $1~\text{ms}$
. Therefore, the thickness of the thermal boundary layer, associated with a single bubble event is
 $h_{\mathit{bubble}}\sim \sqrt{\unicode[STIX]{x1D6FC}t_{\mathit{bubble }}}$
. This value is approximately
 $70~\unicode[STIX]{x03BC}\text{m}$
in our case. In any case, our measurement system is not able to detect such temperature fluctuations.
At any given location on the wall surface the temperature jumps to the saturation temperature each time the contact line propagates through this position. Our measurements allow us to estimate only the averaged value of the temperature fluctuations above the saturation temperature. Nevertheless, the contribution of the temperature fluctuations (consisting of positive and negative jumps above
 $T_{\mathit{sat}}$
) to the time averaged heat flux
 $\dot{q}$
is negligibly small.
5 Conclusions
In the experimental part of this study the local heat flux
 $\dot{q}$
and local surface temperature as a function of time were measured during transient spray cooling of a very hot and thick target. The main properties of the spray were accurately characterized in order to better understand their influence on the resulting heat flux.
The experiments have shown that the value of
 $\dot{q}$
significantly varies during different spray impact regimes: film boiling regime at the temperatures above the Leidenfrost point, during which the substrate remains apparently dry; the very short transition regime characterized by a rapid increase of the wetted area of the substrate; and fully developed nucleate boiling regime, during which the substrate is covered by a continuous thin liquid film created by spray deposition. These regimes are observed in the experiments using a high-speed video system.
A theoretical model for spray cooling is developed which is able to predict the evolution of the temperature profile in a thin thermal boundary layer in the substrate. A remote asymptotic solution for the heat flux in the fully developed nucleate boiling regime is obtained. The theoretical predictions agree very well with the experimental data over a wide range of spray parameters.
Compared to existing empirical models the present work represents a different approach, where not only the spray but also the thermal conduction of the substrate and the spray fluid temperature are taken into account. We show that the heat flux in the nucleate boiling regime depends on time and the material. Most studies found in the literature deal with spray cooling with a constant surface temperature. In our case, which is relevant to many practical situations, the process is transient due to the continuous decrease of the substrate temperature. This is why the boiling curves found in many empirical models are not relevant for this kind of processes.
Acknowledgements
The authors gratefully acknowledge financial support from the Deutsche Forschungsgemeinschaft (DFG) in the framework of SFB-TRR 75 and the Industrieverband Massivumformung e.V.
Supplementary material
Supplementary material is available at https://doi.org/10.1017/jfm.2019.743.