INTRODUCTION
Winter and spring oilseed rape in the UK and other countries in NW Europe is typically sown between 50 and 120 seeds/m2, with lower rates recommended for hybrid than for open-pollinated varieties. Many growers plan seed rates in kg/ha rather than in seeds/m2, with 100 seeds/m2 is approximately equivalent to 5 kg/ha, but this practice is inaccurate due to a large variation in individual seed weight.
Oilseed rape has a high capacity to compensate for varying population density (Mendham & Salisbury Reference Mendham, Salisbury, Kimber and McGregor1995), such that yield may be unaffected by achieving lower population densities than are currently used. Furthermore, research into optimal nitrogen (N) application rates has established a yield penalty from producing an excessively large canopy (Berry & Spink Reference Berry and Spink2006), which may also apply to excessively dense plant stands. This yield penalty can result from lodging, high light reflectance from the flowers or production of a super-optimal pod density: earlier work has shown that yield is maximized by production of 6000–8000 pods/m2 (Berry & Spink Reference Berry and Spink2006).
No studies have attempted to quantify the economic optimum seed rate for winter or spring oilseed rape. Previous seed rate studies have either used too few seed rates to allow yield response curves to be fitted or the seed rates used have not had a wide enough range to encompass the optimum (Christensen & Drabble Reference Christensen and Drabble1984; Brandt et al. Reference Brandt, Malhi, Ulrich, Lafond, Kutcher and Johnston2007; Hanson et al. Reference Hanson, Johnson, Henson and Riveland2008; Lääniste et al. Reference Lääniste, Joõudu, Eremeev and Mäeorg2008; Sincik et al. Reference Sincik, Goksoy and Turan2010). Angadi et al. (Reference Angadi, Cutforth, McConkey and Gan2003) fitted response curves for the yield response to plant population density of oilseed rape crops grown under arid conditions, but did not estimate the optimum seed rate. It is therefore not known whether the practices of sowing spring sown crops at a greater rate than winter sown crops, or sowing open-pollinated varieties at a higher rate than hybrids are correct. There is also no consensus about the shape of the relationship between seed rate or plant population density and seed yield in oilseed rape. Understanding about how oilseed rape responds to seed rate is poor in contrast to yield responses to seed rate in wheat, which have been described by linear plus exponential curves (Spink et al. Reference Spink, Semere, Sparkes, Whaley, Foulkes, Clare and Scott2000; Whaley et al. Reference Whaley, Sparkes, Foulkes, Spink, Semere and Scott2000) and quadratic or exponential curves (Gooding et al. Reference Gooding, Pinyosinwat and Ellis2002).
The objectives of the present study were to investigate the shape of the oilseed rape yield response to seed rate, establish the economic optimum seed rate and plant population density, and confirm whether the practice of using lower seed rates for hybrid than for open-pollinated varieties is appropriate.
MATERIALS AND METHODS
Experiments
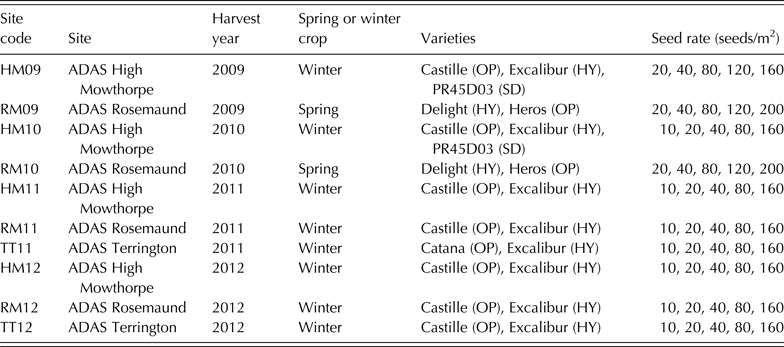
A total of ten field experiments were carried out over harvest years 2009, 2010, 2011 and 2012 near three agricultural experimental stations in the UK; ADAS Rosemaund (RM) (2°36′W, 52°6′N, 80 m a.s.l.) on a silty clay loam (Bromyard series), ADAS High Mowthorpe (HM) (0°30′W, 54°6′N, 160 m a.s.l.) on a shallow silty clay loam overlying chalk (World series) and ADAS Terrington (TT) (0o12′E, 52o48′N, 10 m a.s.l.) on a silty clay loam. Each experiment included either two or three oilseed rape varieties each grown at five seed rates (Table 1) and replicated four times. HM09 and HM10 used a split-plot design with blocks in which each variety was randomized on main plots and seed rate was randomized on sub-plots measuring 24 × 3·5 m. RM12 used a fully randomized design, and all other experiments used a randomized block design, with individual plots measuring 24 × 3·5 m.
Experimental sites, varieties and seed rates used. OP denotes an open-pollinated variety, HY denotes a hybrid variety, and SD denotes a semi-dwarf hybrid variety

The eight winter oilseed rape experiments were sown between 30 August and 17 September. The spring oilseed rape experiments RM09 and RM10 were sown on 18 March 2009 and 9 April 2010, respectively. All experimental crops followed winter wheat and were in rotations that included winter cereals, winter beans and oilseed rape where oilseed rape was grown at a frequency of between 1-year in three and 1-year in five. The experimental area was ploughed to a depth of c. 25 cm and the experimental crops were drilled using Oyjörd plot drills with 12·5 cm row width. Nitrogen fertilizer was applied to winter oilseed rape at a rate of 220 kg N/ha and to spring oilseed rape at a rate of 120 kg N/ha, which was the estimated economic optimum rate according to Anon (2000). All other crop inputs, including pest, weed and disease control and fertilizers, were applied at levels to prevent nutrients or pests from limiting yield.
Weather conditions
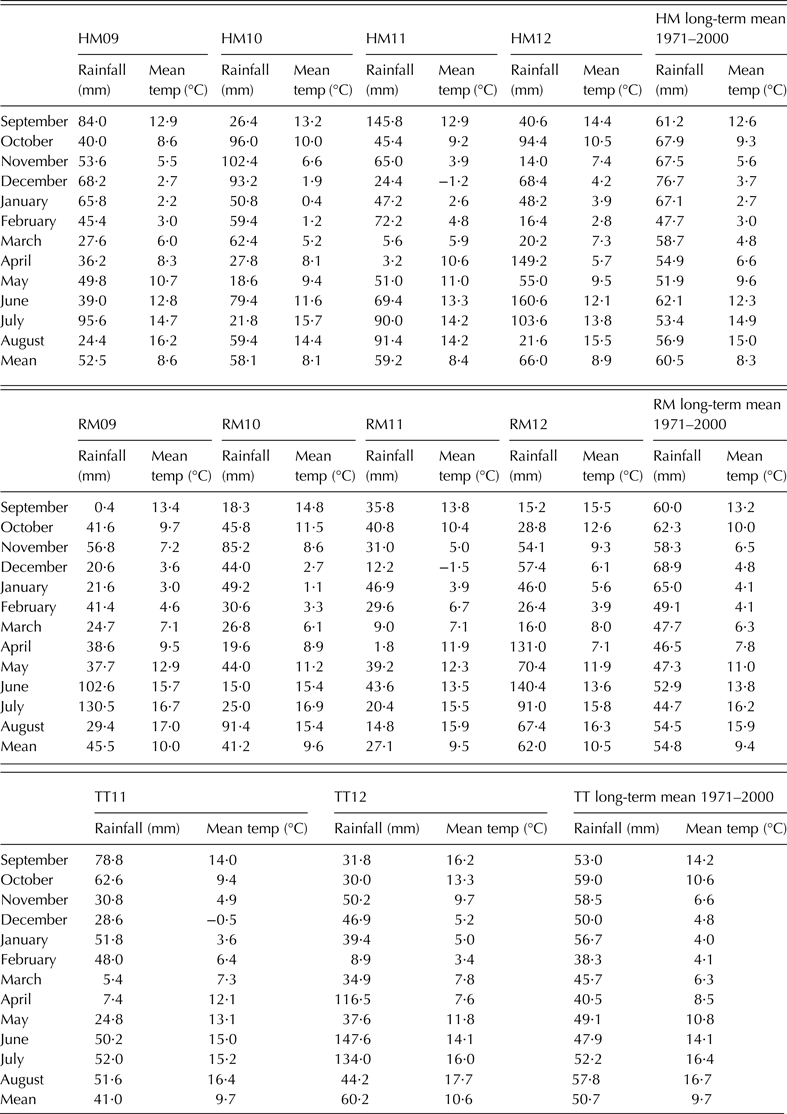
The 2008/09 growing season for the winter oilseed rape at High Mowthorpe (HM09) had similar temperatures and rainfall to the long-term mean (LTM), apart from low rainfall during March and April when 51% of the LTM rainfall fell (Table 2). The 2009 growing season for spring oilseed rape at Rosemaund (RM09) was characterized by a warmer than average spring and summer, with a very wet June and July. The 2009/10 growing season for winter oilseed rape at High Mowthorpe (HM10) was characterized by a cool winter and a dry April/May period when 43% of the LTM rain fell. The 2010 growing season for the spring oilseed at Rosemaund was characterized by a dry June and July when 41% of the LTM rain fell. The 2010/11 season had the most unusual weather of any of the growing seasons due to very low rainfall in March and April when 8, 11 and 15% of the LTM rain fell at High Mowthorpe, Rosemaund and Terrington, respectively. This growing season also had a cold December and warmer than average spring. The 2011/12 season was characterized by wetter than average spring and summer periods at High Mowthorpe, Rosemaund and Terrington.
Weather conditions

Measurements
Plant population density was assessed at all sites by quadrat counts. At HM09, HM10, RM09 and RM10, plants were counted in five 0·25 m2 quadrats per plot in March or April; at HM11 plants were counted in one 1 m2 quadrat per plot in July; and at RM11, TT11, HM12, RM12 and TT12, plants were counted in three 0·25 m2 quadrats per plot in September, October or November.
Counts of pods, flowers, flower buds and blind flower stalks were done at mid-flowering (GS4,5; Sylvester-Bradley & Makepeace Reference Sylvester-Bradley and Makepeace1984) at HM09, HM10, RM09 and RM10. Counts were done on the number of plants equivalent to 0·25 m2 crop, sampled from around the plot. In the same experiments within 3 weeks before the harvest, the number of pods was counted on the same number of plants.
Lodging was assessed at harvest at all sites. The percentages of plot area leaning (at 9–45° from vertical), lodged (at 45–85° from vertical) and lodged flat (at 85–90° from vertical) were recorded and the lodging index on a 0–100 scale was calculated as [percentage area leaning + 2 × (percentage area lodged) + 3 × (percentage area lodged flat)]/3.
Seed yield was assessed at all sites using a Sampo plot combine on an individual plot area of at least 40 m2. Seed moisture was measured using a Dickey John GAC 2000 grain analysis computer (Church Industries, Minneapolis), and the yield results was corrected to t/ha at 91% dry matter.
Statistical analysis
Analysis of variance procedures for a split-plot design (HM09, HM10), randomized block design (RM09, RM10, HM11, RM11, TT11, HM12, TT12) or fully randomized design (RM12) were used to assess the effects of variety and seed rate on plant population density, flower and pod counts, lodging and seed yield.
Linear and exponential regressions were used to establish the effects of seed rate and variety on plant population density. The variety treatment factor was included within the regression analyses carried out using Genstat as a ‘group’ in order to investigate whether varieties responded differently to seed rate. Linear and exponential regressions were fitted to the individual plot data in the form of Eqn (1) or (2), respectively, where P is the population density (plants/m2), S is the seed rate (seeds/m2) and A, B and R are the fitted parameters. Each linear or exponential function was fitted using a stepwise process involving the following steps: (i) fitting a common best-fit line to all varieties, (ii) fitting parallel best-fit lines for each variety by allowing constants to vary, (iii) fitting non-parallel best-fit lines for each variety by allowing all linear parameters (A and B) to vary, and (for exponential curves only), (iv) fitting non-parallel curves for each variety by allowing all parameters to vary. The sums of squares explained at each stage was calculated, and a variance ratio test was made of the improvement in fit over the previous model. If there was no significant improvement between two stages, then the previous model was taken as the best description of the data.
 $$P\, = \,A\, + \,BS$$
 $$P\, = \,A\, + \,BR^S $$
Linear plus exponential curves with groups were fitted to the individual plot data for seed yield in the form of Eqn (3), where Y is the seed yield (t/ha), S is the seed rate (seeds/m2) and A, B, C and R are the fitted parameters. Each linear plus exponential function was fitted using a stepwise process involving the following steps: (i) fitting a common curve to varieties; (ii) fitting parallel curves for each variety by allowing parameter A to vary; (iii) fitting non-parallel curves for each variety by allowing parameters A, B and C to vary, but with common R values; and (iv) fitting non-parallel curves for each variety by allowing all parameters to vary. The sums of squares explained at each stage was calculated, and a test was made of the improvement in fit over the previous model. If there was no significant improvement between two stages, then the previous model was taken as the best description of the data.
 $$Y\, = \,A\, + \,BR^S \, + \,CS$$
The economic optimum seed rate (S OPT) was determined from the fitted parameters in Eqn (4). Equation (4) is derived by differentiating Eqn (3) to give the slope at any part of the curve, then rearranging the equation to calculate S OPT for the part of the curve with slope k, where k is the break-even price ratio between purchased seed (£/t) and harvested seed (£/t). It was calculated using open-pollinated seed cost of £12000/t, hybrid seed cost of £32000/t, individual seed weight of 0·005 g and seed yield price of £350/t (at 91% dry matter), as in Eqn (5), giving values of 1·714 for open-pollinated varieties and 4·571 for hybrids. These seed costs for seed treated with a standard fungicide were obtained from oilseed rape breeders in May 2013, and the seed yield price from market data at the same time.
 $$S_{{\rm OPT}} \, = \,({\rm ln}(k/{\rm 1}000-C)-{\rm ln(}B\,{\rm ln}R{\rm ))}/{\rm ln}R$$
 $$k\, = \,{\rm seed \, cost}\, \times \,{\rm seed \, weight}\, \times \,{\rm 1}0 / {\rm seed \, yield \, price}$$
The yield at the optimum seed rate was then calculated by substituting S OPT into Eqn (3).
Genstat 14th edition (VSN International 2011) was used for all statistical analyses.
RESULTS
Site conditions
Sites RM09, HM11, RM11 and TT11 suffered drought conditions in spring between green bud (GS3,3; Sylvester-Bradley & Makepeace Reference Sylvester-Bradley and Makepeace1984) and flowering (GS4,5), with March and April rainfall amounting to 8–15% of the 30-year mean. Experiments HM09, HM10, RM10, HM12, RM12 and TT12 received adequate rainfall.
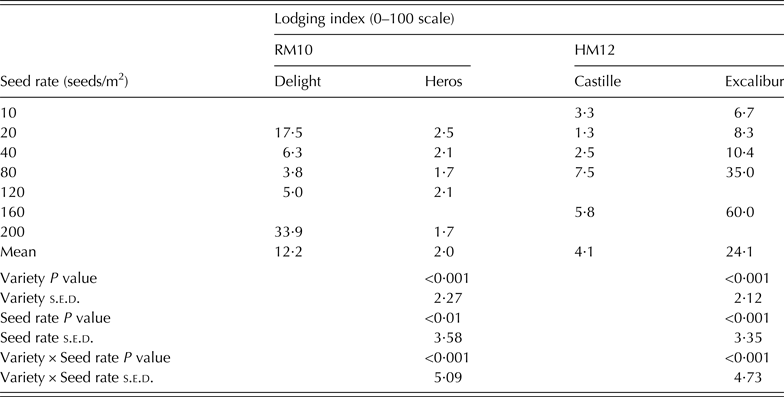
Leaning and lodging occurred at RM10, HM12 and RM12; there was no leaning or lodging at the other seven sites. At RM10 and HM12 the lodging was significantly more severe in the hybrid than in the open-pollinated variety and lodging severity increased with increasing seed rate for the hybrids (Table 3). At RM12, Excalibur sown at 80 and 160 seeds/m2 had lodging indices of 25 and 69, respectively, with negligible amounts of lodging in the lower Excalibur seed rate treatments or any of the Castille seed rate treatments. Lodging was most severe at HM12, where at the highest seed rate, 0·80 proportion of the plot area of Excalibur was lodged at more than 45° from vertical.
The effects of seed rate (seeds/m2) on lodging index at RM10 and HM12 for open-pollinated oilseed rape varieties Heros and Castille, and hybrid varieties Delight and Excalibur
No lodging occurred at the other sites. Lodging index is calculated as [(percentage plot area leaning at 9–45° from vertical) + 2 × (percentage plot area lodged at 45–85° from vertical) + 3 × (percentage plot area lodged flat at 85–90° from vertical)]/3.
Plant establishment
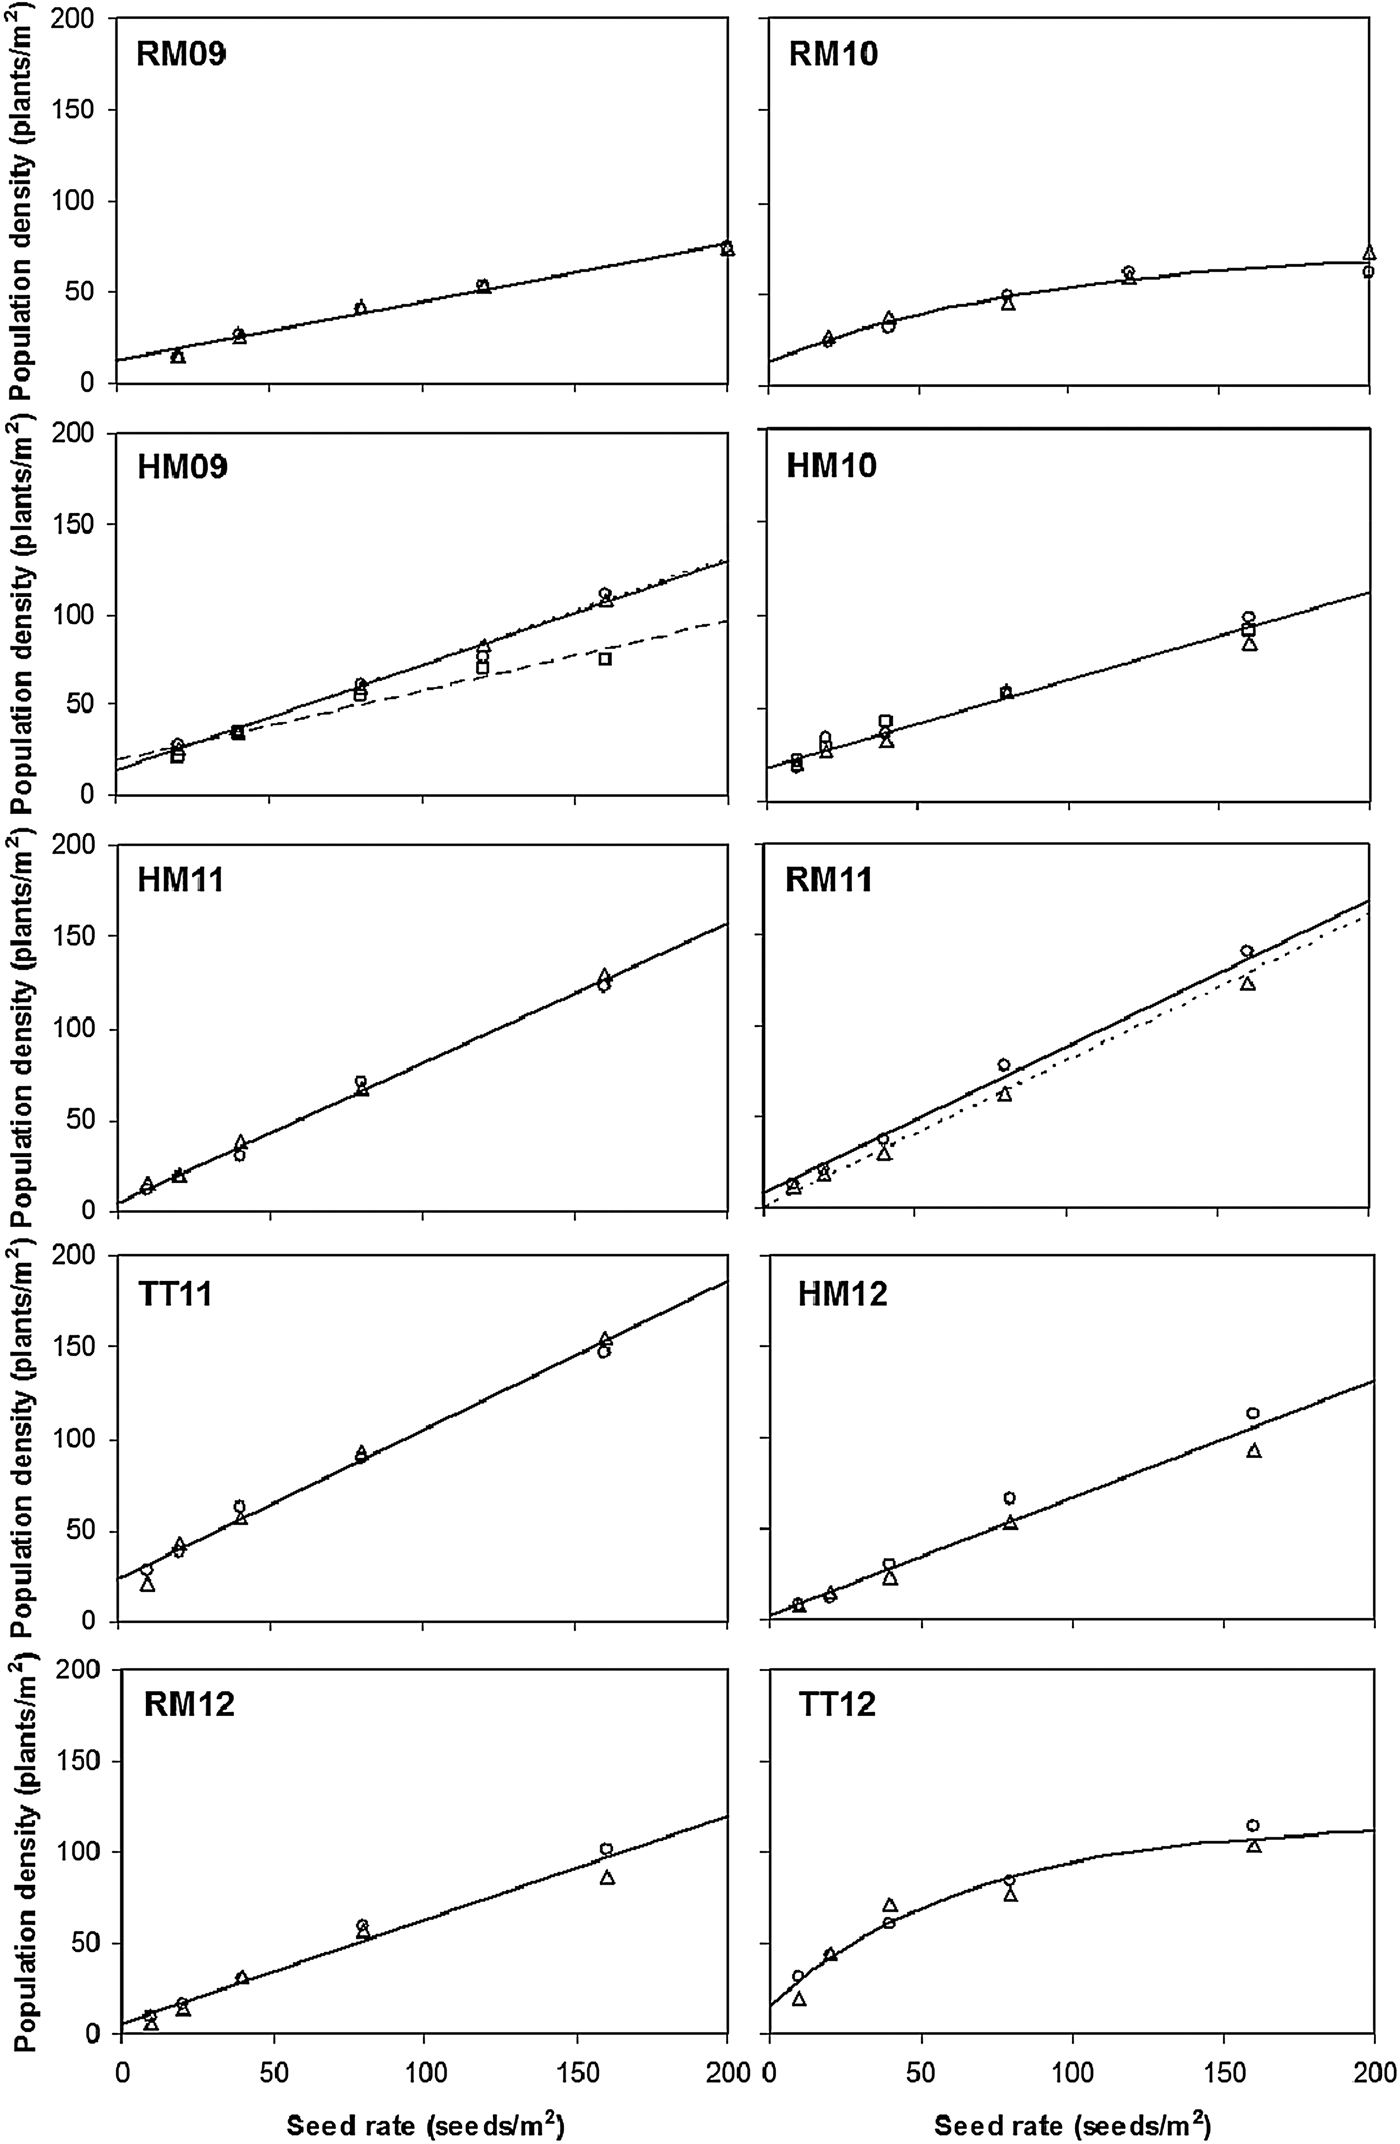
Plant population density was affected by seed rate at all sites (P < 0·001). The number of plants established were reasonably consistent between the replicates with least significant differences between the seed rate treatments (95% level of confidence) ranging from 4 to 10 plants/m2. Variety had an effect at HM09 and RM11 (P < 0·01), but there were no significant interactions between seed rate and variety at any site. At RM10 and TT12 the effect of seed rate on population density was best explained by exponential curves, which explained 0·64 proportion of variation at RM10, compared to 0·59 for a linear relationship, and 0·68 proportion of variation at TT12, compared to 0·64 for a linear relationship. At all other sites, there was <0·015 proportional difference in the variation explained by fitting linear or exponential curves to the relationship between population density and seed rate, hence linear relationships were preferred (Fig. 1). These were explained between 0·79 and 0·95 proportion of variation.
The effects of seed rate (seeds/m2) on population density (plants/m2) for open-pollinated varieties Heros, Castille and Catana (Δ, dotted lines), hybrid varieties Delight and Excalibur (o, solid lines) and semi-dwarf hybrid variety PR45D03 (□, dashed lines): mean data points and fitted linear regressions or exponential curves for each variety. Plant counts were done on spring crops RM09 and RM10 in March (GS 1,9), and on winter crops HM09 in March (GS 2,1), HM10 in April (GS 3,1), HM11 in July (GS 9,9), RM11 in September (GS 1,2), TT11 in November (GS 1,2), HM12 and RM12 in October (GS 1,2), and TT12 in November (GS 1,3).
The relationships between the seed rate and population density (Fig. 1) show positive intercepts on the x-axis, indicating that oilseed rape plants would have been observed even if zero seeds had been sown. The most likely explanation for this is the growth of volunteer oilseed rape plants from seeds shed by previous oilseed rape crops. The analyses in Fig. 1 indicate that average volunteer oilseed rape population density ranged from 2 to 23 plants/m2. The plant establishment rate expressed as a proportion of sown seed ranged from 0·32 to 0·82, with an average of 0·56 across all sites.
Seed yield
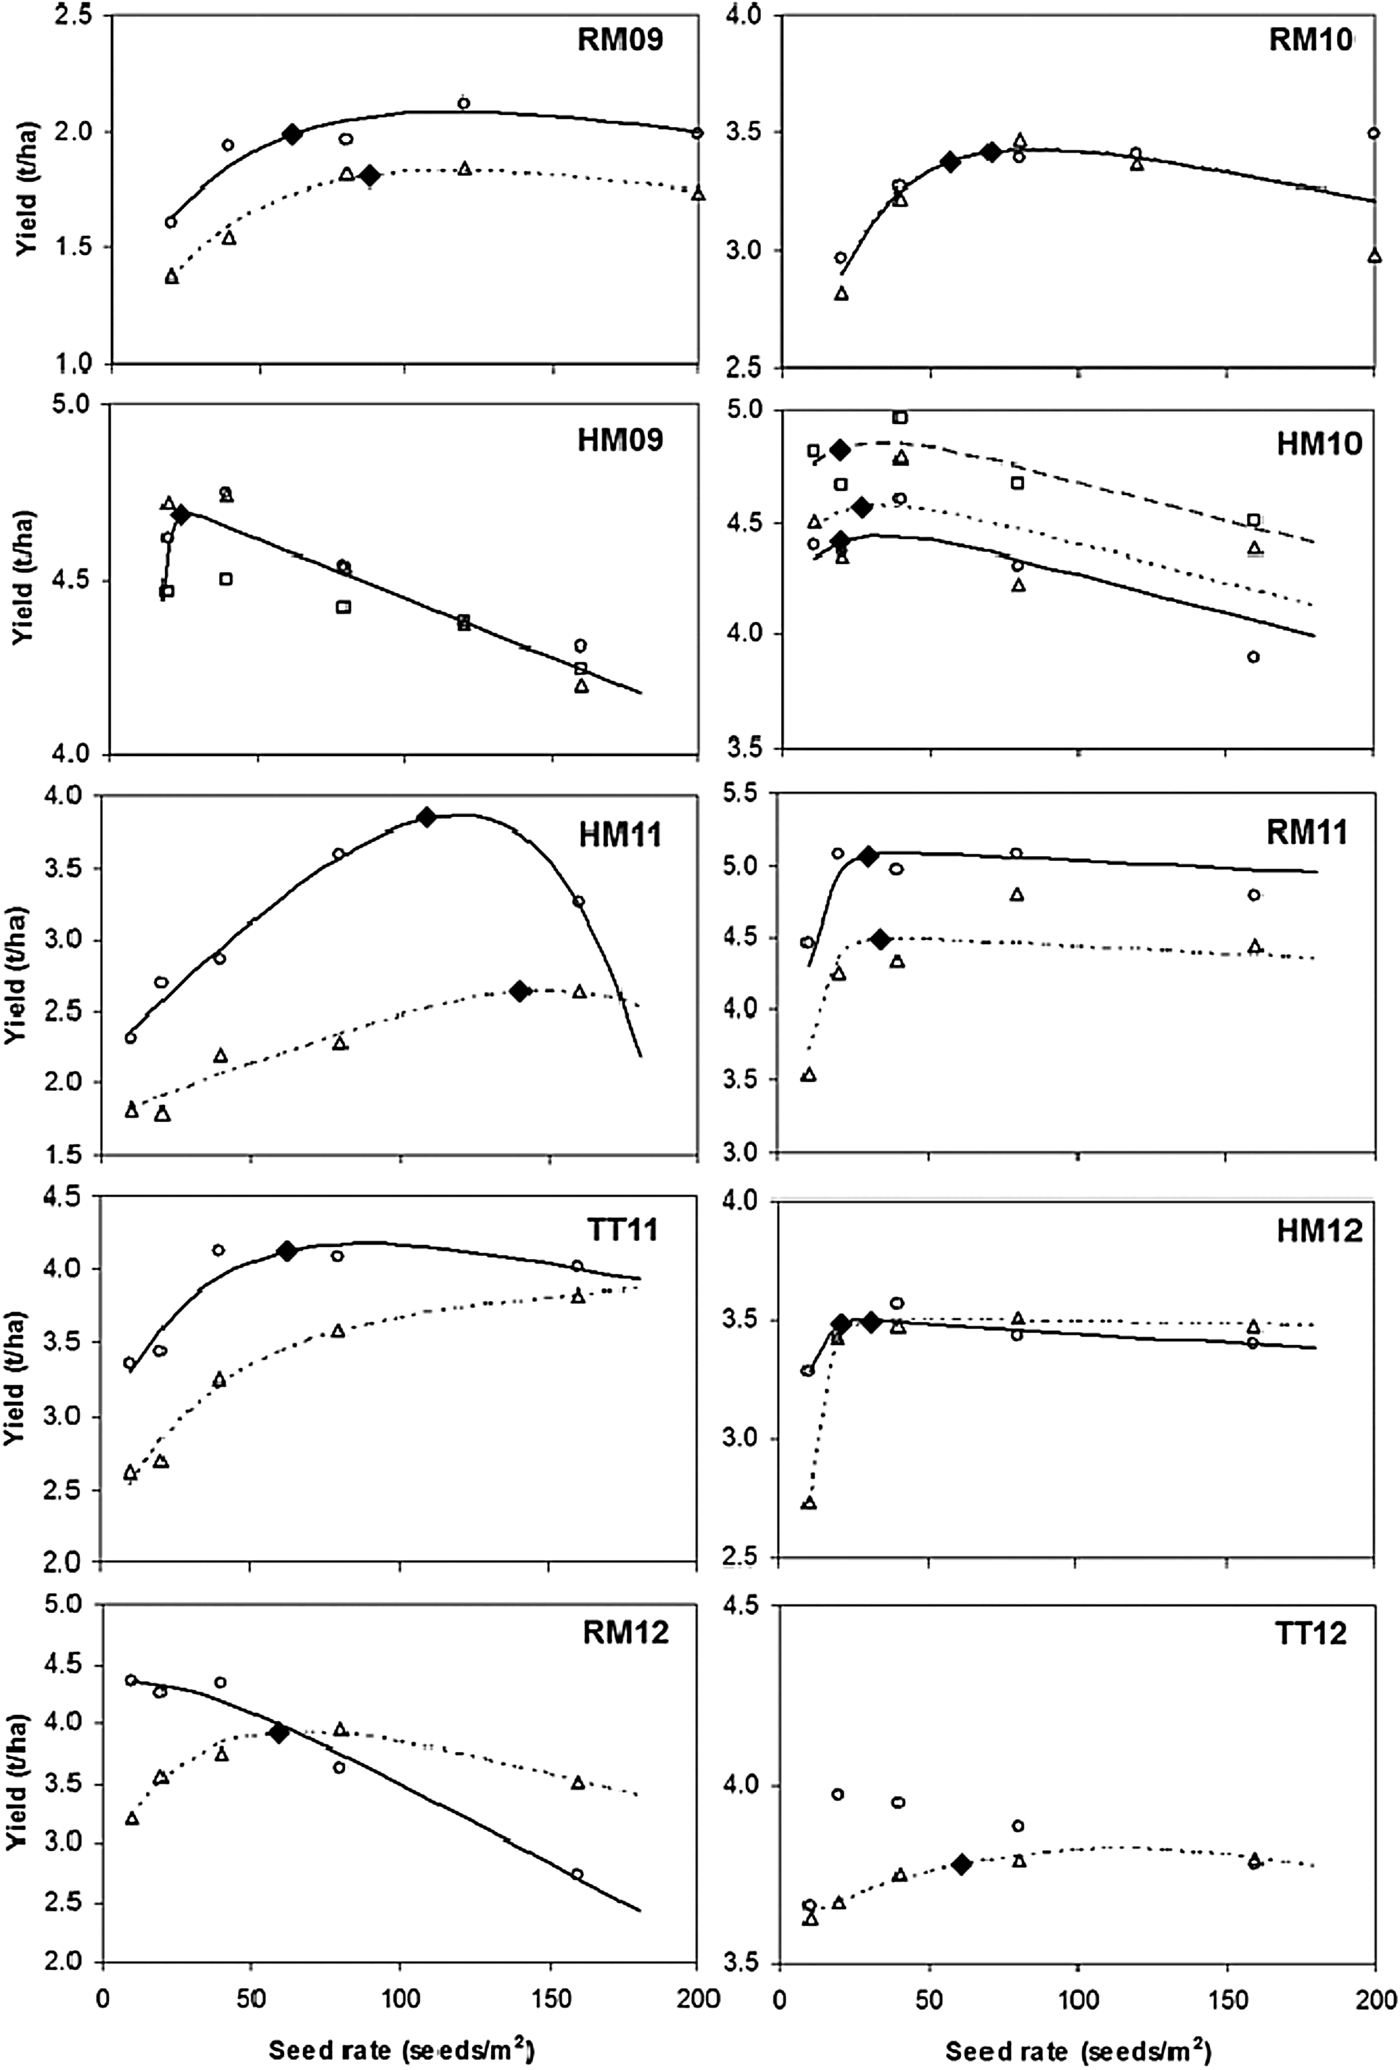
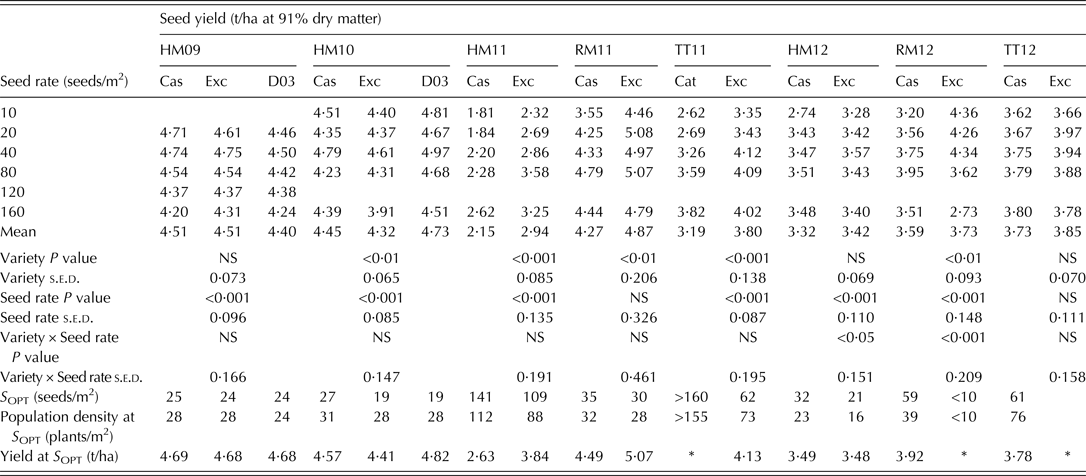
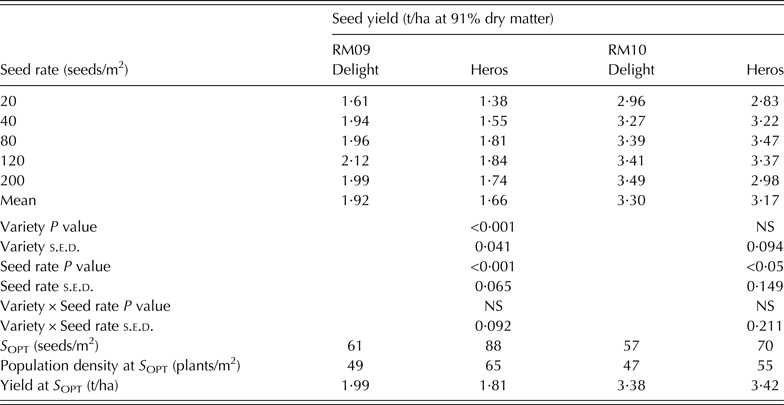
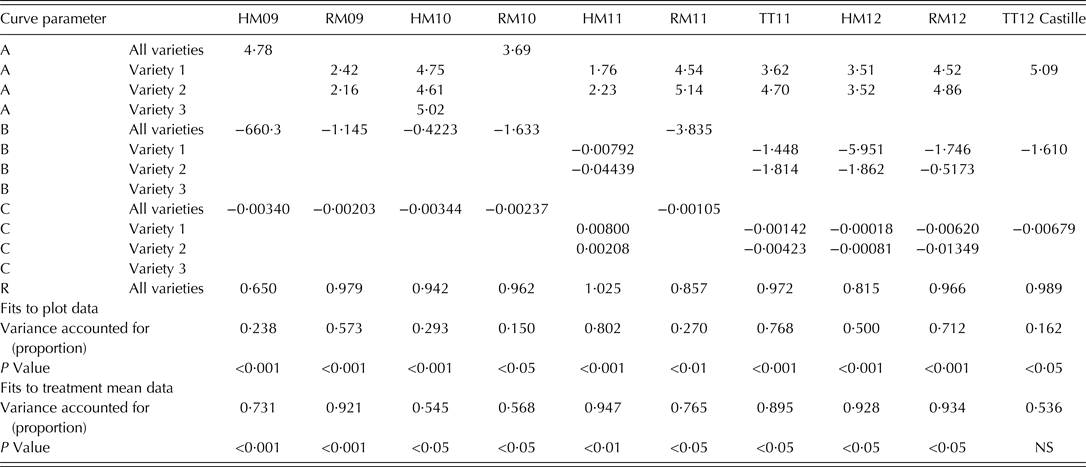
Seed yield was affected by seed rate at all sites except RM11 and TT12 (P < 0·05) (Tables 4 and 5). The relationship between seed rate and yield was best described by linear plus exponential curves (Fig. 2; Table 6) because yield generally increased above the lowest seed rate and decreased at the highest seed rate. At HM09 and RM10 there was no significant improvement for fitting separate curves for the varieties, and the single response curves explained 0·24 (P < 0·001) and 0·15 (P < 0·05) proportions of variance, respectively (Table 6). At HM10, RM09 and RM11, parallel curves were fitted for each variety, explaining 0·29 (P < 0·001), 0·57 (P < 0·001) and 0·27 (P < 0·01) proportions of variance, respectively. At HM11, TT11, HM12 and RM12, regression analysis supported the fitting of non-parallel curves for each variety by allowing all linear parameters to vary, which explained 0·80 (P < 0·001), 0·77 (P < 0·001), 0·51 (P < 0·001) and 0·71 (P < 0·001) proportions of variance, respectively. At TT12 no curve could be found that satisfactorily fitted variety Excalibur, but a linear plus exponential was fitted to variety Castille which explained 0·16 proportion of variance (P < 0·05).
The effects of seed rate (seeds/m2) on the seed yield (t/ha at 0·91 proportion of dry matter) of open-pollinated varieties Heros, Castille and Catana (Δ, dotted lines), hybrid varieties Delight and Excalibur (o, solid lines) and semi-dwarf hybrid variety PR45D03 (□, dashed lines): mean data points and exponential plus linear fitted curves for each variety. Filled diamonds (♦) show yields at economically optimal seed rates.
The effects of seed rate (seeds/m2) on seed yield (t/ha at 91% dry matter) for open-pollinated winter oilseed rape varieties Castille (Cas) and Catana (Cat), hybrid variety Excalibur (Exc) and semi-dwarf hybrid variety PR45D03 (D03) at eight sites
Economically optimal seed rate (S OPT) and yield at S OPT were calculated from fitted linear plus exponential response curves. Population density at S OPT was calculated from fitted linear or exponential responses of population density to seed rate.
* Optimum seed rate could not be obtained for Catana at TT11 as fitted yield response curve did not reach a maximum over the range tested, or for Excalibur at RM12 as yield decreased as seed rate increased. For Excalibur at TT12 the yield response could not be satisfactorily described by the curves tested.
The effects of seed rate (seeds/m2) on seed yield (t/ha at 91% dry matter) for open-pollinated spring oilseed rape variety Heros and hybrid variety Delight at two sites
Economically optimal seed rate S OPT and yield at S OPT are calculated from fitted linear plus exponential response curves. Population density at S OPT is calculated from fitted linear or exponential responses of population density to seed rate
Parameters of the fitted linear plus exponential curves for the response of yield to seed rate
Variety 1: Castille (HM10; HM11; RM11; RM12; TT12); Catana (TT11); Delight (RM09).
Variety 2: Excalibur (HM10; HM11; RM11; RM12; TT11); Heros (RM09).
Variety 3: PR45D03 (HM10).
Variety had an effect on yield at all sites except HM09, RM10, HM12 and TT12 (P < 0·01) (Tables 4 and 5). There were significant interactions between the variety and seed rate only at HM12 and RM12 because the yield of Excalibur decreased at the highest seed rate whereas the yield of Castille continued to increase (Table 4).
Economically optimal seed rates (S OPT) for winter oilseed rape ranged from <10 to 141 seeds/m2, and could not be calculated for Catana at TT11 as the yield response curve failed to reach a maximum or for Excalibur at TT12 as the yield response to seed rate could not be described satisfactorily by any of the curves tested (Fig. 2; Table 4). Economically optimal seed rates for spring oilseed rape ranged from 57 to 88 seeds/m2. The highest optimal seed rates were at HM11 and TT11, both of which were affected by spring drought. At sites where the fitted yield response curve did not differ significantly between varieties (HM09 and RM10) or the yield response curves were parallel (HM10, RM09 and RM11), the optimal seed rate for the open-pollinated variety was 1–27 seeds/m2 higher than the hybrid variety due to the lower cost of open-pollinated seed. The range in difference between optimum seed rates for open-pollinated and hybrid varieties was because the yield response curves had different shapes (Fig. 2). At HM11, TT11, HM12 and RM12, where separate curves were fitted for each variety, the optimal seed rate for the open-pollinated variety was 11 to 49 seeds/m2 higher than the hybrid variety.
Flower and pod numbers
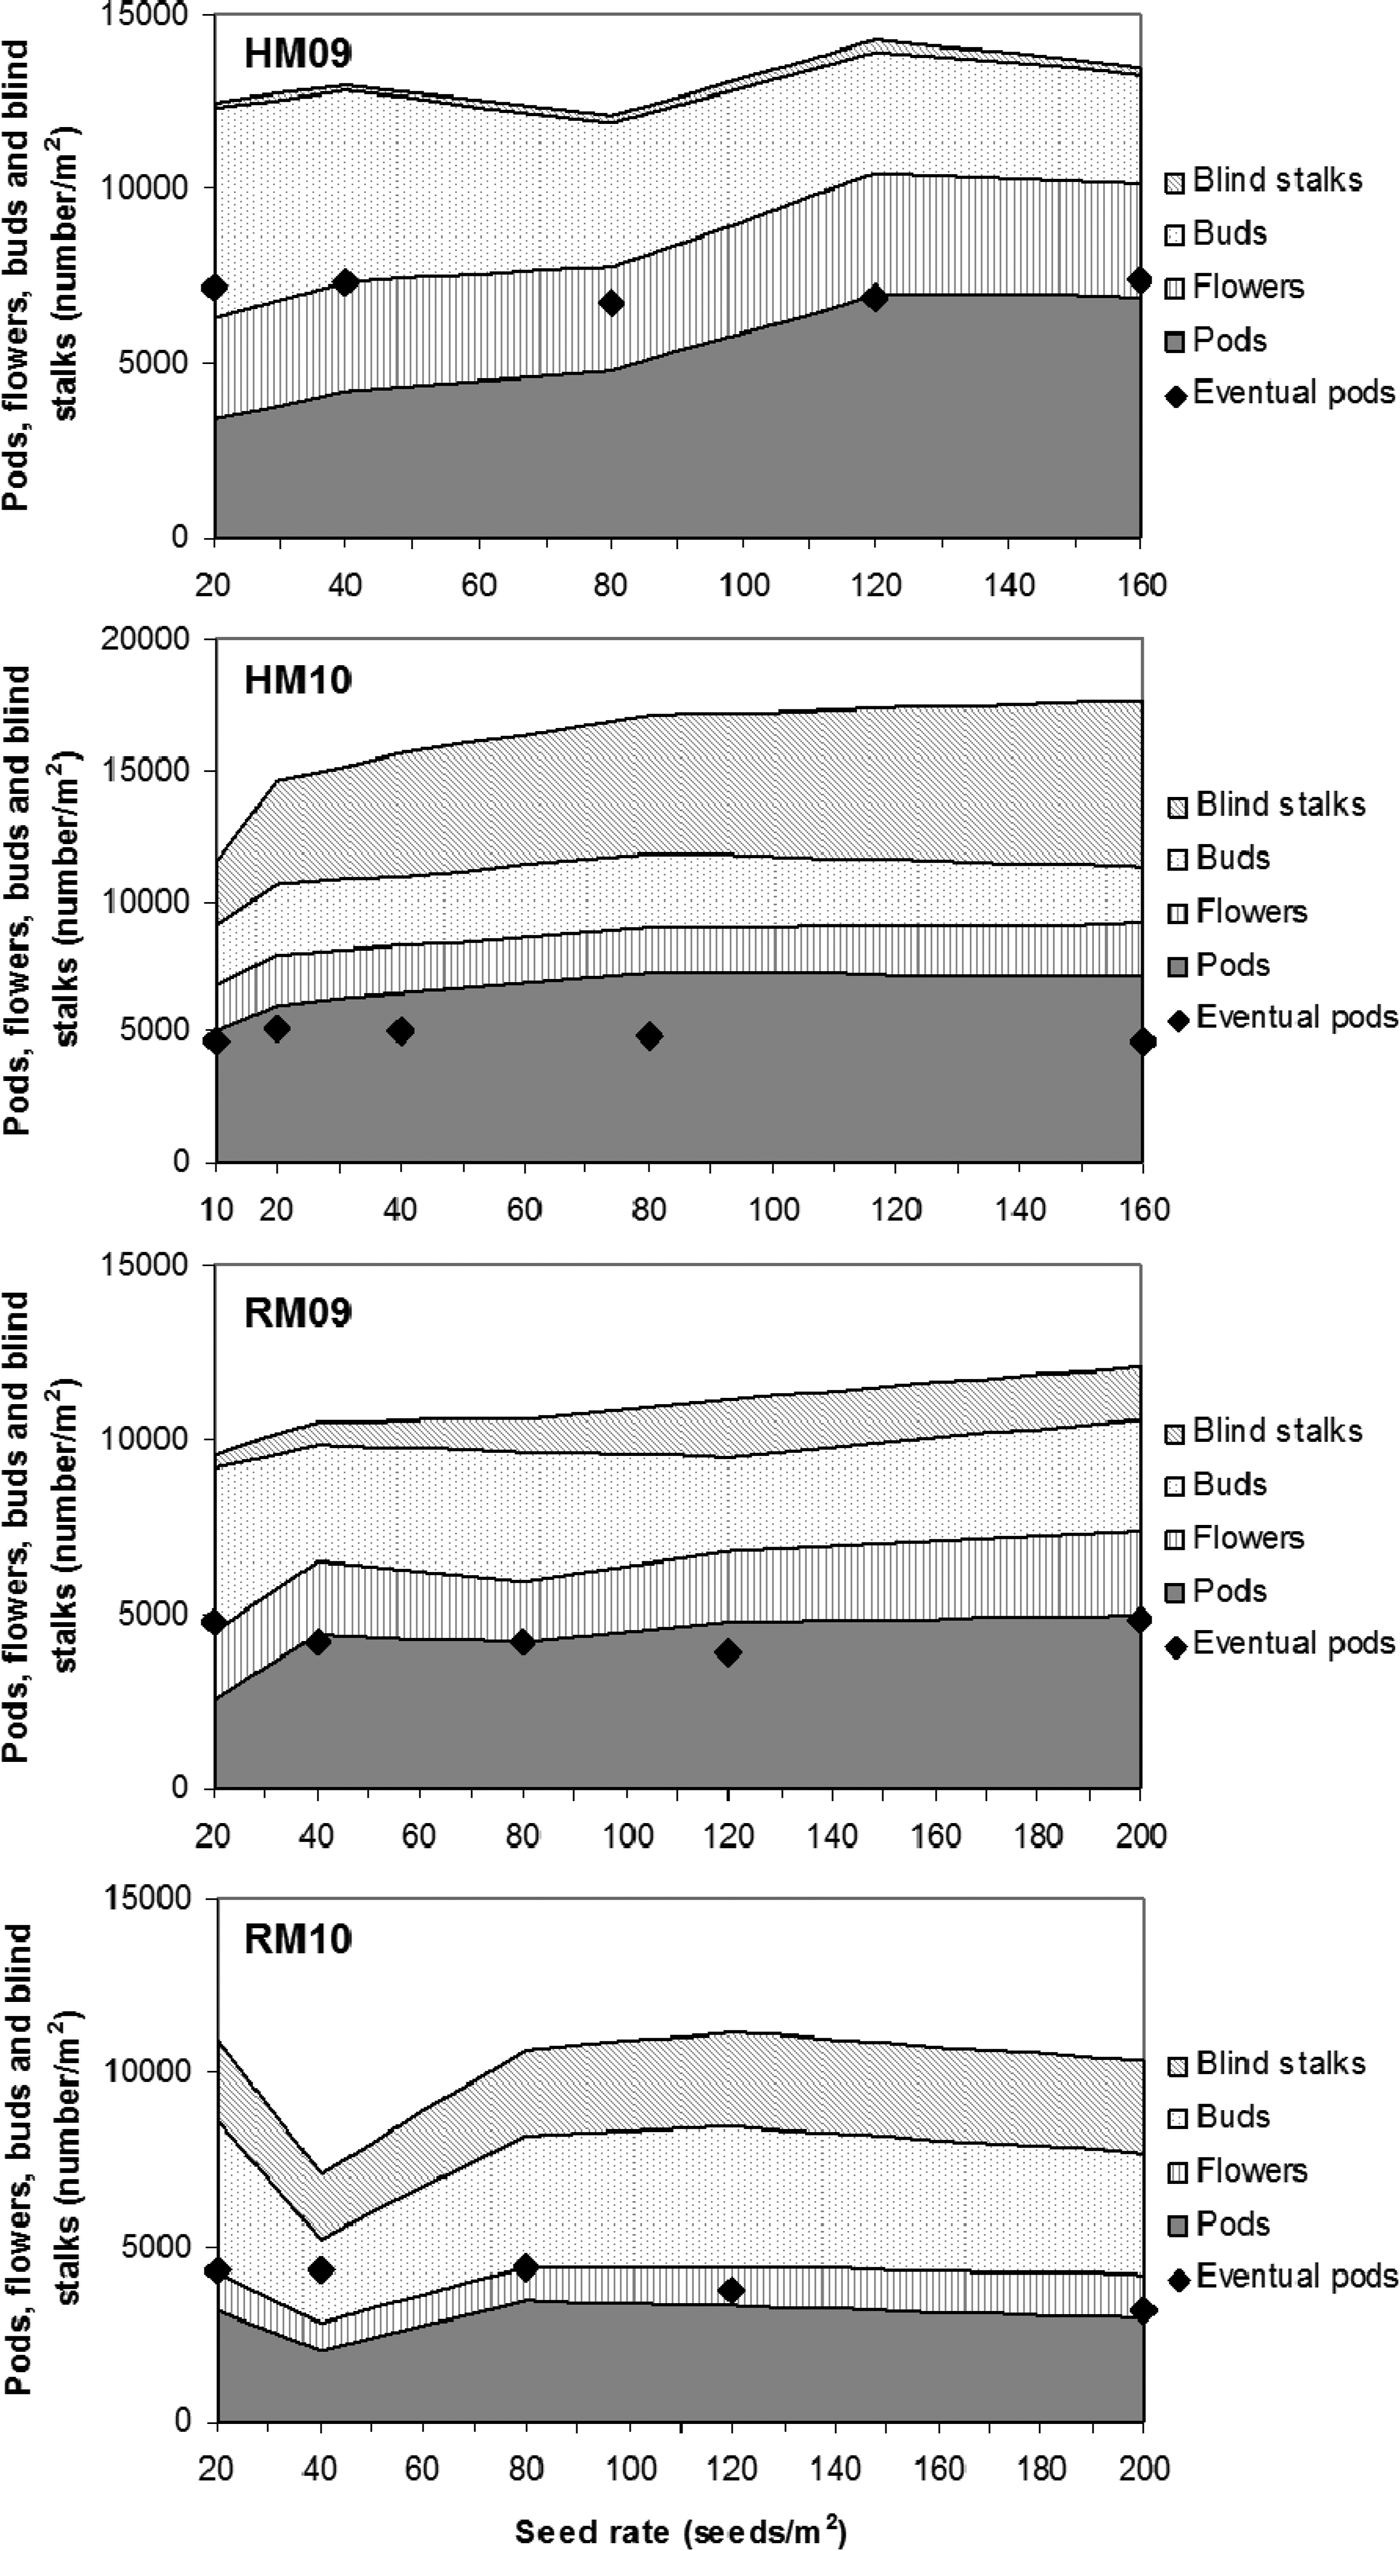
In the winter oilseed rape experiment at HM09, increasing seed rate significantly increased the number of pods and reduced the number of remaining flower buds at mid-flowering, showing that the plots sown at higher seed rates were more advanced in flower opening and pod formation (Fig. 3). However, the seed rate did not affect the combined number of pods, flowers, buds and blind stalks at mid-flowering, or the eventual pod numbers at harvest. There were significant effects (P < 0·001) of variety on pod and flower numbers at mid-flowering, with Castille and Excalibur being more advanced than PR45D03 in terms of pod formation.
The effects of seed rate (seeds/m2) on numbers /m2 of pods, flowers, buds and blind stalks at mid-flowering (stacked areas) and eventual pod number /m2 (♦) at harvest. Data are averaged across three varieties at HM09 and HM10 and across two varieties at RM09 and RM10.
At HM10, the seed rate had a significant effect (P < 0·001) on the number of pods and blind stalks at mid-flowering, with the higher seed rates having more pods and more blind stalks (Fig. 3). There was no effect of seed rate on eventual pod numbers at harvest, and no effects of variety on any measurement.
In the spring oilseed rape experiment at RM09, seed rate had a significant effect (P < 0·05) on the number of pods and blind stalks at mid-flowering, with the higher seed rates having more pods and more blind stalks (Fig. 3). However, the seed rate did not affect the combined number of pods, flowers, buds and blind stalks at mid-flowering, or the eventual pod numbers at harvest. There were significant effects (P < 0·001) of variety on flower bud and flower numbers, with Heros having more than twice as many flowers and buds than Delight at mid-flowering, but no effects of variety on pod or blind stalk numbers at mid-flowering. At harvest, Heros had 25% fewer pods/m2 than Delight (P < 0·05), despite the higher density of flowering sites.
In the spring oilseed rape experiment at RM10, seed rate had a significant effect (P < 0·05) on the number of pods at mid-flowering, with fewer pods at 20 seeds/m2 than at other seed rates (Fig. 3). There was no effect of seed rate on any other measurement. Delight had significantly more buds/m2 (P < 0·001) but fewer pods/m2 (P < 0·001) than Heros at mid-flowering, indicating that it was slower to mature. At harvest, Heros had 36% fewer pods/m2 than Delight (P < 0·001).
At all sites the number of pods at harvest were considerably lower than the combined number of pods, flowers and buds at mid-flowering, indicating that not all flowers resulted in fertile pods and/or pods were lost between the end of flowering and harvest.
DISCUSSION
The present study has used linear plus exponential curves to describe the oilseed rape yield response to seed rate. No previous studies can be found that have tested a sufficient number of seed rates or plant population densities for oilseed rape to enable statistically valid curve fitting and calculation of economically optimal seed rates. Hence, there is no consensus in the published literature on the shape of the relationship between seed rate or plant population density and oilseed rape seed yield. Exponential (asymptotic) curves have been used to describe the yield response to seed rate for several crop species including soybean (Lee et al. Reference Lee, Egli and TeKrony2008), faba bean (Loss et al. Reference Loss, Siddique, Jettner and Martin1998), dry bean (Shirtliffe & Johnston Reference Shirtliffe and Johnston2002) and lentil (Siddique et al. Reference Siddique, Loss, Regan and Pritchard1998) but these do not allow for a yield decline at super-optimal plant populations, which occurred to a marked extent in some of the oilseed rape experiments reported in the present paper. Angadi et al. (Reference Angadi, Cutforth, McConkey and Gan2003) fitted quadratic curves to the oilseed rape yield response to plant population density. Quadratic curves have also been used for plotting the yield response to seed rate or plant population in durum wheat (Kiliç & Gürsoy Reference Kiliç and Gürsoy2010), hard red spring wheat (Faris & De Pauw Reference Faris and De Pauw1980) and winter wheat (Gooding et al. Reference Gooding, Pinyosinwat and Ellis2002). Linear plus exponential curves have also been used to explain the response of winter wheat to increasing seed rate (Whaley et al. Reference Whaley, Sparkes, Foulkes, Spink, Semere and Scott2000; Spink et al. Reference Spink, Semere, Sparkes, Whaley, Foulkes, Clare and Scott2000). Both quadratic and linear plus exponential curves can be used to find the maximum or turning point of a response curve. The linear plus exponential response curves fitted to individual plot values in the present study are explained between 0·15 and 0·80 proportion of variance. When fitted to treatment means the proportion of variance explained, ranged from 0·54 to 0·95 (Table 6). Most of the experiments in the present study showed a yield decrease in response to high seed rates. It is therefore clear that the choice of curve to be fitted must be able to describe a decreasing yield at super-optimal seed rates. In the present study, fitting quadratic curves did not explain more variance than the linear plus exponential curves. At two sites, either a curve could not be fitted to the data or a linear plus exponential curve explained only a small proportion (less than 0·20) of the variance. At TT12, this occurred because in these experiments the seed rates were not sufficiently low to cause a substantial reduction in the yield despite using seed rates as low as 10 seeds/m2.
Economically optimal seed rates were calculated using the fitted response curves and a ratio of seed cost to the value of the harvested seed, using typical current prices for purchased hybrid and open-pollinated seed. In the case of open-pollinated varieties, growers have the option of ‘home-saving’ seed, thus there is the potential for the cost of open-pollinated seed to be lower. However, even home-saved seed incurs costs for royalty payments to the plant breeder and for cleaning and treating with fungicides and/or insecticides. The sensitivity of the optimum population density to seed price for open-pollinated varieties depends on the shape of the yield response to seed rate. In these experiments, using a home-saved seed price of £6668/t for winter oilseed rape or £6720/t for spring oilseed rape (derived from Nix Reference Nix2011; including the value of seed and costs for cleaning, dressing, testing and royalties), rather than £12000/t, raised optimum seed rate by proportions of between 0·15 and 0·12. The sensitivity of the optima to seed price is lower for hybrids than for open-pollinated varieties, because the higher price of hybrid seed causes the optimum seed rate to be further from the flat part of the curve.
The present study supports the advice that hybrid varieties should be sown at lower seed rates than open-pollinated varieties. For winter oilseed rape, open-pollinated varieties are typically sown at 70–120 seeds/m2 and hybrid varieties at 50–70 seeds/m2 in the UK (Anon 2011). For spring oilseed rape, open-pollinated varieties are typically sown at about 150 seeds/m2 and hybrids at about 120 seeds/m2 (Anon 2012). In the present study, the relationship between seed rate and yield was the same for open-pollinated and hybrid varieties at three of the eight winter sites and at both spring sown sites. Optimal seed rates were 1–8 seeds/m2 lower for the hybrids at these winter sites and 13–27 seeds/m2 lower at the spring sites, only because of the higher seed costs. At all five sites where the varieties had significantly different yield response curves to seed rate, the hybrid varieties had lower optimal seed rates, with the difference ranging from 11 to >90 seeds/m2. The differences in optimum seed rate at these sites were greater than the differences caused by the seed cost alone. The differences in yield response between the varieties were not due to differences in the establishment or survival rates, hence at these five sites, the hybrid variety Excalibur yielded proportionately more at lower population densities than the open-pollinated varieties, Castille and Catana. At two sites, HM11 and TT11, the exceptionally dry spring conditions were probably a factor; the drought appears to have caused a larger reduction in yield and increase in optimal seed rate for the open-pollinated variety than for the hybrid variety.
Yield declined at super-optimal population density, for all varieties and sites except Catana at TT11 and Castille at TT12. Yield decline was not due to reduced establishment at high seed rates, as population density data indicates that at most sites, variation in seed rate did not affect the proportion of seeds sown that established plants. Lodging may have contributed to the yield decline for the hybrid varieties at RM10, HM12 and RM12. Another cause may have been production of an over-large canopy at higher seed rates, which can reduce yield by high light reflectance from the flowers which reduces the number of seeds set per pod and per unit area (Berry & Spink Reference Berry and Spink2006; Lunn et al. Reference Lunn, Spink, Stokes, Wade, Clare and Scott2001). The yield decline appears not to have been due to super-optimal pod density at harvest, since at the four sites where pod numbers were measured, the seed rate did not significantly affect pod density at harvest and the average pod density ranged from 4011 to 7102 pods/m2: earlier work has shown that the yield is maximized by production of 6000–8000 pods/m2 (Berry & Spink Reference Berry and Spink2006). However, it is possible that high seed rate plots had too many pods immediately after flowering, which were then lost through greater pod abortion. A further cause may have been accelerated maturity, as shown by the progress of flower opening and pod formation at HM09 and RM09. These differences in maturity were still visually evident several weeks after flowering, as plots sown at low seed rates remained green for longer than plots at high seed rates. Accelerated flowering and maturity at high population density has also been observed by Brandt et al. (Reference Brandt, Malhi, Ulrich, Lafond, Kutcher and Johnston2007).
It can be concluded from the current experiments that, in the absence of severe spring drought conditions observed at HM11 and TT11, the optimal population density for the UK winter oilseed rape is between 10 and 76 plants/m2. In fact, in these conditions 12 of the 13 individual variety response curves gave an optimum plant population of less than 40 plants/m2 and the overall average optimum plant density across all 13 variety responses was 29 plants/m2 which was achieved from sowing 30 seeds/m2 on an average. Optimal population densities for spring oilseed rape were 47–65 plants/m2, grown from 57 to 88 seeds/m2. To achieve a target population density, it is necessary for growers to predict percentage plant establishment and volunteer population density. The plant establishment rate of sown seed is affected by cultivation, soil conditions and slug pressure, but usually not by seed rate. In the present study, the number of volunteer plants ranged from 2 to 23 plants/m2. These volunteer plants were caused by the germination of un-harvested seed from previous oilseed rape crops grown in the fields in which the experiments were sited. The frequency of oilseed rape grown in the fields used for the experiments was typical of the UK commercial practice and ranged from 1-year in three to 1-year in five. Un-harvested seed has been shown to remain viable in the soil for up to 9-years (Lutman et al. Reference Lutman, Berry, Payne, Simpson, Sweet, Champion, May, Wightman, Walker and Lainsbury2005). The prevalence of oilseed rape volunteer plants is common in the UK, with Squire et al. (Reference Squire, Begg and Askew2003) observing oilseed rape volunteers in 18 out of 23 UK sites assessed between 1987 and 1997.
The number of volunteer plants observed in the experiments of the present study was similar to other European studies, which have counted volunteer plant numbers ranging from 1 to 10 plants/m2 (Söchting et al. Reference Söchting, Gummert and Zwerger2008), 5–9 plants/m2 (Andersen et al. Reference Andersen, Rasmussen and Jørgensen2010) and 30 plants/m2 (Gruber & Claupein Reference Gruber and Claupein2008).
Significantly higher population densities can be required for optimal yield at sites at risk from severe spring drought, as shown at HM11 and TT11. Angadi et al. (Reference Angadi, Cutforth, McConkey and Gan2003) observed a similar effect of drought on the yield response to plant population density for spring oilseed rape, with yield being maintained across 20–80 plants/m2 in a season with adequate rainfall, but declining at population densities below 40 plants/m2 in a dry season, and concluded from this that yield plasticity was less effective at compensating for low population density in environments with low yield potential. Higher population densities may also be required where competition from weeds is high or pressure from pigeon grazing is high.
The use of super-optimal seed rates on the UK farms will reduce gross margins. For each winter oilseed rape site and variety combination, the gross margin of commonly used seed rates of 100 seeds/m2 for open-pollinated varieties or 70 seeds/m2 for hybrids was compared with the gross margin using 30 seeds/m2 for all varieties. For spring oilseed rape, the gross margin of commonly used seed rates of 150 seeds/m2 for open-pollinated varieties or 120 seeds/m2 for hybrids was compared with the gross margin using 70 seeds/m2 for all varieties. Predicted yields were calculated from the fitted response curves. Gross margins were increased for all the four spring oilseed rape site × variety combinations, by £31–£89/ha, and 12 out of 18 winter oilseed rape site × variety combinations, by £2–£204/ha. Gross margin was reduced for the remaining six winter variety × site combinations, by £5–£179/ha. The most severe gross margin reductions occurred at HM11 and RM11, the sites worst affected by spring drought. The average gross margin changes were +£29/ha for winter varieties and +£64/ha for spring varieties.
It is important to note that these experiments were conducted at narrow row widths (12·5 cm). The practice of sowing oilseed rape in wide rows (>25 cm) is gaining popularity in the UK. There is a trend for yield to be reduced by increasing row width (Christensen & Drabble Reference Christensen and Drabble1984; Ozer Reference Ozer2003; Shahin & Valiollah Reference Shahin and Valiollah2009; Sincik et al. Reference Sincik, Goksoy and Turan2010), and it is possible that optimal population density (plants/m2) is lower for wide rows due to increased plant competition within rows. Further experimentation is required to confirm this.
Other areas requiring further work include the effects of sowing date on the yield response to seed rate and population density, and the variation between varieties in their ability to tolerate inter-plant competition. If varieties could be developed which is better to tolerate competition, dense plant stands could be grown to deter pigeon grazing and weed competition, without the yield penalty as observed in the present study at super-optimal population density.
Funding is gratefully acknowledged from the Home Grown Cereals Authority in harvest years 2009 and 2010 and from the Chemicals Regulation Directorate in 2011 and 2012. Thanks also to Chris Dyer of ADAS UK Ltd for statistical help.