I. INTRODUCTION
The continuing trend of device miniaturization has motivated studies on microengineering.Reference Alting, Kimura, Hansen and Bissacco1 In addition to the design, assembly, and modeling/analysis components, microengineering encompasses a broad range of fabrication technologies, including micromechanical machining,Reference Masuzawa2 microelectrical discharge machining,Reference Ho and Newman3 laser beam machining,Reference Meijer4 and microforming.Reference Geiger, Kleiner, Eckstein, Tiesler and Engel5 While the first three fabrication processes are serial in nature, in which the formation of a desired shape/structure takes numerous sequential cuts to achieve, forming is typically a parallel process in which a desired shape/structure is achieved in one or a few steps. To form metal-based microscale shapes/structures with sufficient geometrical simplicity, microforming can achieve higher throughput and lower cost and is thus of current interest.
The presence of various mechanical size effects in microforming complicates straight forward extension of macroscale forming down to the sub-mm/micron scales. Such mechanical size effects also make the prediction of forming behavior more difficult. Out of the four elements of a microforming system, namely materials, processes, tools, and machines,Reference Geiger, Kleiner, Eckstein, Tiesler and Engel5 materials behavior during forming at the sub-mm to micron scales is a key factor in determining forming success. Microforming experiments, similar to their macroscale counterparts, typically involve plastic deformation to large strains. While numerous studies have documented changes in materials’ grain structure and texture due to severe plastic deformation at characteristic specimen sizes ranging from mm to tens of mm,Reference Agnew, Mehrotra, Lillo, Stoica and Liaw6–Reference Pardis, Chen, Ebrahimi, Toth, Gu, Beausir and Kommel9 the modification to materials’ microstructure due to microforming, e.g., changes in grain morphology, size, and texture at characteristic forming dimensions from sub-mm to tens of microns needs to be studied in more detail. Similarly, the mechanical response of materials during microforming needs further study. On the one hand, uniaxial compression of cylindrical specimens showed softening with decreasing specimen diameter, when the specimen diameter is in the range of mm to several hundred microns and the materials’ grain size was maintained constant.Reference Engel and Eckstein10 On the other hand, output from finite element analysis (FEA) modeling of double cup extrusion using stress–strain curves obtained from microcompression experiments does not show good agreement with experimental measurements.Reference Chan, Fu and Lu11
In this paper, a reverse extrusion experiment was conducted on Cu 110 alloy specimens in a simple axisymmetric geometry. A companion continuum plasticity FEA model of the reverse extrusion process was set up, and the output of which was compared to experimental measurements. The present work demonstrates reverse extrusion of Cu over a wide range of characteristic dimensions, assesses changes to Cu grain morphology, size, and texture due to the deformation process, measures the mechanical response associated with the extrusion, compares the measured mechanical response to output from a continuum plasticity FEA, and provides baseline data to aid future work.
II. EXPERIMENTAL PROCEDURES
A simple axisymmetric reverse extrusion die-and-punch set was custom designed and built. Commercial Cu 110 alloy (Cu 99.9 at.%+) specimens were machined into cylindrical rods, 3.0 mm in diameter and 4.0 mm in height. All machined Cu cylinders were vacuum annealed (∼10−7 Torr) at 600 °C for 1 h prior to further experimentation. The Cu cylinders were placed into a nominally 3.0 mm cylindrical hole within a die. During reverse extrusion, cylindrical rod punches with diameters ranging from 2.20 to 2.95 mm were centered with respect to the die hole and compressed into Cu cylinder specimens. Further details on the reverse extrusion setup are provided in the S1 section of the Supplementary Material. This axisymmetric reverse extrusion process produced axisymmetric, cup-shaped Cu parts. The nominal sidewall thickness of the extruded cup varied with the punch diameter D, decreasing from 400 to 25 µm as D increases from 2.20 to 2.95 mm. The total compression force, P, on the punch was measured through a MTS load cell with a full range of 25 kN. The total displacement of the actuator, Δ, was measured from readings of the linear variable displacement transducer attached to the actuator. A set of P–Δ curves were measured as a function of D, with multiple measurements performed at each D value.
To obtain stress–strain curves as input to the continuum plasticity FEA, uniaxial compression experiments were conducted on annealed Cu 110 cylinders. The Cu cylinder specimens, 3.0 mm in diameter and 4.0 mm in height and subjected to the same vacuum annealing treatment as those used in reverse extrusion, were compression tested to different maximum values of strain. Further details on the compression testing setup and procedures are provided in the S2 section of the Supplementary Material. As shown in Fig. S2 in the S2 section, the results obtained from compression testing to different maximum strains were consistent with each other.
A FEI Quanta3D FEG dual-beam scanning electron microscope/focused ion beam (SEM/FIB; FEI, Hillsboro, Oregon) instrument was used to examine the morphology and microstructure of extruded Cu parts. The SEM/FIB instrument included an X-ray energy dispersive spectroscopy attachment (EDAX) and an electron backscatter diffraction (EBSD) attachment (EDAX). The as-annealed Cu cylinders and cup-shaped extruded Cu specimens were mechanically polished, followed by a final vibratory polishing with 50 nm silica suspension on a GIGA 0900 vibratory polisher (Pace Technologies, Tucson, Arizona) for 12 h prior to EBSD examinations. EBSD was performed at 30 kV, at a scan step of 0.5 µm for as-annealed specimens and 0.2 µm for as-extruded ones. Further details on procedures for EBSD measurements and data analysis, including the coordinate definition, including that for the normal direction (ND), rolling direction (RD), and transverse direction for extruded, cup-shaped Cu specimens, are provided in the S3 section of the Supplementary Material. In particular, ND of all processed EBSD data is perpendicular to the cup sidewall and points to the outside of the cup structure. This is in accordance with the physics of reverse extrusion, with ND aligned with the direction in which Cu is being significantly compressed, and in analogy with conventional macroscale sheet metal rolling. Sample texture information, i.e., pole figures (PFs) and orientation distribution functions (ODFs), was obtained by analyzing raw EBSD data with the TSL OIM software. The harmonic series expansion method contained within the TSL OIM software was used, with a series rank of 16 and a Gaussian smoothing half-width of 0.3°. No sample symmetry was used in the texture evaluation.
Site-selective, instrumented nanoindentation was carried out using a NanoMechanics NanoFlip device (NanoMechanics, Inc., Oak Ridge, Tennessee). The NanoFlip was installed into the Quanta3D SEM/FIB instrument, such that indentations were conducted on specimen surfaces observable through SEM imaging before, during, and after indentation. Indents could be placed at the desired locations by moving the sample stage on which the specimen was mounted. Indentations were conducted using a Berkovich diamond indenter. The Oliver–Pharr indenter tip calibration procedures were followed, using a factory-supplied fused silica as the calibration specimen. As detailed further in the S4 section of the Supplementary Material, indentations on well-polished surfaces of as-annealed Cu specimens yielded elastic modulus, E, and hardness, H, values of E = 111 ± 1 GPa and H = 0.69 ± 0.02 GPa, respectively. The measured E value is consistent with the tabulated value for bulk Cu.Reference Callister12
III. FEA PROCEDURES
In addition to the axisymmetric reverse extrusion experiments, an accompanying continuum plasticity FEA model was set up. The die and the punch were assumed to be rigid, and the Cu was assumed to be deformable. The FEA was modeled using the four-node axisymmetric element with reduced integration (CAX4R) in the commercial ABAQUS FEA package (Dassault Systems Simulia Corp., Providence, Rhode Island). The elastic properties of Cu were taken at their bulk values, E of 110 GPa and Poisson’s ratio ν of 0.34. A series of simulations were carried out, varying the diameter of the punch in exact accordance with the D values used in the experiments. In all simulation runs, the plastic behavior of Cu was kept the same and assumed to be that obtained from the uniaxial compression tests on annealed Cu cylinders. Stresses within the elastic–plastic Cu were determined following a large deformation formalism, as implemented within the ABAQUS package.13 The implicit time integration scheme was chosen for all the simulations in the present work. Mesh convergence tests were carried out. Further details on the FEA modeling are provided in the S5 section of the Supplementary Material.
The interaction between contacting surfaces is an important part of the FEA model. Because details on factors influencing this interaction, including the magnitude of normal pressure and tangential relative velocities, were not measured from the present reverse extrusion experiments, the Coulomb’s law of friction was assumed in present FEA simulations, which involve a single material’s parameter, namely the friction coefficient f. Contact conditions between the punch and die walls and the mesh elements were enforced by allowing zero normal separation on the contact boundary. However, the contact boundary was allowed to slide with tangential traction t t = fp, where p is the normal contact pressure. If in the simulation the contact pressure is computed to be negative, then the contact condition is released on that boundary. As detailed later in the results and discussion section, simulations were carried out with different f values and compared to experimental results.
IV. RESULTS AND DISCUSSION
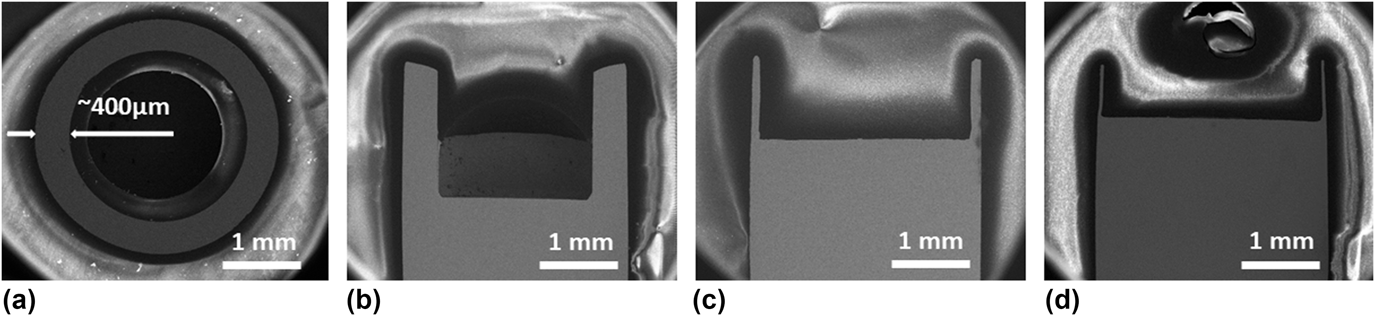
Typical morphologies of cup-shaped Cu specimens obtained from reversed extrusion with punches of different diameters are illustrated in Fig. 1. Figure 1(a) shows a transverse cross-sectional SEM image of one such specimen, extruded using a punch of 2.2 mm in diameter. The thickness of the extruded cup sidewall is ∼400 µm, consistent with the die and punch diameters of 3.0 mm and 2.2 mm, respectively. The sidewall thickness appears to be relatively uniform along the perimeter. The corresponding longitudinal cross-sectional SEM image, shown in Fig. 1(b) and obtained by mechanical polishing of the cup-shaped specimen to approximately the specimen center position, indicates that the extruded cup sidewall is relatively uniform in thickness along the length of the cup. The cup height of the extruded specimen shown in Figs. 1(a) and 1(b) exceeds 1600 µm, corresponding to a height to sidewall thickness ratio over 4. Figures 1(c) and 1(d) show longitudinal cross-sectional SEM images of two additional cup-shaped specimens, extruded using punches of diameters 2.80 and 2.95 mm, respectively. In Figs. 1(c) and 1(d), the cup sidewall heights exceed, respectively, 1000 and 650 µm, corresponding, respectively, to height to sidewall thickness ratios over 10 and over 25. Nonuniformities in sidewall thicknesses along the cup perimeter were observed at larger punch diameters and smaller extruded cup sidewall thicknesses. For example, sidewall thickness measurements on the specimen extruded using the 2.80 mm diameter punch ranged from 100 to 120 µm. Such sidewall nonuniformities reflect, among other factors, random errors in die hole and punch alignment in the present reverse extrusion setup.
SEM images of cup-shaped Cu specimens obtained from reverse extrusion: (a) transverse cross-section of a cup-shaped specimen with a sidewall thickness of ∼400 µm, extruded with a 2.2 mm diameter punch; (b) longitudinal cross-section of the specimen shown in (a); (c) longitudinal cross-section of a cup-shaped specimen with a sidewall thickness of ∼100 µm, extruded with a 2.8 mm diameter punch; (d) longitudinal cross-section of a cup-shaped specimen with a sidewall thickness of ∼25 µm, extruded with a 2.95 mm diameter punch. The substance exhibiting varying contrasts in the images is the epoxy used to encapsulate the specimens prior to mechanical polishing.

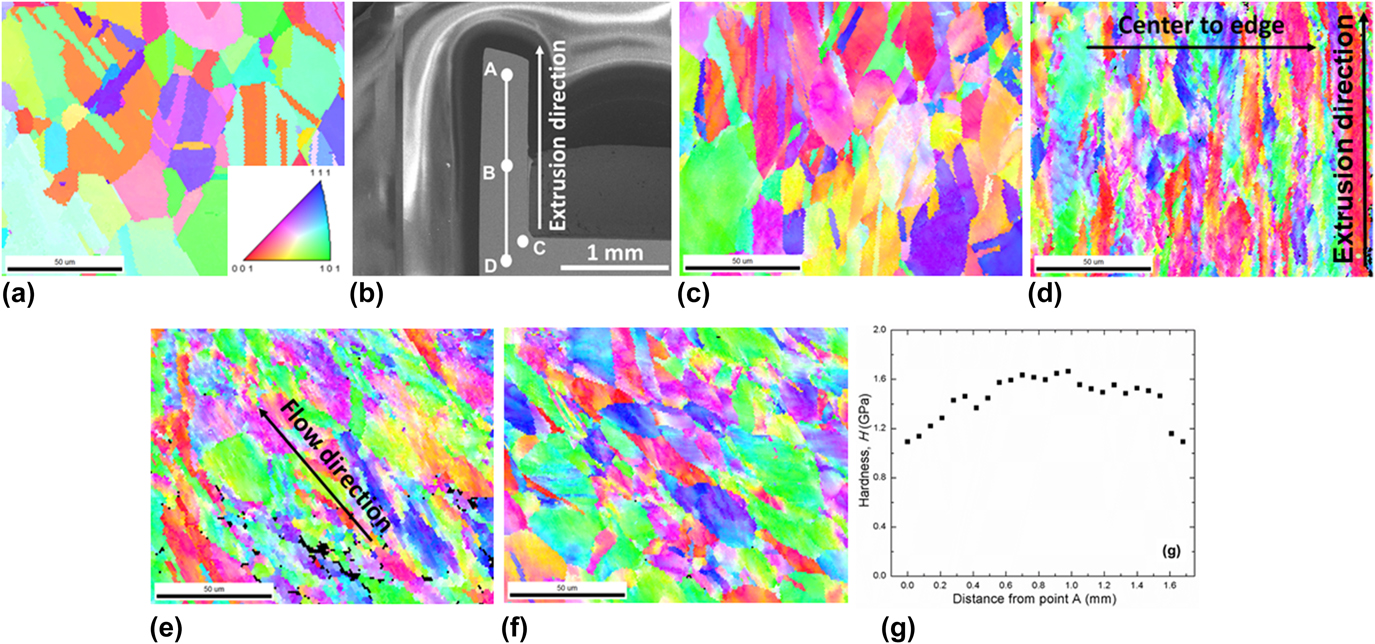
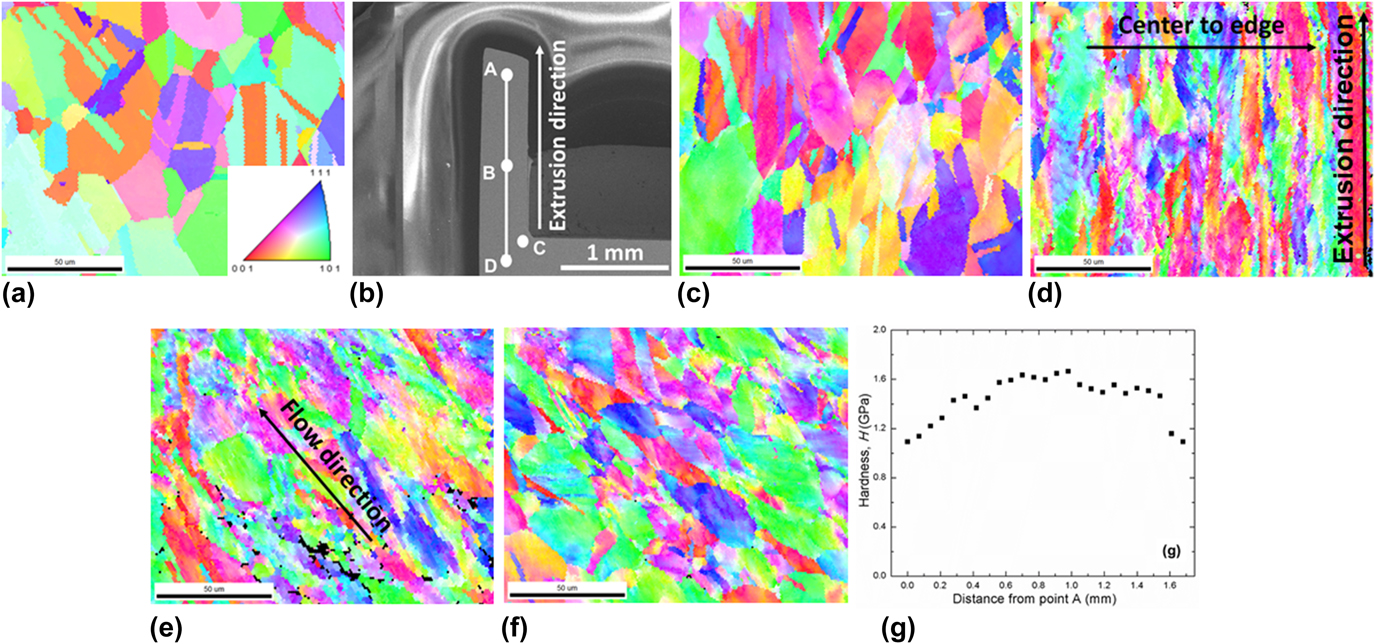
The EBSD orientation maps shown in Fig. 2 illustrate typical Cu grain morphologies. Figure 2(a) shows a typical orientation map obtained from an as-annealed Cu specimen prior to reverse extrusion. Cu grains appear to be mostly equiaxed, with an average grain size of ∼25 µm and twins present within grains. To illustrate the modification to as-annealed Cu grain morphology due to plastic deformation associated with the reverse extrusion process, EBSD orientation maps were obtained from the polished longitudinal cross-sectional surface of an extruded Cu cup with a sidewall thickness of ∼400 µm (punch diameter 2.2 mm), at locations in the middle of the sidewall along the extrusion direction as illustrated in Fig. 2(b). Figures 2(c)–2(f) show EBSD orientation maps obtained at locations A, B, C, and D marked on Fig. 2(b), respectively. At location A [Fig. 2(c)] close to the original specimen surface, the material did not undergo severe plastic deformation and the Cu grain structure exhibits similarity to that of the as-annealed specimen. At location B [Fig. 2(d)] close to half way up the extruded cup sidewall, all Cu grains are elongated along the extrusion direction. Some fibrous grains go through the entire image, from the bottom to the top. This indicates that this area has undergone severe plastic deformation. Also, the width of the fibrous grain appears to decrease from the center of the cup sidewall toward the edge, indicating the existence of differential straining in the extruded cup sidewall. Materials closer to the external surfaces in contact with the punch appear to go through a higher amount of plastic straining, while the plastic strain at the center of the cup sidewall appears to be less. At location C [Fig. 2(e)] close to the bottom corner of the extruded cup, the Cu grain structure appears to be elongated along the material flow direction, as shown by the arrow in Fig. 2(e). At location D [Fig. 2(f)], a smaller degree of Cu grain deformation is evident, consistent with the expectation that the amount of plastic strain at location D should be smaller. Nanoindentation hardness measurements were conducted from location A on the top of extruded cup sidewall to location D along the straight line in the middle of the sidewall, as shown in Fig. 2(b). Measured hardness values, shown in Fig. 2(g), ranged from ∼1.0 to ∼1.6 GPa. First, all measured hardness values are higher than that of the as-annealed Cu specimen, measured at 0.69 GPa. Second, measured hardness increases from location A to location B, then decreases from location B to location D. Data shown in Fig. 2(g) corroborate the EBSD data shown in Figs. 2(c)–2(f), which indicate that the highest amount of plastic straining occurs approximately half way along the extruded cup sidewall. A higher degree of plastic straining at location B results in a higher amount of strain hardening, thus leading to higher hardness values being measured at location B.
EBSD orientation maps of as-annealed and extruded Cu specimens: (a) a typical as-annealed Cu specimen; (b) a polished longitudinal cross-sectional surface on which orientation maps were obtained at different locations; (c)–(f) show, respectively, orientation maps at locations A, B, C, and D marked in (b); (g) measured hardness values along the extruded cup sidewall, from location A to D shown in (b).
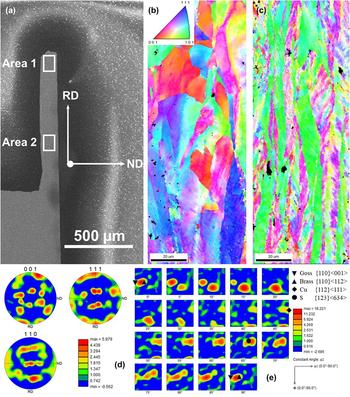
Grain morphology change and texture development due to severe plastic deformation associated with the reverse extrusion process are illustrated in Fig. 3. Figure 3(a) shows a longitudinal cross-sectional SEM image of a cup-shaped Cu specimen, extruded with a punch of 2.8 mm diameter with a sidewall thickness of ∼100 µm. Figures 3(b) and 3(c) show EBSD orientation maps obtained from locations marked area 1 and area 2 in Fig. 3(a), respectively. The approximately 50 × 150 µm areas probed by EBSD were in the middle of the extruded cup sidewall. As stated in the experimental procedures section and shown in Fig. S3(b) in the Supplementary Material, prior to EBSD data processing, the RD was set to be parallel to the extrusion direction and ND to be perpendicular to the normal of the extruded cup sidewall, pointing to the cup outside. The ND and RD for processing of the EBSD data are shown in Fig. 3(a). This is done in analogy to the conventional sheet metal rolling process, where ND is set along the direction of sheet metal compression.Reference Groover14 Cu grains at the top of Fig. 3(b), at locations closest to the original specimen surface, still exhibit similarities to the equiaxed morphology found within as-annealed specimens. Cu grains at the bottom of Fig. 3(b), ∼80 µm into the original specimen surface, are already elongated. Figure 3(c) shows that in area 2 close to the middle of the cup sidewall, all Cu grains are elongated, forming fibrous structures. Figure 3(d) shows (001), (110), and (111) PFs from EBSD data shown in Fig. 3(c). Figure 3(e) shows the corresponding ODF. Examination of the data shown in Fig. 3(e) indicates the presence of strong copper ({112} $\left\langle {11\bar{1}} \right\rangle$), brass ({110}
 $\left\langle {\bar{1}12} \right\rangle$), and S ({123}
 $\left\langle {63\bar{4}} \right\rangle$) texture components and a weaker goss ({110}〈001〉) component. In the present axisymmetric reverse extrusion experiments, the characteristic dimension for the plastic deformation is defined by the thickness of the extruded cup sidewall. At the characteristic dimension of deformation of ∼100 µm, the deformation texture components observed in Fig. 3(e) are coincident with those observed in macroscale sheet metal rolling, i.e., copper, brass, S, and goss.Reference Kocks, Tome and Wenk15
EBSD examination of the grain deformation and texture development due to reverse extrusion: (a) a longitudinal cross-sectional SEM image of an extruded cup sidewall with a thickness of ∼100 µm; (b) an orientation map obtained from area 1 marked in (a); (c) an orientation map obtained from area 2 marked in (a); (d) (001), (110), and (111) PFs obtained from EBSD data collected from area 2 in (a); (e) the corresponding ODF. The locations of copper, brass, S, and goss components in the Euler angle space are identified by symbols.

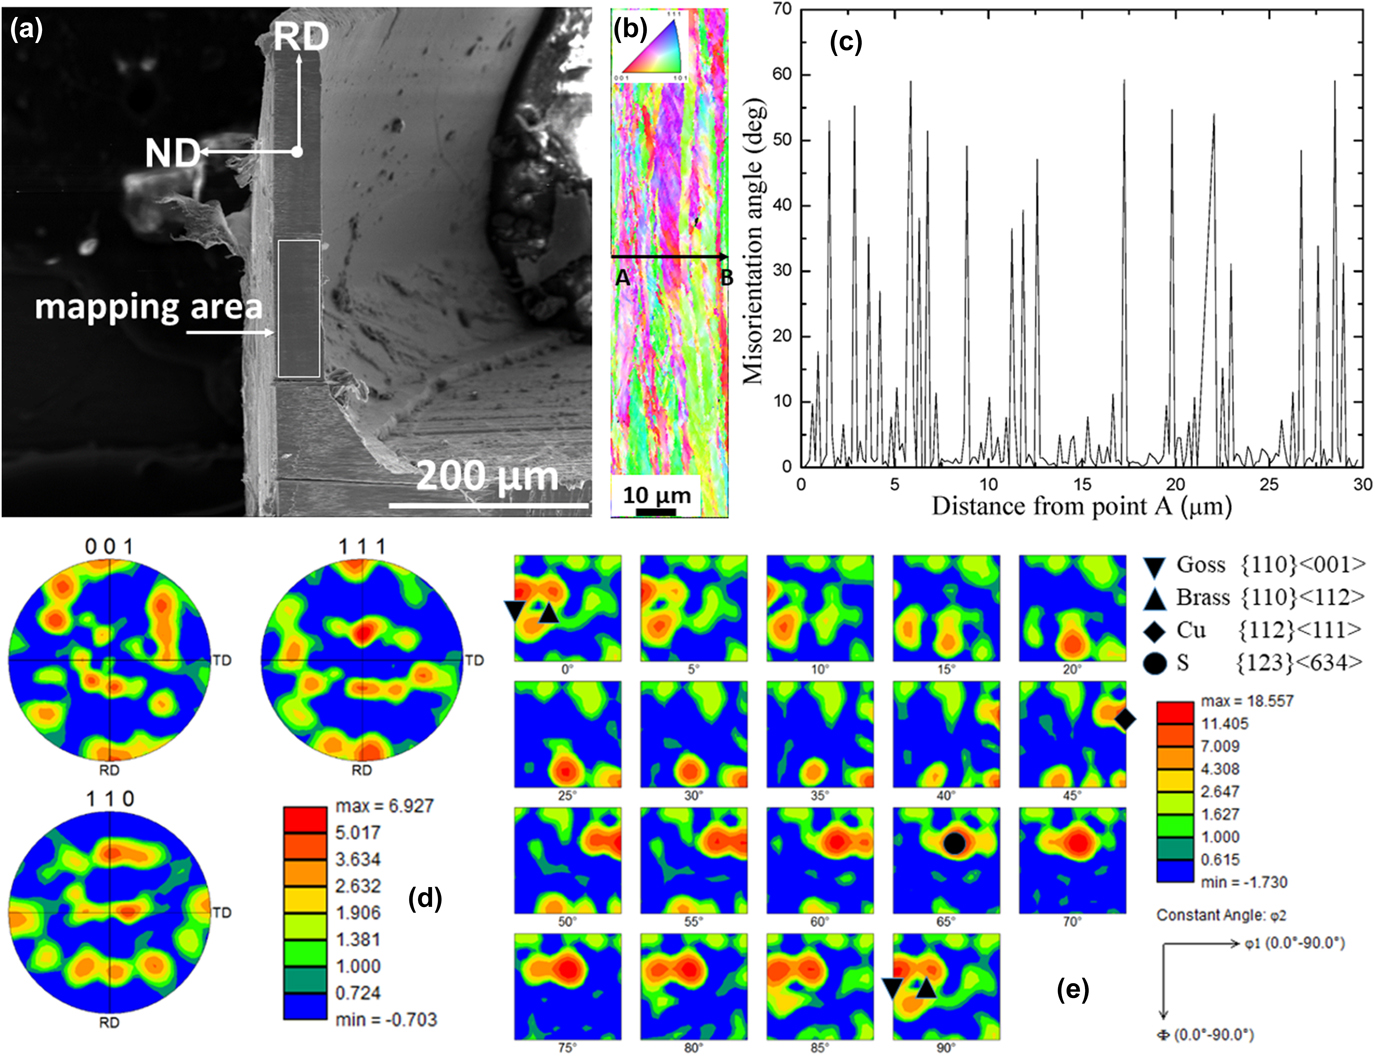
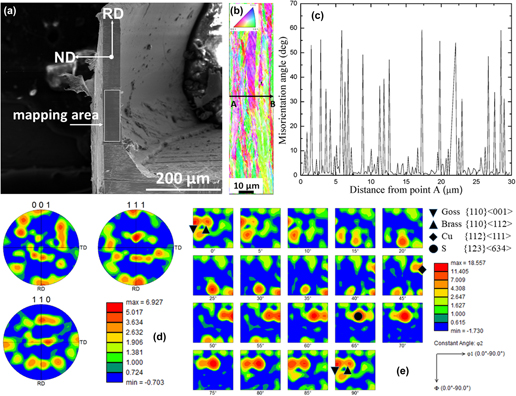
Further illustrations of grain deformation and texture development associated with the reverse extrusion process are shown in Fig. 4. Figure 4(a) shows a longitudinal cross-sectional SEM image of a section of the sidewall of a cup extruded using a 2.95 mm diameter punch. The nominal sidewall thickness is ∼25 µm, and the actual sidewall thickness is measured to be ∼30 µm. After mechanical polishing, a portion of the sidewall, outlined with the white rectangular box, was polished with Ga+ focused ion beam. In this case, the FIB polishing extended through the entire sidewall thickness. The EBSD orientation map of the FIB-polished rectangular area is shown in Fig. 4(b). Visual inspection suggests again that the grain width is smaller when the grains are near the external and internal sidewall surfaces and larger when the grains are in the center of the cup sidewall. To quantify this observation, Fig. 4(c) plots the point-to-point misorientation angle obtained from the data shown in Fig. 4(b), along the path outlined by the black arrow from point A to point B. Taking the existence of a grain boundary between two consecutive points probed as being indicated by a misorientation angle in excess of 15°, data shown in Fig. 4(c) show that the grain widths along the path from A to B range from ∼0.5 to 5 µm, and that grains with widths closer to 0.5 µm are predominantly located near the external sidewall surface in contact with the die and the internal sidewall surface in contact with the punch. Recognizing that as-annealed Cu 110 starting specimens contain largely equiaxed grains with a relatively uniform size of ∼25 µm, the width of each grain within the extruded cup sidewall can be taken as an indication of the amount of plastic straining undergone by that grain. Thus data shown in Figs. 4(b) and 4(c) again indicate the existence of differential straining in the extruded cup sidewall. Grains closer to the contacting sidewall surfaces appear to go through a higher amount of plastic straining, while the plastic strain of grains at the center of the cup sidewall appears to be less. Repeated experiments yielded similar observations. The texture developed due to the reverse extrusion process is evidenced by the (001), (110), and (111) PFs and the corresponding ODF, obtained from EBSD data shown in Fig. 4(b) and shown respectively in Figs. 4(d) and 4(e). The PFs and the corresponding ODF show the presence of copper ({112} $\left\langle {11\bar{1}} \right\rangle$) and S ({123}
 $\left\langle {63\bar{4}} \right\rangle$) texture components, together with intensities close to, but not at the exact, brass ({110}
 $\left\langle {\bar{1}12} \right\rangle$) and goss ({110}〈001〉) component locations in the Euler angle space. At the characteristic dimension for plastic deformation of ∼25 µm, the observed deformation texture components continue to correspond to those observed in macroscale sheet metal rolling, i.e., copper, brass, S, and goss. Development of the same Cu texture components in axisymmetric reverse extrusion at characteristic dimensions of ∼100 and ∼25 µm suggests that the deformation mechanisms operating in macroscopic sheet metal rolling continue to operate in plastic deformation associated with reverse extrusion at the smaller characteristic dimensions of the present experiments. The comparison between data shown in Figs. 3(e) and 4(e) shows that the intensity of deformation texture may change as the extruded cup sidewall thickness decreases from ∼100 to ∼25 µm. The information on texture development due to large strain plastic deformation associated with small scale axisymmetric reverse extrusion may also be useful for informing size-dependent crystal plasticity models.Reference Lyu, Taheri-Nassaj and Zbib16
EBSD examination of the grain deformation and texture development due to reverse extrusion: (a) a longitudinal cross-sectional SEM image of an extruded cup sidewall with a thickness of ∼25 µm. The entire EBSD mapping area is outlined with the white rectangular box; (b) the EBSD orientation map of the rectangular mapping area shown in (a). The black arrow shows the location and direction for the misorientation angle measurement shown in (c); (c) a plot of the point-to-point misorientation angle along the path outlined by the black arrow in (b); (d) (001), (110), and (111) PFs obtained from EBSD data shown in (b); (e) the corresponding ODF. Locations of the copper, S, brass, and goss components in the Euler angle space are identified by symbols.

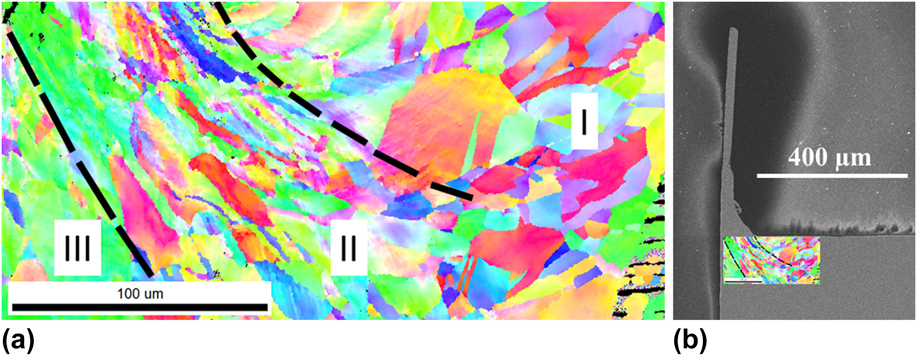
The change in grain morphology in extruded, cup shaped Cu specimens offers additional clues to the process of plastic deformation associated with the reverse extrusion geometry. Figure 5(a) shows a longitudinal cross-sectional EBSD orientation map of one extruded Cu cup, in a region immediately underneath a punch of 2.95 mm diameter and close to one punch corner. The area mapped by EBSD is fitted into the associated SEM image shown in Fig. 5(b) at the right scale and location. Three distinct regions can be identified from the grain morphologies. Region I immediately underneath the punch shows grain morphologies similar to those observed in as-annealed specimens, largely retaining the initial equiaxed grain structure. This indicates that minimal plastic strains are associated with grains in region I. Grains within region II show pronounced elongation along directions consistent with expected materials flow, indicating severe plastic straining. The amount of elongation of grains within region III, next to region II and further away from the sinking punch, appears to be smaller again, indicating reduced amounts of plastic straining of grains in this region. Such observations on grain morphology suggest that plastic deformation associated with the present reverse extrusion geometry has qualitative similarities to indentation of an elastoplastic half space by a flat-ended rectangular strip punch. In that instance, continuum plasticity FEA modeling showed the presence of an “elastic enclave” underneath the punch center, limiting plastic flow to regions around the punch corners.Reference Jiang, Sinclair and Meng17 The present grain morphology observations, especially in region I, are qualitatively consistent with the existence of a similar elastic enclave in the reverse extrusion geometry. The black dashed lines shown in Figs. 5(a) and 5(b) serve as an approximate delineation for the boundaries between regions I, II, and III with different degrees of plastic deformation. As shown in Fig. 5(b), region II delineated between the two black dashed lines undergoes the highest degree of plastic deformation and supplies the majority of Cu material making up the extruded cup sidewall.
EBSD examination of grain deformation underneath the punch: (a) a longitudinal cross-sectional EBSD orientation map of the region immediately underneath the punch. The black dashed line is a guide to the eye for delineating the boundaries between Cu regions with different degrees of deformation; (b) the longitudinal cross-sectional SEM image of the specimen from which the EBSD orientation map of (a) is taken, together with the orientation map (to scale and at location).

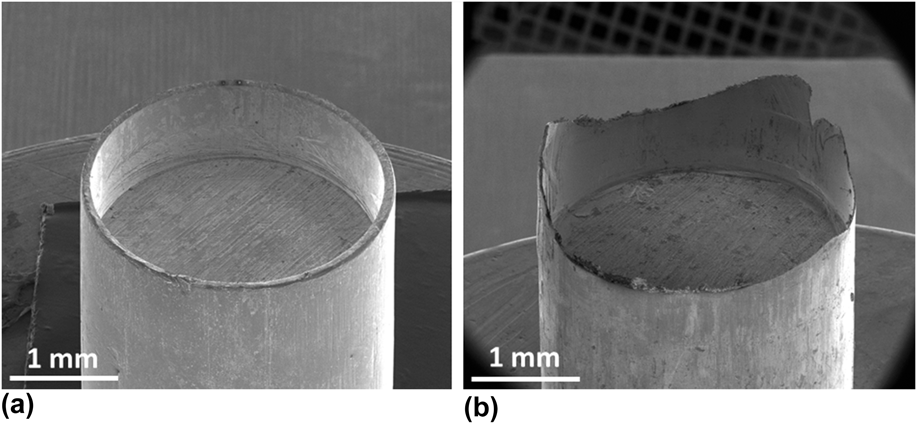
Figure 6 shows typical overall morphologies of Cu cups obtained from reverse extrusion. The change in the overall cup morphology illustrates the transition from homogeneous to inhomogeneous plastic deformation as the characteristic dimension for deformation; in this case, the thickness of the extruded cup sidewall decreases. Figure 6(a) shows that at a sidewall thickness of ∼100 µm, the sidewall height is relatively uniform around the cup perimeter and the extruded structure appears to be axisymmetric. By contrast, at a sidewall thickness of ∼25 µm, Fig. 6(b) shows significant differences in sidewall height around the cup perimeter. Repeated experiments showed similar extruded cup morphologies with nonuniform sidewall heights, indicating that the inhomogeneous plastic deformation at a sidewall thickness of ∼25 µm is not particular to one specific initial Cu rod specimen.
SEM images of extruded cup-shaped Cu specimens obtained at a 45 tilt angle: a typical image of extruded cup with sidewall thickness of (a) ∼100 µm; (b) ∼25 µm.

In conventional deep drawing of sheet metals, deformation inhomogeneity, manifested in the so-called earring formation, is related to macroscale mechanical anisotropy of the starting sheet metal due to its prior processing.Reference Hu, Liu and Wang18,Reference Yoon, Dick and Barlat19 For the present experiments, PFs obtained from EBSD data of as-annealed Cu rod specimens, e.g., data shown in Fig. 2(a), indicated that Cu grains within the starting Cu 110 rod specimens retained little anisotropy after the 600 °C initial annealing. As the current reverse extrusion experiments were conducted without application of any lubricant, the contact surface conditions also remained unchanged for both the 100 and 25 µm cases. Friction is therefore believed not to be the main factor responsible for the observed change from homogeneous to inhomogeneous deformation as the extruded cup sidewall thickness decreases from ∼100 to ∼25 µm. Rather, the observed difference in sidewall height around the cup perimeter, shown in Fig. 6(b), is suggested to be a result of the difference in deformation of different Cu grains around the extruded cup sidewall, which are different in size and orientation. Data shown in Fig. 6 suggest that such an inhomogeneous deformation behavior becomes apparent when the total number of grains participating in the plastic deformation, i.e., the number of grains across the sidewall thickness, becomes small, ∼20 according to data shown in Fig. 4. The transition from homogeneous to inhomogeneous plastic deformation associated with grain size change in small-scale metal forming has been observed previouslyReference Krishnan, Cao and Dohda20 and needs to be better understood and controlled to achieve satisfactory final formed shapes at such small scales.
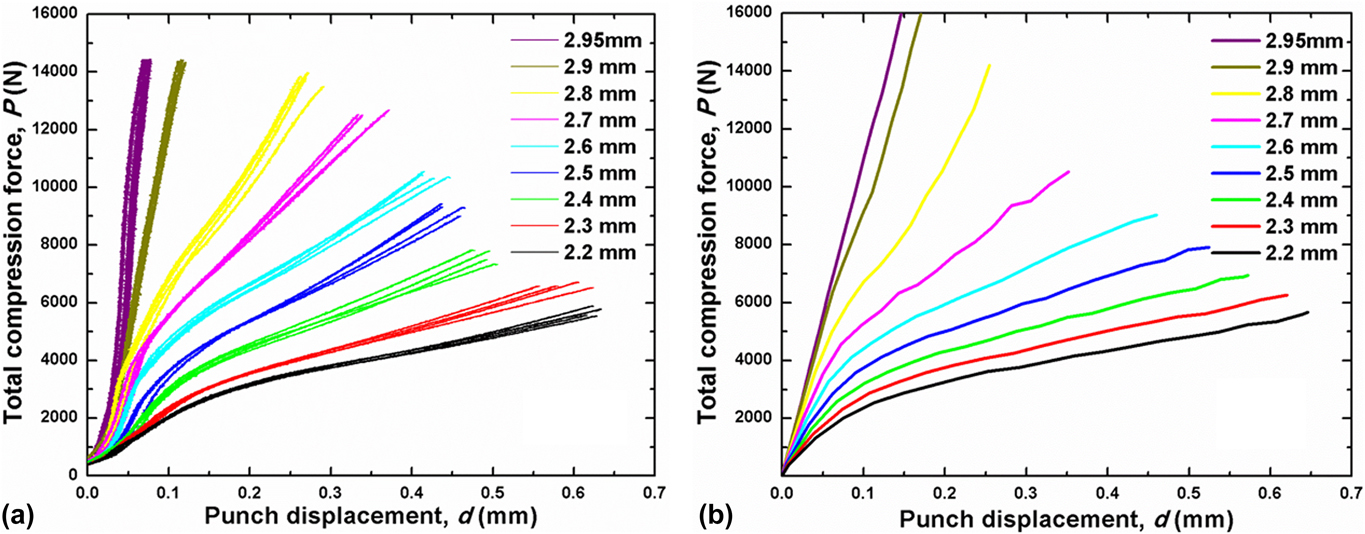
The average mechanical response of axisymmetric reverse extrusion was measured through the force–displacement curves. Raw total compression force P versus the total actuator displacement Δ curves were obtained at punch diameters from 2.20 to 2.95 mm. Raw P–Δ curves were converted into the actual mechanical response associated with the axisymmetric reverse extrusion, i.e., P versus actual punch displacement into the top specimen surface, d, by removing the system compliance contribution and correcting for misfits between the initial Cu rod specimen and the die hole. Detailed procedures for this data conversion are provided in section S6 of the Supplementary Material. Figure 7(a) shows a collection of processed P–d curves. A number of repeated measurements were conducted at each punch diameter, and it is apparent that reasonable agreements exist between repeated measurements. As the punch diameter increases from 2.20 to 2.95 mm and the nominal extruded cup sidewall thickness decreases from ∼400 to ∼25 µm, the P–d curves exhibit systematic variations. All the response curves are qualitatively similar, exhibiting an initially stiffer section, where P increases more rapidly with increasing d, followed by a “knee” after which P increases more slowly with d in an approximately linear fashion. As the punch diameter increases from 2.20 to 2.95 mm, the P–d curves show obvious and systematic stiffening, i.e., P increases significantly at the same d value as D increases.
Measured and simulated mechanical response of axisymmetric reverse extrusion: (a) a set of experimental P–d curves obtained with punches of varying diameters; (b) a set of FEA output P–d curves obtained with punches of varying diameters and a constant friction coefficient of 0.02.

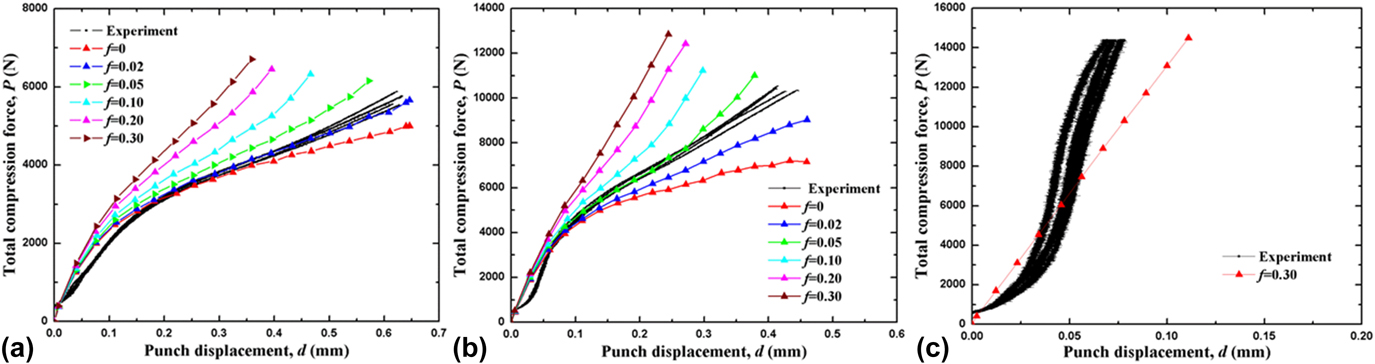
To illustrate the comparison between experimentally measured extrusion response and the corresponding continuum plasticity FEA simulations, Fig. 8(a) replots the experimental P–d curves for the case of the 2.20-mm-diameter punch together with various FEA output curves assuming different values of the friction coefficient f. The FEA outputs included cases with f ranging from 0 to 0.3. f values higher than 0.3, e.g., f = 0.5, caused the simulation to stop without progressing to larger d values. It is apparent from Fig. 8(a) that the FEA output curves exhibit the same trend as that observed in the experiments, in all cases exhibiting (i) an initially stiffer section and (ii) a “knee” followed by a less stiff section, with P still increasing with increasing d. The slope of the portion of the simulated curve after the knee increases with increasing value of f. The FEA output with f = 0.02 fits best with the experimental P–d curves. Figures 8(b) and 8(c) show, respectively, the same experiment–FEA comparison plots for the cases of the 2.60 and 2.95 mm diameter punches. For D = 2.60 mm, the FEA output curves exhibit similar trends as shown in Fig. 8(a). However, the best fit with the experimental P–d curves is the FEA output with f = 0.05 instead of 0.02. For D = 2.95 mm, only the FEA output curve corresponding to f = 0.3 is shown in Fig. 8(c) and is seen to lie significantly below the experimental P–d curves. For punch diameters less than 2.6 mm, the FEA outputs based on f ranging from 0.02 to 0.05 are in reasonable agreement with the experimental P–d curves.
Comparing FEA output with experimental reverse extrusion response curves: experimental P–d curves plotted together with FEA output with different values of friction coefficient for the case of (a) 2.20 mm diameter punch; (b) 2.60 mm diameter punch; (c) 2.95 mm diameter punch.

It is of interest to note that the FEA output curves corresponding to f = 0 exhibit a positive slope after the knee, see for example, the f = 0 curves displayed in Figs. 8(a) and 8(b) for the cases of the 2.20 and 2.60 mm diameter punches. Stated differently, the FEA simulations show that the extrusion forces continue to increase way past the “knee” points on the force–displacement curves even in cases of zero friction. Again referencing the situation of indentation of an elastoplastic half space by a flat-ended rectangular strip punch, the existence of the “knee” point on the force–displacement curve in that instance signals the formation of a self-similar plastic zone underneath the strip punch. As the punch displacement d increases past the knee point, this self-similar plastic zone would travel with the strip punch into the indented material in a steady-state fashion.Reference Jiang, Sinclair and Meng17 Data shown in Fig. 5, indicating the existence of an elastic enclave underneath the reverse extrusion punch, also suggest the existence of a self-similar plastic zone underneath the reverse extrusion punch in the present experiments. Assuming the existence of such a steady-state plastic zone underneath the reverse extrusion punch, the contribution to the total extrusion force from reaction forces at the plastic zone boundaries underneath the punch is expected to be a constant, in keeping with the steady-state assumption. However, the present experimental results suggest that the Cu grains going along the extruded cup sidewalls may not have reached steady state. For example, the Cu grain morphologies shown in Fig. 2 suggest that the plastic strain increases from point D to point B along the cup sidewall shown in Fig. 2(b), with corroboration from the site-selective indentation data shown in Fig. 2(g). Recognizing that the Cu material exhibits significant strain hardening, it can be argued that the contribution to the total extrusion force from plastic flow of the materials along the extruded cup sidewall would keep increasing as long as a portion of the sidewall materials are being increasingly strained plastically. With nonzero friction, the FEA outputs shown in Fig. 8 exhibit increasing slope of the P–d curve past the knee point with increasing f value, consistent with the expectation that sidewall friction would further contribute to the total extrusion force. Whether and when the materials making up the extruded cup sidewall will reach steady state are of interest and remain to be answered through future studies.
The present axisymmetric reverse extrusion experiments do not provide all necessary input parameters to the continuum plasticity FEA. In one extrusion geometry, although an average extrusion pressure is given by P/(πD 2/4) and known from experimentation, actual contact pressures at the surfaces of the punch and the die hole could not be obtained from the present experimental setup. Furthermore, the experiment did not determine the actual friction coefficient f, and whether it varied with location along the extruded cup sidewall or as the sidewall thickness of the extruded cup decreased. Given these considerations, Fig. 7(b) shows a collection of simulated P–d curves from the continuum plasticity FEA model, assuming a constant f value of 0.02 independent of punch diameter. As shown in Fig. 8(a), the choice of f = 0.02 was based on the best fit between the experimental P–d curves and the FEA output in the case of D = 2.20 mm. In the absence of further information, the assumption of a constant friction coefficient was made. Qualitatively, it is apparent that the FEA output exhibits the same trend as that observed in the reverse extrusion experiments, in all cases exhibiting (i) an initially stiffer section and (ii) a “knee” followed by a less stiff and approximately linearly increasing section. Quantitatively, Fig. 8(c) indicates that the experimental P–d curves lie significantly above the FEA outputs, and agreement between experimental P–d curves and FEA outputs cannot be obtained as the extruded cup sidewall thickness decreases to ∼25 µm, even with a 15-fold increase in f value from 0.02 to 0.30.
Besides friction considerations, the existence of inhomogeneous plastic strain within the extruded cup sidewall, as suggested by the grain morphology observations shown in Figs. 2 and 4, implies the existence of plastic strain gradients across the sidewall thickness and potential strain gradient hardening of the Cu being extruded.Reference Evans and Hutchinson21,Reference Abu Al-Rub and Voyiadjis22 This implies a potential change in the actual σ–ε relationship for the reverse extrusion from that obtained from the uniaxial compression experiment shown in Fig. S2(b). Such a change would also run contrary to the assumed constant σ–ε relationship in the entire collection of FEA simulations and contribute to further discrepancies between FEA outputs and experimental measurements. The extent of strain gradient contribution to the total extrusion force remains to be determined through future studies. Lastly, the continuum plasticity FEA does not take the influence of crystal texture on material flow behavior into account. While the present comparison between experimental P–d measurements and continuum plasticity FEA outputs serves to establish a baseline for further experiment–model comparisons, better agreement may be expected by incorporating crystal texture and strain gradient effects into future modeling efforts.
V. SUMMARY
Cup-shaped Cu structures were formed by axisymmetric reverse extrusion, with cup wall thicknesses ranging from ∼400 µm down to ∼25 µm. The severe plastic deformation associated with the reverse extrusion process led to significant changes in Cu grain morphology, size, and texture along sidewalls of extruded cups. As the characteristic dimension for the present reverse extrusion experiments decreased from ∼400 to ∼25 µm, PF and ODF analysis of EBSD data obtained from extruded Cu cup structures showed the presence of copper, S, brass, and goss texture components, the same as those observed during macroscale sheet metal rolling. This suggests that the deformation mechanisms operating in macroscale rolling deformation continue to operate in reverse extrusion down to a characteristic dimension of ∼25 µm. The observation of Cu grain morphology at different locations along the extruded cup sidewall indicates that the amount of plastic strain is the highest in the middle of the sidewall and decreases toward the cup rim and the base. This observation is corroborated by site-specific nanoindentation hardness measurements. Grain morphology observations further suggest the presence of plastic strain gradients across the thickness of extruded cup sidewalls. Extrusion force–punch displacement curves were measured as a function of extruded cup sidewall thickness and compared to outputs of a continuum plasticity FEA in corresponding geometries. While the FEA model generates P–d curves qualitatively similar to those observed in experiments, the detailed comparison showed that experimentally measured extrusion force significantly exceeded the FEA prediction at the small sidewall thickness of ∼25 µm. A transition from homogeneous to inhomogeneous deformation was observed, manifested as significant differences in the sidewall height around the extruded cup perimeter, as the characteristic forming dimension decreases to ∼25 µm. The present work on small-scale axisymmetric reverse extrusion suggests that the effects of friction, crystal texture, and strain gradients should be further explored in the future to bring improved correspondence between modeling and experimentation.
Supplementary Material
To view supplementary material for this article, please visit https://doi.org/10.1557/jmr.2018.22.
ACKNOWLEDGMENTS
The authors gratefully acknowledge partial project support from the U.S. National Science Foundation (NSF OIA-1541079) and the Louisiana State Board of Regents (LEQSF(2013-16)-RD-B-01). The experimental work used facilities at the LSU shared instrumentation facility (SIF), a part of the NSF EPSCoR CIMM core user facilities (CUFs). WJM acknowledges discussions with Profs. J.W. Hutchinson and Shuai Shao with thanks.