Introduction
The human population is expected to reach 9 billion by 2050 (Li et al., Reference Li, Zhang and Huang2014) and as a result, future demands in food, feed, fiber and fuel will increase (Rahaman et al., Reference Rahaman, Chen, Gillani, Klukas and Chen2015). Furthermore, studies have shown that climate change strongly affects agriculture by increasing uncertainty in yield and the quality of many crops (Kang et al., Reference Kang, Khan and Ma2009; Yohannes, Reference Yohannes2016). Due to the aforementioned problems, research in plant breeding science has moved to the development of improved crop varieties and hybrids that can achieve higher yields in various climatic conditions to meet future demands (Edgerton, Reference Edgerton2009).
However, plant breeding is not an easy task. Currently, plant breeding demands a long time to develop new varieties; only a few of which are adopted and used by farmers. High-throughput phenotyping (HTTP) was introduced to solve such problems. This approach utilizes modern technology to detect crop traits like drought tolerance during crop development using proximal sensing methods and thus fully exploits advances in genome technology for plant breeding (Araus and Cairns, Reference Araus and Cairns2014).
Several researchers have already studied and worked on different sensors, platforms and approaches for HTTP (White et al., Reference White, Andrade-Sanchez, Gore, Bronson, Coffelt, Conley, Feldmann, French, Heun, Hunsaker, Jenks, Kimball, Roth, Strand, Thorp, Wall and Wang2012). Andrade-Sanchez et al. (Reference Andrade-Sanchez, Gore, Heun, Thorp, Carmo-Silva, French, Salvucci and White2014) used a proximal canopy sensor, a sonar proximity sensor and an infrared radiometer sensor to assess crop traits in 25 cotton varieties. Rosell et al. (Reference Rosell, Llorens, Sanz, Arno, Ribes-Dasi, Masip, Escola, Camp, Solanelles, Gracia, Gil, Val, Planas and Palacin2009) used a laser scanner for recording three-dimensional models of fruit trees such as pear, apple, orange and others, in order to calculate crop parameters such as crop height, volume, thickness and leaf area index (LAI). The three-dimensional models presented high correlation (r2=0.98) with the measured traits. Paulus et al. (Reference Paulus, Behmann, Mahlein, Plumer and Kuhlmann2014) used a 3D scanner to depict three-dimensional plants and barley organs. Thereby, they measured the leaf area, stem height, and thickness of the plant. Hosoi and Omasa (Reference Hosoi and Omasa2009) successfully calculated the density of wheat plants at different growth stages using a 3D laser scanner. However, most of these sensors are considered to be an expensive solution for both research and commercial applications in terms of equipment and required knowledge.
On the contrary, RGB cameras are an alternative of low cost and high operational familiarity even for non-specialized people. Previous studies on the phenotype of soybean varieties through digital image analysis and calculation of spectral vegetation indices based on the visible spectrum showed a significant correlation of red, green and blue bands with protein content at harvest (Vollmann et al., Reference Vollmann, Walter, Sato and Schweiger2011). Wang and Li (Reference Wang and Li2014) used the Kinect sensor to measure the diameter of two varieties of onions and also found some strong correlations. Most of these image-based phenotyping methods have been performed indoors or in greenhouses, while the majority of crops are grown outdoors (Kelly et al., Reference Kelly, Vatsa, Mayham, Ngô, Thompson and Kazic2016). Therefore, the aim of this study was to assess the use of an RGB camera in situ as a cheap alternative method for estimating crop growth parameters of vetch and faba bean crops.
Materials and methods
The study was conducted at the Agricultural University of Athens experimental field (37° 59’N, 23° 42’E) in the 2014-2015 crop season. The crop cultivated before the legumes was sunflower (Helianthus annuus L.). Two different legume species, vetch (Vicia sativa L. subsp. sativa cv. Alexandros) and faba bean (Vicia faba L. var. faba cv. Polykarpe) were used in this study. Both were grown as forage crops (biomass production for animal feed). The experiments were conducted in a randomized complete block design with a split-plot arrangement and four replicates for each treatment (weed presence x crop). The crop was the main plot and weed presence (or absence) the sub-plot. Experimental sub-plots were 1 mx2.4 m. Cultivator operations were performed for seedbed preparation before sowing. Sowing took place on 26 November 2014. All weeds were removed by hand-hoeing in the weed-free subplots.
A proximal canopy sensor and a simple commercial camera were used for estimating crop development through the use of spectral vegetation indices (SVIs). The proximal canopy sensor RapidSCAN CS-45 (Holland Scientific, Lincoln, USA), has the ability to assess crop vigor through vegetation indices. Specifically, it measures the Normalized Difference Vegetation Index (NDVI), and the normalized difference red edge Index (NDRE). The NDVI (Eq. 1) indicates green vegetation and is based on the difference between the maximum absorption of radiation in the red spectral band and the maximum reflection of radiation in the near infrared spectral band. The NDVI values range between −1 and +1, with the soil and vegetation values being positive. More dense and healthy vegetation presents higher NDVI values.
 $$NDVI={{NIR\,{\minus}\,RED} \over {NIR{\plus}RED}}$$
 $$NDRE={{NIR\,{\minus}\,RE} \over {NIR{\plus}RE}}$$
 $$NGRDI={{GREEN\,{\minus}\,RED} \over {GREEN{\plus}RED}}$$
Where, NDVI: Normalized Difference Vegetation Index; NDRE: Normalized Difference Red Edge Index; NGRDI: Normalized Green-Red Difference Index; NIR: Near Infrared Band; RED: Red Band; RE: Red Edge Band; GREEN: Green Band.
The NDRE (Eq. 2) is a similar vegetation index to the NDVI but it uses the red edge band instead of the red band of the electromagnetic spectrum. The red edge band was found to present higher sensitivity compared to red band for assessing crop parameters. NDRE values also range from −1 to +1, but in absolute form the values giving this index is lower than the NDVI. The actual range of NDRE in vegetation studies is usually from −0.1 to 0.3.
A commercial RGB camera Coolpix S600 (Nikon, Tokyo, Japan) resolution 10 Megapixel, was used for taking pictures of the legumes. A white reference surface was used to calibrate the RGB camera each time. The images where then processed and analyzed in the Image J software (National Institute of Health, USA) for producing the Normalized Green-Red Difference Index (NGRDI) (Eq. 3). NGRDI is calculated using only the bands in the visible region of the electromagnetic spectrum (red and green bands). This index values range from −1 to +1 with values between 0.2 and 0.35 indicate dense and / or healthy vegetation.
For each crop, seven measurements were conducted using the above mentioned equipment. Measurements were taken on 30, 70, 86, 103, 126, 146, 165 days after sowing (DAS) for vetch and 40, 65, 83, 105, 125, 170 DAS for faba bean. Agronomic parameters were taken on the same dates and included crop height, number of leaves and fresh weight (biomass) in order to monitor crop growth. Statistical analysis included correlation matrices and descriptive statistics for all measurements of both plant species using SPSS 20 (IBM Corp., New York, USA).
Results and Discussion
Vetch
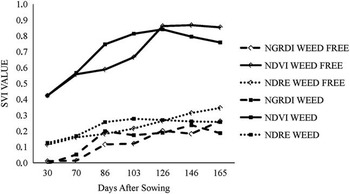
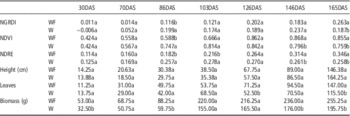
Significant differences of all three spectral vegetation indices (NGRDI, NDVI and NDRE) arise from 86 DAS (Table 1 and Figure 1). This was probably due to the background influence of soil in the calculation of SVIs after weed removal (Huete, Reference Huete1988). However, NDVI and NDRE of weed free vetch presented significantly higher values compared with the weedy plots at 146 and 165 DAS, while the NGRDI presented the same pattern only at 165 DAS. Additionally, the weed free vetch presented the higher SVIs values suggesting that crop vigor was higher due to lack of weed competition. Regarding the crop traits, there were some significant differences throughout the period, especially for the number of leaves and crop biomass. It is also noticeable that, finally, vetch biomass of the weed free plots was 23% higher than the one in weedy plots. This finding is in full accordance with previous studies indicating that weeds may significantly reduce forage yield in some legume crops by competing for water, sunlight, and nutrients (Travlos, Reference Travlos2010).
Time course of spectral vegetation indices in weed free and weedy vetch crop.

Mean values of the measured parameters for weed free (WF) and weedy (W) vetch crop

a-bMeans followed by different letters in the same column and parameter are significantly different (p<0.05)
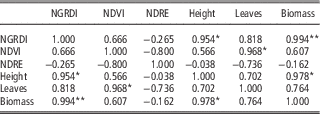
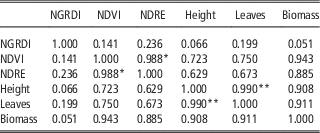
Pearson’s correlation matrix showed significant correlations between NDVI and NDRE with NGRDI (r=0.880 and r=0.988, p<0.01 respectively) at 86 DAS in vetch. However, SVIs showed correlations of variable significance with agronomic traits, depending on weed presence. In particular, NGRDI at 126 DAS was highly correlated with height and biomass for weedy vetch (r=0.954 and r=0.994 respectively), while there were not any significant correlations in the weed free situation (Tables 2 and 3). Similarly, NDVI presented correlation with the number of leaves at 126 DAS (r=0.968) in weedy vetch while there was not any significant correlation in weed free vetch (Tables 2 and 3). The RGB camera could be used for phenotyping as a cheap alternative in vetch studies compared with the expensive sensors that are currently used, especially in order to make some prediction on the anticipated biomass under weed competition. This finding could be very important in studies evaluating the weed competitiveness of a range of crop varieties, which is an important criterion for their selection (Travlos et al., Reference Travlos, Economou and Kanatas2011).
Pearson’s correlation matrix for vetch crop with the presence of weeds at 126 DAS

* Correlation is significant at the 0.05 level (2-tailed).
** Correlation is significant at the 0.01 level (2-tailed).
Pearson’s correlation matrix for weed free vetch crop at 126 DAS

* Correlation is significant at the 0.05 level (2-tailed).
** Correlation is significant at the 0.01 level (2-tailed).
Faba bean
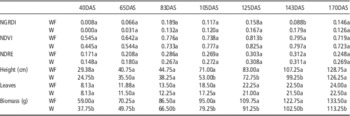
SVIs in faba bean did not show any significant difference between weed free and weedy plots except of NGRDI at 143 DAS. This was probably due to the growth type of faba bean, which is erect and consequently shows a high competitive ability against weeds. Indeed, our results on faba bean (final biomass differences between weedy and weed free plots were about 15%) highlight the fact that faba bean has a higher competitive ability against weeds than vetch (Table 4). This could be attributable both to more vigorous early growth and to the plant’s erect growth type, both factors related to a greater shading ability and, consequently, to a better ability to suppress weeds as previously indicated by Frenda et al. (Reference Frenda, Ruisi, Saia, Frangipane, Di Miceli, Amato and Giambalvo2013).
Mean values of the measured parameters for weed free (WF) and weedy (W) faba bean crop

a-bMeans followed by different letters in the same column and parameter are significantly different (p<0.05)
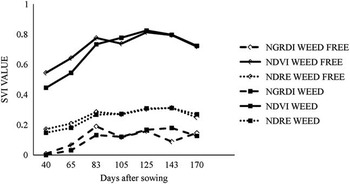
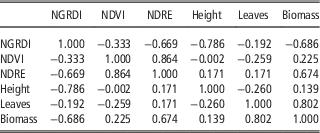
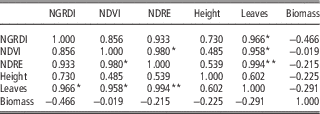
The time course of the several indices is shown in Figure 2. There was not any correlation between NGRDI and the other two indices (NDVI and NDRE) in faba bean during all the measurements (Tables 5 and 6). This indicates that the NGRDI could not adequately substitute NDVI and NDRE in faba bean studies. Moreover, SVIs presented different levels of correlation between weed free and weedy faba bean for the measured crop parameters. Particularly, SVIs did not correlate with any crop parameter at 83 DAS for weedy plots while all SVIs were highly correlated with the number of leaves in the weed free situation. The erect growth type of faba bean along with the big and distinct leaves could be an explanation for the observed correlations and differences. Therefore, for the faba bean crop, an RGB camera could potentially be used as a cheap alternative to sensors, but only for specific characteristics.
Time course of spectral vegetation indices in weed free and weedy faba bean crop.

Pearson’s correlation matrix for a faba bean crop with presence of weeds at 83 DAS

Pearson’s correlation matrix for a weed free faba bean crop at 83 DAS

* Correlation is significant at the 0.05 level (2-tailed).
** Correlation is significant at the 0.01 level (2-tailed).
Conclusions
Plant phenotyping is not a new research for recording quantitative and qualitative plant traits. Nevertheless, obtaining phenotypic information is of crucial importance in order to study a crop’s performance, while it can also be a valuable tool for the evaluation of the weed competitiveness of a wide range of crop cultivars. Commercial RGB cameras could be used as a cheap alternative in plant phenotyping studies compared with the expensive sensors that are currently used. However, our results indicated that their efficiency is highly related to the crop growth type along with the presence of weeds or not. In addition, their efficiency varies according to the estimated crop parameter and the crop stage that the measurement is taken. Therefore, RGB cameras could be for some species and at some stages a helpful tool for prediction of crop performance, especially for the evaluation of several cultivars belonging to the same crop. Further studies are certainly needed to evaluate in depth the use of this type of sensors in plant breeding studies regarding not only the sensors but also the calculated spectral vegetation indices.