INTRODUCTION
Currently, rainfall in the UK is evenly distributed throughout the year, but waterlogging is more likely to occur in the winter months due to lower transpiration and evaporation rates (Smith & Trafford Reference Smith and Trafford1976; Vartapetian & Jackson Reference Vartapetian and Jackson1997). Climate change models predict an increase in the amount and intensity of winter rainfall in the UK (Dai et al. Reference Dai, Trenberth and Karl1998; Hulme et al. Reference Hulme, Jenkins, Lu, Turnpenny, Mitchell, Jones, Murphy, Hassell, Boorman, Mcdonald and Hills2002; Ekstrom et al. Reference Ekstrom, Fowler, Kilsby and Jones2005), resulting in an increased threat of winter waterlogging affecting crop production (MAFF 2000; BBSRC 2004). Over the last two centuries, much of the arable land in the UK has been drained; however, the increased rate of transit of rainfall into rivers facilitated by land drainage is a cause for concern and government policy is likely to discourage any further drainage in future (Curry Reference Curry2002).
There has been little recent research on the effects of waterlogging on the growth and yield of winter wheat in the UK, the last being conducted at the former Letcombe Laboratory in the late 1970s, using lysimeters buried in field plots (Cannell et al. Reference Cannell, Belford, Gales, Dennis and Prew1980; Belford Reference Belford1981). A comparison of the effects of waterlogging on winter wheat and winter barley (Cannell et al. Reference Cannell, Belford, Gales, Thomson and Webster1984) and winter oats (Cannell et al. Reference Cannell, Belford, Blackwell, Govi and Thomson1985) was made, but differences between cultivars of wheat were not investigated. Additionally, modern cultivars may behave differently from their predecessors, because of subsequent advances in plant breeding (Shearman et al. Reference Shearman, Sylvester-Bradley, Scott and Foulkes2005). Studies outside the UK suggest that differences in tolerance to waterlogging exist between cultivars (Huang et al. Reference Huang, Johnson and Nesmith1997; Musgrave & Ding Reference Musgrave and Ding1998; Setter et al. Reference Setter, Burgess, Waters and Kuo1999); thus, it may be possible to find diversity for tolerance amongst cultivars grown in the UK. In addition to tolerance whilst waterlogged, the ability of wheat to recover once waterlogging has ceased may be just as important (Setter & Waters Reference Setter and Waters2003). Some current wheat cultivars grown in the UK are already known to possess characteristics that may allow them to do this. For example, Deben has a high tillering potential (NIAB 2002), Hyno Esta and Hyno Quinta have high growth rates, associated with their hybrid nature (Kindred & Gooding Reference Kindred and Gooding2004), and Soissons has a fast development rate, resulting in early maturity (NIAB 2002). In contrast, a slower growth rate during periods of physiological stress has also been identified as a characteristic associated with stress tolerance in plants (Grime & Hunt Reference Grime and Hunt1972; Lambers & Poorter Reference Lambers and Poorter1992). For example, the native barley landraces of Eastern Siberia are able to survive the spring droughts characteristic of this region by slowing their development, so spike formation can occur after the stress period (Knupffer et al. Reference Knupffer, Terentyeva, Hammer, Kovaleva, Sato, von Bothmer, van Hintum, Knupffer and Sato2003).
In the present study, a wide range of commercially available cultivars was screened in the first year and then contrasting cultivars were evaluated under field conditions over two seasons. The initial screen involved two experiments; the first was conducted outdoors using plastic bins where the plants were grown to maturity, the second in polyvinyl tubes in a glasshouse to investigate the effects of waterlogging at the seedling stage. The first was designed to measure agronomic tolerance to waterlogging, that is, the ability to produce a high grain yield under waterlogged conditions (Setter & Waters Reference Setter and Waters2003). The second was designed to measure physiological tolerance to waterlogging, i.e. the ability to maintain high dry matter (DM) production relative to that of drained controls (Setter & Waters Reference Setter and Waters2003). A further objective was to investigate any correlation between responses to waterlogging at seedling growth stages and grain yield at maturity, with a view to developing a screening technique to allow early identification of tolerant cultivars in breeding programmes.
Cultivars that showed contrasting responses to waterlogging in the initial screening experiments were then evaluated under field conditions, in which waterlogging was imposed by irrigation during the winter months.
An additional tube experiment was conducted to measure root growth of different cultivars, including spring and hybrid cultivars, under waterlogged conditions. Previous research has suggested that seminal and nodal roots exhibit different responses to waterlogging (Trought & Drew Reference Trought and Drew1980; Wiedenroth & Erdmann Reference Wiedenroth and Erdmann1985; Erdmann et al. Reference Erdmann, Hoffman and Wiedenroth1986) and that some cultivars have higher tolerance to waterlogging as a result of their ability to initiate nodal roots (Huang et al. Reference Huang, Johnson, Nesmith and Bridges1994a, Reference Huang, Johnson, Nesmith and Bridgesb; Huang et al. Reference Huang, Johnson and Nesmith1997). The aim of the present experiment was to determine whether there are differences between cultivars in patterns of root initiation in response to waterlogging and whether any cultivars demonstrate evidence of aerenchyma by having roots that penetrate below the water level.
MATERIALS AND METHODS
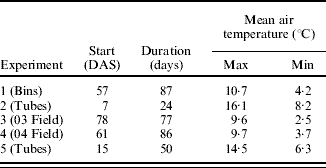
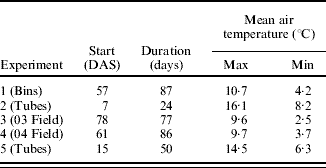
The timing of imposition of waterlogging in days after sowing (DAS), duration of waterlogging and mean air temperatures during waterlogging for all experiments is given in Table 1.
Timings in DAS, duration and mean air temperatures during the waterlogging treatments
Initial screens
Experiment 1: Grain yield and yield components of 20 winter wheat cultivars grown under waterlogged conditions
Plastic bins of 70-litre capacity, 420 mm surface diameter and 640 mm deep were filled with local topsoil (a fertile alluvial loam of the Denbigh series) and arranged into three randomized blocks within an area protected by a windbreak and bird netting. Each plot consisted of one bin sown with a single cultivar. Seeds were sown on 18 October 2001 using a template to achieve a target population of 36 plants per bin (260 seeds/m2). Two seeds were sown in each position and the seedlings later thinned to one at Zadoks GS 11 (Tottman et al. Reference Tottman, Makepeace and Broad1979). The 20 cultivars were representative of winter wheat in commercial cultivation at the time, plus two hybrid cultivars. They were Biscay, Buchan, Charger, Claire, Consort, Deben, Equinox, Hereward, Hyno Esta (hybrid), Hyno Quinta (hybrid), Madrigal, Malacca, Napier, Option, Riband, Savannah, Shamrock, Soissons, Tanker and Xi-19, each sown in three replicates. Seeds treated with bitertanol, fuberidazole and imidacloprid (Sibutol Secur, Bayer Crop Science) were supplied.
Two drainage holes were drilled in each bin, one at 100 mm below the soil surface and one 10 mm above the soil surface to prevent flooding. Waterlogging was imposed from 14 December 2001, 57 DAS, when the plants were approximately at GS 22/23, to 11 March 2002, a period of 87 days. During this time the bins were watered individually using a hose until water flowed from the lower hole, indicating that the soil water table was at 100 mm below the soil surface. At the end of the waterlogging period a hole was drilled 20 mm above the base of each bin to allow the soil to return to field capacity.
A compound fertilizer supplying 40 kg P2O5/ha and 40 kg K2O/ha was applied at sowing. Crop management operations were all performed on the same calendar date when the majority of the cultivars were at the appropriate growth stage, regardless of differences in speed of development. Weeds were controlled by hand weeding. A total of 175 kg/ha of N was applied by hand, as ammonium nitrate prills (0·345 N) in two splits. The first application of 70 kg N/ha was made on 13 March 2002 during spring tillering (c. GS 25) and the second application of 105 kg N/ha on 23 April 2002 when the plants were approaching first node stage (GS 31). Chlormequat (3C Chlormequat, BASF (UK) Ltd) was applied on 12 April 2002 at 2·2 litres/ha at the pseudostem-erect stage (GS 30). Foliar disease was controlled by applications of 0·67 g cyprodinil/ha (Unix, Syngenta plc) and 125 g epoxiconazole/ha+125 g kresoxim-methyl/ha (Landmark, BASF (UK) Ltd) at stem extension (GS 31) followed by a further 125 g epoxiconazole/ha+125 g kresoxim-methyl/ha at flag leaf emerged stage (GS 39).
Plots were harvested individually as each attained maturity. At harvest, plants were counted and cut at the soil surface. Total above-ground biomass was measured and used to calculate harvest index (HI). Mature ears were cut from the stems and counted. The grains were threshed by hand, counted and then dried for 48 h in an oven at 80°C before determining dry weight.
Experiment 2: Effects of waterlogging at the seedling stage on growth of 20 winter wheat varieties
The effects of waterlogging at the seedling growth stages of the 20 cultivars used in Expt 1 were investigated by growing plants in polyvinyl drainage tubing (32 mm diameter) cut into 250 mm lengths. The bottom of each tube was plugged with insulation fleece and filled with horticultural-grade, lime-free silica sand (particle size <1 mm). The tubes were arranged in plastic boxes, 25 in each, with sand packed between the tubes to hold them vertically, and arranged on benches in an unheated glasshouse, with no supplementary lighting. The base of each box was first filled with horticultural-grade, lime-free, washed quartzite grit (particle size=4 mm) to a depth of 20 mm to allow free drainage underneath the tubes. Each cultivar was planted, one seed to each tube, in rows of five tubes, with five cultivars to each box, on 25 March 2002. Seeds were sown 20 mm deep. Boxes had holes drilled in the side 10 mm above the base to allow drainage. At GS 12, the holes in the waterlogging treatment boxes were closed with rubber bungs and the water level raised to 40 mm below the top of each tube. Plants were watered daily with tap water from sowing and a nutrient solution containing macro and micronutrients (Phostrogen, Bayer Crop Science) was applied weekly from 1 April 2002 until harvest. Waterlogging treatment began on 1 April 2002, after the plants had begun to tiller. Once in a week the bungs were removed from the waterlogged boxes to allow them to drain, then these were flushed with tap water to prevent build up of excess nutrients in the sand. Waterlogging continued for 4 weeks and plants were harvested at the end of this period, on 25 April 2002.
At harvest, 31 DAS, the plants were carefully removed from the tubes and washed. The number of live shoots on each plant was counted. Each plant was then separated into root and shoot fractions. These were dried for 48 h in an oven at 80°C and the dry weights recorded.
Experiment 3: Effect of winter waterlogging on the growth and yield of winter wheat cultivars under field conditions – 2002/03 field trial
The current experiment tested five cultivars chosen on the basis of their differing responses to waterlogging from the previous season's screen; these were Claire, Deben, Hereward, Riband and Xi-19.
The field experiments were conducted on soil of the Denbigh series, at Henfaes Research Centre, Bangor University (37°32′50″E, 26°57′50″N, 30-year annual rainfall of 1070 mm (Dimmock et al. Reference Dimmock, Bennett, Wright, Edwards-Jones and Harris2005)). The previous crop was an established grass ley of several years duration. The topsoil is approximately 900 mm deep and overlays stones, sand and gravel. Plots were 10·5 m long by 1·2 m wide, 10 rows per plot, with 120 mm between rows. Plots were aligned north to south along a gentle slope and arranged in six randomized blocks. Cultivar was the main plot treatment, with 1·2 m2 areas designated as waterlogged or drained controls within each. Control and waterlogged areas were at opposite ends of the plots, with the control areas upslope so that there was no danger of these being waterlogged. The waterlogging treatment was imposed by enclosing areas with bunds and applying water as required using an irrigation system. Plots were considered waterlogged when standing water held by the bund at the lower side of the slope was observed. The waterlogging period was from 17 December 2002 to 4 March 2003, although the system was turned off for 1 week, beginning on 6 January 2003, due to frost.
Seeds treated with bitertanol, fuberidazole and imidacloprid (Sibutol Secur, Bayer Crop Science) were supplied and sown on 30 September 2002 at a seed rate of 325 seeds/m2, using a plot drill (Wintersteiger) after preparation using a plough, followed by a tine cultivator. Plots were rolled after drilling. A compound fertilizer supplying 40 kg P2O5/ha and 40 kg K2O/ha was applied on 14 October (GS 12/13). Weeds were controlled using 20 g/ha flupyrsulfuron-methyl (Lexus, Dupont) on 15 November 2002 (GS 21). A total of 175 kg/ha N was applied in two splits; 70 kg/ha on 12 March 2003 (GS 25) and 105 kg/ha on 9 April 2003 (GS 30/31). Crop protection involved applications of 0·67 g cyprodinil/ha (Unix, Syngenta plc), 0·2 l trinexapac-ethyl/ha (Moddus, Syngenta) and chlormequat chloride (3C Chlormequat 750, BASF(UK) Ltd) at early stem extension (at GS 30/31), followed by 125 g epoxiconazole/ha+125 g kresoxim-methyl/ha (Landmark, BASF (UK) Ltd) at stem extension (GS 31). A further 125 g epoxiconazole/ha+125 g kresoxim-methyl/ha was applied at flag leaf emerged stage (GS 39). The emerged ears were protected by an application of 125 g tebuconazole/ha (Folicur, Bayer) applied at GS 61.
Plots were sampled for growth analysis on 5 March 2003 just after the end of the waterlogging period. All plants in an area 150 mm×3 rows wide (0·054 m2) were dug up and the number of plants counted. Tillers were counted and all the shoot materials bagged and dried in an oven at 80°C for 48 h. Once weighed, the dried samples were milled and analysed for nitrogen content using a semi-automatic Kjeldahl method (Kjeltech, Foss).
Plots were sampled again on 6 June 2003 at anthesis. The sample size was same as that observed previously and plants were cut at the basal node. Length of the stem from the base of the ear to the basal node was measured. Green leaf lamina area was measured using an optical area meter (LI-3000A, LI-COR). The fractions were then dried in an oven at 80°C for 48 h before being weighed to determine the dry weight, then milled and analysed for nitrogen content using a semi-automatic Kjeldahl method (Kjeltech, Foss).
Immediately before the final harvest at maturity, straw length from the basal node to the collar was measured in the standing crop, taking the mean of five measurements per plot. Harvest was carried out between 1 and 6 August as the cultivars attained maturity, starting with Xi-19, then Claire, then the remaining three. All the remaining plant material in the areas designated as waterlogged was harvested, along with 1 m long samples across the whole width of the control areas. Ears were cut at the collar, dried at 80°C for 48 h, then threshed using a laboratory threshing machine (Wintersteiger). Straw was cut at the soil surface and weighed fresh. A sub-sample was taken, weighed and dried to calculate straw moisture content and total straw dry weight. Samples of grain were weighed and a seed counter (Numigral, Tecator) was used to determine the thousand grain weight (TGW).
Experiment 4: 2003/04 field trial
In the second field trial in 2003/04, Riband was excluded. In Expt 3, this cultivar was severely affected by foliar disease (Septoria tritici), which destroyed most of the green area. The site used was adjacent to that used in the previous year, with the same soil type and gentle slope. Again a split plot design was used (main plot variety, sub-plot waterlogging treatment), in six randomized blocks. Plots were sown on 3 October 2003. Waterlogging was imposed between 3 December 2003 and 27 February 2004. Plant development when waterlogging was imposed and removed was at the same stages as the previous year. Crop management was identical to the previous season, except that the nitrogen rate was increased to 200 kg N/ha, applied as 100 kg N/ha at GS 30/31 on 30 March and the balance at GS 32 on 25 April. Growth analyses were carried out at the end of waterlogging on 2 March and anthesis (GS 61) on 9 June, using the same protocol as described for 2002/03, but additionally the number of nodal root axes present on a random sample of five plants from each sub-plot was counted at the end of waterlogging. The final harvest at maturity was carried out on 29 and 30 July, using the same protocol as described previously.
Experiment 5: Effects of waterlogging at the seedling stage on root growth of seven wheat cultivars
The effects of waterlogging on the growth and production of seminal and nodal roots by seven wheat cultivars were investigated using procedures similar to those used in Expt 2. The seven cultivars used were Claire, Deben, Hereward, Hyno Esta (hybrid), Paragon (spring), Soissons and Xi-19. Seeds were placed on moist filter paper in Petri dishes and put in an incubator at 18°C for 24 h and germinated seeds selected for sowing. The tubes as used in Expt 2 were filled with a growth media of five parts sieved soil (from the field site) to one part sand, by volume. A layer of coarse sand, 25 mm deep, was laid in the bottom of each box, the tubes arranged upright and soil packed around them. One germinating seed was sown, 20 mm deep, in the centre of each tube on 27 January 2004. Spare tubes were also sown on the same date. Eight boxes were set up so that a pair, one waterlogged and one control box, could be harvested at each of four timings after the beginning of waterlogging. Three replicates of each cultivar were sown in the first three pairs of boxes and four replicates in the last pair, to be the final harvest.
Emergence began on 3 February and emerged plants were counted daily. Nearly all plants had emerged by 9 February and any that had not done so by this date were replaced by the spares. Waterlogging began on 10 February, achieved by closing all drainage holes and raising the water level to 40 mm below the soil surface.
Harvests were carried out on 23 February, 5 March, 16 March and 31 March, at 28, 39, 50 and 65 DAS, respectively. Plants were removed from the tubes and the roots carefully washed to remove all soil. Leaves and tillers were counted, together with measurements of lamina length and health (data not shown). The number of seminal and nodal root axes initiated was counted and the length of the longest nodal and seminal root measured. The plants were then bagged and dried in an oven at 80°C for 48 h. The shoot and root systems were separated and weighed after drying.
Statistical analysis
Data from the cultivar screening experiments in the bins and tubes were analysed using the appropriate ANOVA using Genstat 7 (Lawes Agricultural Trust) after tests for normality of data and homogeneity of variance. A correlation matrix was constructed to determine the most important yield components and linear regression used to test any relationships between growth at the seedling stage (Expt 2) and final grain yield (Expt 1).
Data from the growth analyses conducted on the field trials (Expts 4 and 5) were analysed by ANOVA using the block structure year/block/cultivar/treatment. The field trial over two seasons is an example of a multi-environment trial (MET), and so an analysis method that allowed an insight into cultivar×environment was appropriate (Smith et al. Reference Smith, Cullis and Thompson2005). Additive main effects and multiplicative interaction (AMMI) analysis was used to test the data for yield and yield components. It uses a principle components analysis (PCA) to analyse the cultivar×environment interactions matrix generated by ANOVA (Gauch Reference Gauch1992) and allows the cultivar means to be plotted against the first principle component as a measure of stability.
Data from each sampling date in Expt 5 were analysed using the appropriate ANOVA.
RESULTS
Experiment 1
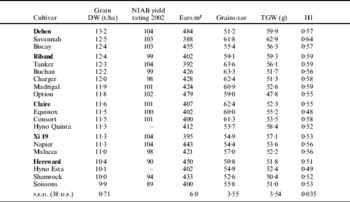
Soissons was the earliest cultivar to mature, followed by Hyno Esta and Hyno Quinta, and then Xi-19. The grain yield of Deben, the cultivar with the highest yield, was 33% greater than that of Soissons, the cultivar with the lowest yield. There were significant differences between cultivars in grain yield (P=0·01), ear number (P=0·020), grains per ear (P=0·005), TGW (P=0·016) and HI (P=0·018) (Table 2). The correlation matrix revealed that the most important components in determining yield of these cultivars after exposure to winter waterlogging were ear number (r=0·42) and TGW (r=0·427); the number of grains per ear was less important (r=0·274). Deben and Biscay produced a large number of ears and had high yields, whereas Xi-19, Soissons and Hyno Esta produced fewer ears and a lower grain yield. Deben, Savannah and Riband had a high TGW and yield, while Hereward, Shamrock and Soissons were low yielding, with lower TGWs. Due to restrictions in resources it was not possible to include drained controls in Expt 1. However, Table 2 also shows the relative performance of these cultivars in trials conducted over a range of sites for the Recommended List (NIAB 2002). (N.B. the Recommended List of Cereals is now produced by the Home Grown Cereals Authority.) The yield performance of the cultivars relative to each other is in general agreement with the NIAB figures, with the exceptions of Riband, Buchan and Charger which had yields, relative to the other cultivars, that were higher than that predicted by the NIAB ratings, and Xi-19 and Napier, which had yields lower than that predicted by their NIAB ratings. The current experiment and NIABs trials were carried out under different conditions, thus any comparisons between the data must be treated with caution.
Grain dry weight and yield components of 20 winter wheat cultivars at maturity in July 2002, following 77 days of waterlogging during winter (Expt 1)

Cultivars are ranked in descending order according to grain yield. Those highlighted in bold type were selected for inclusion in the field trial. NIAB yield data are expressed as a percentage of that for five control varieties and refers to fungicide treated from the Recommended List of Cereals 2002, LSD is quoted as 4%, P and s.e.d. are not given (NIAB 2002).
Experiment 2
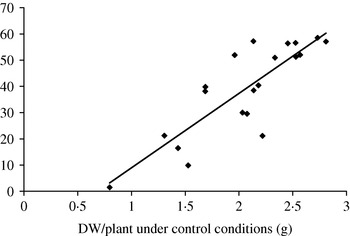
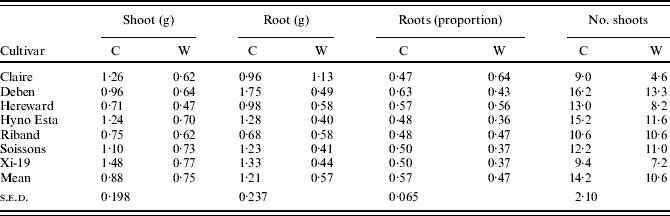
Waterlogging significantly (P<0·001) decreased shoot dry weight and root dry weight (Table 3). The effect was greatest for roots, so that the root system constituted a significantly (P<0·001) smaller proportion of the total dry weight of waterlogged plants than the control plants (Table 3). Waterlogging also significantly (P<0·001) decreased live shoot number (Table 3). Interactions between waterlogging and cultivar for shoot dry weight (P=0·043), root dry weight (P=0·001) and live shoot number (P=0·014) were significant. When data for all cultivars were pooled, the regression between plant dry weight under waterlogged and control conditions was not significant (P=0·180, R 2=0·047). However, dry weight of waterlogged seedlings in the tubes (Expt 2) was not predictive of final grain yield in Expt 1, the regression between the two being non-significant (P=0·837). Cultivars with the largest dry weights under drained conditions tended to suffer the largest decreases as a result of waterlogging (Fig. 1).
The relationship between mean percentage decrease in total dry weight of 20 wheat cultivars and the mean plant dry weight when grown in control conditions (Expt 2). P<0·001, proportion of variance accounted for by linear regression=0·69.

Shoot dry weight (g), root dry weight (g), root dry weight as a proportion of total plant dry weight, and the number of shoots per plant, of 20 winter wheat cultivars grown in drained (C) or waterlogged (W) conditions, harvested at 31 days old (Expt 2)
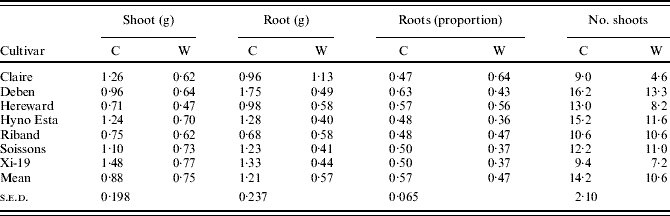
Data presented are the mean of all 20 cultivars; individual values are given only for cultivars used in further experiments reported in the current paper.
Experiments 3 and 4
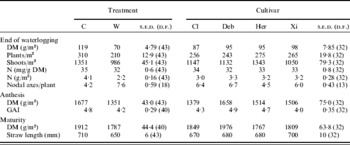
In 2002/03, Riband was afflicted by foliar Septoria disease and was not grown in 2003/04, so it is excluded from the analysis. Waterlogging significantly decreased total shoot DM measured at the end of waterlogging (P<0·001), anthesis (P<0·001) and maturity (P=0·008), although proportionally the difference between waterlogged and drained controls was smaller at the latter two sampling dates (Table 4). Differences between varieties were significant at anthesis (P=0·009) and maturity (P=0·015). There were no significant interactions between waterlogging and cultivar at any sampling date. At the end of the waterlogging period, both plant (P<0·001) and shoot populations (P<0·001) were significantly decreased by waterlogging, but differences between cultivars were only significant for shoot number (P<0·001). Again, there was no significant interaction between waterlogging and cultivar. Concentration of nitrogen in the leaves, measured as mg N/g of total DM, was slightly decreased (P<0·001) by waterlogging, and this together with the decrease in DM resulted in a 50% decrease (P<0·005) in total uptake of N after waterlogging compared to the drained controls. Waterlogged plants increased the number of nodal root axes initiated (P<0·001) and differences between cultivars were significant (P<0·001), with Hereward having fewer nodal roots than other cultivars. There was no significant interaction between cultivar and waterlogging for root production.
Effect of winter waterlogging (W) compared to drained controls (C) on the growth of four winter wheat cultivars, Claire (Cl), Deben (Deb), Hereward (Her) and Xi-19 (Xi), grown in 2002/03 (Expt 3) and 2003/04 (Expt 4)

Data are the means for both years. Data for number of nodal root axes per plant refer to 2003/04 only.
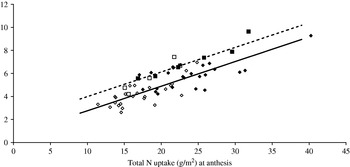
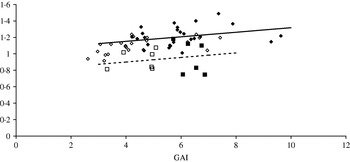
In 2002/03, there was a significant relationship between uptake of nitrogen at anthesis and green leaf area (Fig. 2), both of which were significantly decreased by waterlogging (Table 4). Deben was more efficient than the other cultivars in converting N into green area (Fig. 2). There was a weaker relationship between green area at anthesis and grain yield, but significant, and again waterlogging decreased both significantly (Fig. 3). Hereward was less efficient than other varieties in conversion of green area into yield (Fig. 3).
The relationship between green leaf area at anthesis and total nitrogen uptake by the crop (Expt 3). Filled symbols=drained controls, open symbols=waterlogged. P<0·001, proportion of variance accounted for by linear regression (unbroken line)=0·64, the addition of cultivar (square symbols=Deben, diamonds=other cultivars) to the model, P<0·001, proportion of variance accounted for by the model=0·77. Regression line for Deben=broken line.

The relationship between grain dry weight at harvest and leaf green area at anthesis (Expt 3). Filled symbols=drained controls, open symbols=waterlogged. P<0·015, proportion of variance accounted for by linear regression (unbroken line)=0·08, the addition of cultivar (squares=Hereward, diamonds=other cultivars) to the model, P<0·001, proportion of variance accounted for=0·45. Regression line for Hereward=broken line.

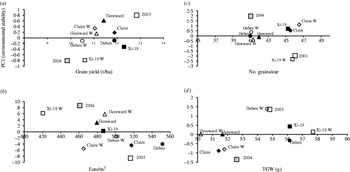
The values of grain yield and yield components for each cultivar, expressed as a mean for the 2 years, under drained (closed symbols) and waterlogged (open symbols) conditions are plotted against the principle components score of environmental stability (PC1) in Fig. 4. The mean of all cultivars under both treatments for each year is also plotted for yield and each component (large square symbols). A value for PC1 close to zero indicates good environmental stability. A large positive or negative value for PC1 on the same side of the x-axis as the year mean indicates that the cultivar performed relatively better in that year. For example, the mean yield for Xi-19 under waterlogged conditions has a large negative value for PC1, as does the mean for all cultivars in 2004 (Fig. 4a). Thus, under waterlogged conditions Xi-19 had a greater yield, relative to the other cultivars, in 2004 than 2003. Grain yield was very variable between years, being much higher in 2002/03 (mean of all cultivars, under both treatments=12·8 t/ha) than 2003/04 (9·9 t/ha) (Fig. 4a). Deben showed good environmental stability between years, in drained and waterlogged conditions, while Xi-19 and Hereward showed poor environmental stability under waterlogged and drained conditions, respectively. Waterlogging significantly (P<0·001) decreased grain yield and although Hereward showed a very much smaller decrease than the other cultivars, the interaction between waterlogging and variety was not significant. Yield showed greater environmental stability than any of the individual yield components. Waterlogging significantly (P<0·001) decreased the number of ears/m2. The interaction between waterlogging and cultivar was significant (P=0·005) for ear number, and all cultivars except Hereward showed a large decrease in ear population density. None of the cultivars were environmentally stable for ear number (Fig. 4b). Plants had more grains/ear in 2002/03 than in 2003/04, but waterlogging had very little effect, on grains/ear (Fig. 4c) or on TGW (Fig. 4d). Hereward and Xi-19 showed good environmental stability for TGW, although there was little variation between years for this characteristic.
Variety and year means for (a) grain yield, (b) ear density, (c) grain number per ear and (d) TGW by principal component measure of stability of four winter wheat varieties grown in two seasons in drained or winter-waterlogged soil (Expts 3 and 4). ◊, Claire; ○, Deben; ▵, Hereward; and □, Xi-19; drained controls are indicated by filled symbols, and waterlogged by open symbols.

Experiment 5
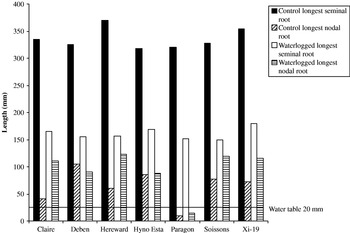
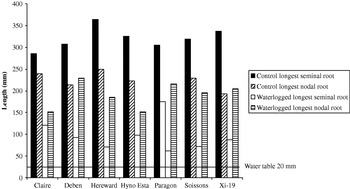
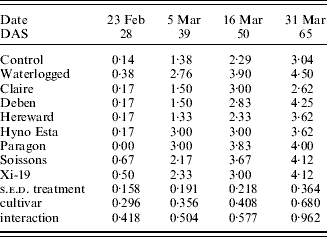
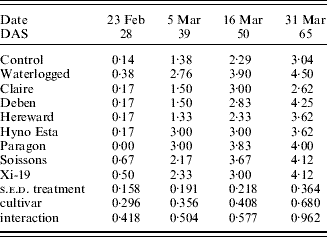
Waterlogging had a significant effect on the number of nodal root axes per plant observed at the second (P<0·001) and subsequent harvests (Table 5). Waterlogged plants initiated more nodal axes in response to waterlogging. Differences between the cultivars were significant at the second (P<0·001) and third harvest (P=0·019), when the fast developing Paragon and Soissons had more nodal axes than other cultivars. There was no significant interaction between waterlogging and cultivar for the number of nodal roots at any time. At the second harvest after 24 days of waterlogging, when the plants were 39 days old, the longest nodal roots of the waterlogged plants were significantly (P<0·001) longer than those of the controls (Fig. 5). This was a result of the nodal roots of waterlogged plants being initiated earlier (Table 5). Differences between cultivars were significant (P=0·014), with the spring wheat Paragon having much shorter nodal roots under both drained and waterlogged conditions. There was a significant (P=0·034) interaction between waterlogging and cultivar for nodal root length. Claire, Hereward, Soissons and Xi-19 had longer nodal roots under waterlogged conditions, whilst those of Deben were shorter. Waterlogging decreased (P<0·001) the length of the seminal roots, but there were no significant effects of cultivar or interactions. By the final harvest after 50 days of waterlogging, when the plants were 65 days old, there were no significant effects of waterlogging or cultivar on the length of the nodal roots (Fig. 6). At this time the nodal roots of the waterlogged plants were longer than the seminal roots, but no variety had roots able to penetrate more than 210 mm below the water line. As there was a difference between waterlogged and control plants at the earlier sampling, which had disappeared by the final sampling, this indicates that the growth rate of nodal roots of the waterlogged plants had been slowed. The seminal roots of the waterlogged plants were much shorter (P<0·001) than the controls and had begun to senesce. The tips had shrivelled by the final harvest and were largely restricted to above the water level (Fig. 6); in fact, they were shorter than those of waterlogged plants at earlier harvests. There were significant (P=0·015) differences between cultivars in seminal root length, with Hereward, Paragon and Soissons having the shortest. There was a significant (P<0·001) interaction between waterlogging and cultivar. The seminal roots of the waterlogged Hereward plants were only a quarter of the length of the controls, compared to those of Claire, which were half the length of the drained controls.
The mean length of the longest seminal and nodal roots of 39-day-old plants of seven wheat varieties, grown under waterlogged and drained control conditions, 24 days after the start of waterlogging (Expt 5).

The mean length of the longest seminal and nodal roots of 65-day-old plants of seven wheat varieties, grown under waterlogged and drained control conditions, 50 days after the start of waterlogging (Expt 5).

Effect of waterlogging on the number of nodal root axes per plant of seven wheat cultivars (Expt 5)
DISCUSSION
Although there were large differences in grain yield under waterlogged conditions between cultivars in Expt 1, and significant interactions between waterlogging treatment and cultivar at seedling growth stages in Expt 2, interactions between waterlogging treatment and cultivar were not found in Expts 3 and 4, the field trials. The only significant interaction between waterlogging and cultivar for any characteristic at any time was for ear population density at harvest. This resulted from the lack of response to waterlogging of Hereward, which is discussed later.
Differences in tolerance of waterlogging between cultivars could be expected to manifest themselves in the form of clearly identifiable characteristics, such as increased nodal root initiation or aerenchyma formation. Waterlogging increased the number of nodal root axes per plant under controlled (Expt 5) and field (Expt 4) conditions. In both these experiments there were no significant differences between cultivars in their ability to do this, although such differences have been reported by other workers using North American and Australian cultivars (Huang et al. Reference Huang, Johnson, Nesmith and Bridges1994a; Watkin et al. Reference Watkin, Thomson and Greenway1998). In Expt 5, there was no evidence that the nodal roots of any cultivar had a greater ability than those of any other to penetrate below the water level by the final sampling date. Therefore, there was no evidence of differences in root porosity between cultivars. By the last harvest, however, nodal roots of all cultivars were able to penetrate below the water level, whilst the seminal root system was largely restricted to above the water line. Thus, it can be concluded that the nodal roots of all varieties have a greater porosity, and hence penetration, than the seminal roots, in concurrence with previous findings (Trought & Drew Reference Trought and Drew1980; Huang et al. Reference Huang, Johnson and Nesmith1997). Examination of root tissues of these cultivars for aerenchyma using microscopy could be of value in a further study, especially in comparison with wetland grasses known to possess extensive aerenchyma. Malik et al. (Reference Malik, Colmer, Lambers and Schortemeyer2001) reported that the maximum extension of nodal roots was between 85 and 116 mm below the water table. In Expt 5, the penetration below the water table was between 131 mm (Claire) and 209 mm (Deben), perhaps indicating slightly better waterlogging tolerance of the UK wheat cultivars tested.
The severity of leaf chlorosis and premature senescence of lower leaves has been suggested as a characteristic that could be used to screen cultivars for tolerance to waterlogging (Villareal et al. Reference Villareal, Sayre, Baneulos and Mujeeb-Kazi2001). Leaf greenness measurements using a Minolta SPAD meter taken on the cultivar screen in Expt 1 suggested that there were differences between cultivars in the rate of lower leaf senescence in response to waterlogging, for example there was a trend for readings on Deben to be high and Xi-19 to be low (data not shown). However, readings were inconsistent between sampling dates and a major caveat when using SPAD meter greenness readings is that there were inherent differences in leaf colour between cultivars observed in the absence of waterlogging stress. For example, Xi-19 showed pale early growth, and then developed a distinct blue-green colour by anthesis. To be more meaningful, SPAD measurements must be calibrated with chemical determination of chlorophyll or nitrogen content. This was not possible in Expt 1 due to the small leaf area, and for these reasons the SPAD data are not presented. When leaf nitrogen was measured at the end of waterlogging in the field experiments there were no significant differences between cultivars (Table 4). However, because nitrogen was measured on a homogenized sample from all leaves and the SPAD readings were taken on the lower leaves, the latter would be expected to be more sensitive in picking up differences between cultivars. Waterlogging did significantly decrease leaf nitrogen content in the field, in concurrence with the decline in SPAD readings observed in the bins. In addition, the decline in SPAD readings taken on leaf 3 (data not shown) was halted following the cessation of waterlogging and application of N fertilizer. These data indicate that the observed leaf chlorosis, especially of lower leaves, is due to waterlogging restricting N uptake, but the effects are no greater in any cultivar than any other.
A second caution that must be considered when using leaf chlorosis as a measure of susceptibility is that cultivars with a faster development rate, such as Xi-19, which was one of the first cultivars to mature, may be expected to have a slightly increased rate of leaf turnover and hence enhanced senescence of lower leaves.
In the initial screen, ear number and TGW accounted for the majority of the variation in yield between cultivars. TGW had much smaller values for PC1 than ear number in the AMMI analysis of the field data from two seasons, indicating that TGW had greater environmental stability than ear number, and that ear number was influenced by environmental factors to a greater extent than TGW. Waterlogging decreased ear number but had no significant or consistent effect on TGW, thus indicating that the main mechanism by which waterlogging decreases yield is by a decrease in ear population. This is in agreement with previous workers (Cannell et al. Reference Cannell, Belford, Gales, Dennis and Prew1980). Hereward suffered the smallest decrease in yield, and the smallest decrease in ear number. An explanation for this may be the prolific but inefficient tillering habit of Hereward producing a large number of tillers by early spring (Table 4), hence a lot of ‘spare capacity’ to allow compensation. Another explanation may lie with the source and sink theory of crop yield formation, in that Hereward was ‘sink limited’, whilst waterlogging restricted the source, by decreasing nitrogen uptake and thus green leaf area. For all the other cultivars, this decrease in the source of photosynthates decreased yield; there being a positive correlation between green leaf area at anthesis and grain dry weight at harvest (Fig. 3). This lack of yield response in Hereward to factors that affect the source (size and duration of green leaf area), such as foliar disease and fungicide application, has been observed previously (Dimmock & Gooding Reference Dimmock and Gooding2002; HGCA 2003; Ruske et al. Reference Ruske, Gooding and Jones2003). Modern varieties are more efficient in resource capture and partitioning, as a result of their higher pre-anthesis radiation use efficiency (RUE) and HI (Shearman et al. Reference Shearman, Sylvester-Bradley, Scott and Foulkes2005), so would be expected to show a greater yield decrease due to stress.
Data from the initial screens suggested that Xi-19 could be more susceptible to waterlogging and in the field showed the largest decrease in yield due to waterlogging. However, waterlogged yield of Xi-19 was relatively much better in 2004, illustrated by the high value of PC1 in the AMMI analysis (Fig. 4a). To make a valid judgement of tolerance or susceptibility, cultivars must be tested across several sites or growing seasons. Such METs also generate cultivar×environment interactions that can make interpretation difficult. AMMI is a powerful technique that, through its ANOVA and PCA components, allows high-yielding and stable cultivars to be identified. In this case, identifying poor environmental stability for yield under waterlogged conditions, as in the case of Xi-19, could be a useful extension of the AMMI technique into the study of plant stresses.
The lower yields in 2003/04 were due to a lower ear population density and smaller number of grains on each ear. This was most likely a result of the drought during April and May of that year, during which leaf rolling was observed, which would have caused death of tillers. The rest of summer 2004 was wet and this may have affected grain set, resulting in a decrease in grain number per ear.
AMMI analysis showed that yield was more environmentally stable than any of the yield components. This can be explained when it is considered that yield is the product of the yield components and that this allows some compensation, especially as yield components are determined at different times: ear number before anthesis, coinciding with waterlogging; mean grain weight (TGW) between anthesis and maturity, during the post-stress recovery period. For example, waterlogging decreased the ear number of Xi-19, but the TGW of waterlogged Xi-19 was greater, partially compensating and resulting in better environmental stability for yield than the yield components. Simple ANOVA on each of the variables is far less powerful than AMMI in elucidating these patterns.
Hereward had the smallest yield response to waterlogging, but also the lowest yield in drained conditions. Cannell et al. (Reference Cannell, Belford, Gales, Dennis and Prew1980) and Box (Reference Box1986) reported that yield losses due to waterlogging tended to be greatest when yields were heaviest and the apparent tolerance of low-yielding cultivars, when the ability to maintain yield at a high percentage of the control is regarded as tolerance, has been identified by previous workers (Singh & Singh Reference Singh and Singh2003). However, such tolerance is of little use to a farmer, if yields are still lower than a less-tolerant cultivar with a higher yield potential. Low-yielding but tolerant cultivars would be of use in breeding programmes if traits to explain the tolerance could be identified. However, no such traits were apparent in any of the cultivars tested, for example Hereward had the smallest number of nodal root axes.
The mean yield loss due to waterlogging for all cultivars and both years in the field experiment was 8·9%. Cannell et al. (Reference Cannell, Belford, Gales, Dennis and Prew1980) recorded grain yield losses of up to 15% using outdoor lysimeters. This is compared to losses of around 45% in the Gulf Coast region of the southern USA (Musgrave & Ding Reference Musgrave and Ding1998, Collaku & Harrison Reference Collaku and Harrison2002). The reason for this difference is twofold: the temperature and plant growth stage at which waterlogging occurs, and the predominant use in the UK of winter as opposed to spring wheat cultivars. Luxmoore et al. (Reference Luxmoore, Fischer and Stolzy1973) found that higher temperatures increased the damage caused by waterlogging substantially; 30 days' waterlogging at 15–17°C reduced grain yields by 15–23%, compared to 73% loss due to 30 days' waterlogging at 25°C. The winter growth habit allows the plant plenty of time to recover from any sub-lethal winter stress when rapid growth resumes in spring. Although waterlogging tolerance is not usually selected for specifically, it would contribute to the winter hardiness that is a desired trait in cereals bred for UK conditions (J. Valentine, personal communication, 2007) and so could have been enhanced in UK cultivars by plant breeding. Some of the cultivars displayed growth characteristics that would help them to cope better with waterlogging. Claire is recommended for early drilling and has strong winter dormancy (Anon 1999). This lower growth rate during waterlogging would mean a lower metabolic demand for oxygen and hence limit damage by hypoxia, which is more deleterious when growth rates are high (Greenway & Gibbs Reference Greenway and Gibbs2003). Deben had a high tillering capacity and, whilst it was no more tolerant to waterlogging than the other varieties, had a good ability to recover in the spring. The hybrid varieties, Hyno Esta and Hyno Quinta, grew vigorously in the autumn before waterlogging, but did not appear to recover after waterlogging as well as Deben. Both hybrids had low harvest indices, in comparison with the conventional cultivars.
Although it is desirable to find a simple screen for waterlogging tolerance that could be applied at the seedling stage, which would allow large numbers of cultivars to be tested without the cost in time and resources needed to run a field trial, the results of the present experiments suggest that it would not be possible. In part this is due to the lack of diversity found in current UK commercial cultivars in expression of tolerant characteristics and because of the lack of a significant relationship between early season growth and yield. This latter point is a result of the growth habit of winter dormancy followed by vigorous spring growth, with the potential to compensate for winter damage. Comparisons of container-grown plants and field trials are difficult both due to artificial constriction of the root system (Ritchie Reference Ritchie1973) and differences in growth conditions likely to affect results, for example higher temperatures in glasshouse experiments (Luxmoore et al. Reference Luxmoore, Fischer and Stolzy1973). The observation that stress tolerance is often a product of growth habit, as much as any clearly identifiable physiological characteristics, means that molecular screening and marker-assisted breeding may be of only limited value in breeding stress-tolerant cultivars. Wide crossing with wild relatives has been used with limited success to compensate where diversity is absent in the wheat gene pool (Taeb et al. Reference Taeb, Koebner and Forster1993; Cai et al. Reference Cai, Jones and Murray2001; Reynolds & Borlaug Reference Reynolds and Borlaug2006) and the recent decoding of the Ph1 chromosome pairing locus (Griffiths et al. Reference Griffiths, Sharp, Foote, Bertin, Wanous, Reader, Colas and Moore2006) offers hope that problem of introgression of large parcels of undesirable ‘weedy’ or wild traits with the selected trait may be overcome.
The authors wish to thank Llinos Hughes for technical help and advice, Mark Hughes for technical help with the field experiments, Bill Handley at HGCA for seeds and the trustees of the William Roberts Scholarship that provided funding for Edward Dickin.