


The third stage for palliative surgical reconstruction for children with functional single-ventricle physiology is the completion of the total cavopulmonary connection, where the superior and inferior caval vessels are routed directly into the pulmonary arteries.Reference de Leval, Kilner, Gewillig and Bull1 This patient population continues to grow, with approximately 5000 newborns in the United States joining the existing single-ventricle patient population each year, along with increasing numbers of adult Fontan patients surviving longer because of the advances in surgical techniques and post-operative management. Although most post-operative Fontan patients experience an acceptable quality of life, their lifespan is shorter than normal, with a significant number of these patients developing late haemodynamic complications.Reference Ghanayem, Berger and Tweddell2, Reference Anderson, Sleeper and Mahony3 Unfortunately, for many Fontan patients, cardiac transplantation has now become their final “stage” option.
Following the single-ventricle palliation, there is increased afterload and decreased preload reserve in the Fontan circulation. This requires low pulmonary vascular resistance, which is associated with the calibre of the main pulmonary arteries and downstream vasculature, to alleviate the low cardiac output state.Reference Dasi, Krishnankuttyrema and Kitajima4, Reference Sundareswaran, Pekkan and Dasi5 Surgical pathway resistance is an integral piece of pulmonary vascular resistance, and in some functional patients it can be as high as the pulmonary vascular resistance, which would affect the cardiac output non-linearly, with further consequences at exercise.Reference Whitehead, Pekkan, Kitajima, Paridon, Yoganathan and Fogel6 Both our earlier in vitro physiological bioengineering modelsReference Pekkan, Frakes, De Zelicourt, Lucas, Parks and Yoganathan7 and recent clinical studiesReference Krishnan, Taneja, Gewitz, Young and Stewart8, Reference Myers, Ballman, Riegle, Mattix, Litwak and Rodefeld9 suggest that Fontan physiology necessitates vascular remodelling towards stiffer venous compliance to restore the normal cardiac output. The absence of direct ventricular assistance for pulmonary blood flow along with these altered venous characteristics suggests that optimisation of the Fontan pathway haemodynamics may improve patient outcomes. Most of the published efforts to date have focused on minimising energy losses within Fontan connections.Reference Wang, Pekkan and de Zelicourt10–Reference Bove, de Leval, Migliavacca, Guadagni and Dubini13 An extensive review of these studies has been provided by our group.Reference DeGroff14 Efforts to quantify the steady-state energy losses inside patient-specific total cavopulmonary connection geometriesReference Whitehead, Pekkan, Kitajima, Paridon, Yoganathan and Fogel6, Reference Pekkan, de Zelicourt and Ge11, Reference Pekkan, Kitajima and de Zelicourt15 identified non-dimensional power-loss metrics that depend on steady-state pathway flow rate – cardiac output; patient body surface area – total cavopulmonary connection size; secondary anatomical features – offset, flare, etc.; and pulmonary flow split.Reference Dasi, Pekkan, Katajima and Yoganathan16 As demonstrated in this study, the non-dimensional formulation allows performing parametric studies, where the effect of a particular metric, that is, cavopulmonary flow pulsatility, can be investigated by fixing each other parameter, that is, cardiac output, flow splits, and surgical design dimensions.
Pulsatile flow simulations incorporating phase-contrast magnetic resonance image measurements have recently been used in pre-surgical planning applications.Reference Marsden, Reddy, Shadden, Chan, Taylor and Feinstein17, Reference Sundareswaran, de Zelicourt and Sharma18Nevertheless, limited attention has been given to the real-time “pulsatile” venous flow characteristics of the cavopulmonary pathway associated with the pronounced respiratory effects within the single-ventricle circulation.Reference Hjortdal, Emmertsen and Stenbog19 Our recent experimentally validated pulsatile computational investigations with real-time pulsatile caval waveforms suggest that for fixed cardiac output, energy loss is significantly influenced by the phase-angle between caval inflows.Reference Dur, DeGroff, Keller and Pekkan20 This prompted the present study where the caval waveform topologies of “failing” Fontan patients are found to be considerably different from those found in functional Fontan patients. In addition, to our knowledge, the energy state in the “failing” Fontan group has not been well documented. On the basis of the theoretical advantage of minimising energy losses in the single-ventricle circuit, we hypothesise caval flow pulsatility to be a significant haemodynamic parameter among the other factors.Reference Dasi, Sundareswaran and Zelicourt21 Similarly, the distribution of suspected “hepatic growth factors”, which are thought to be carried by the inferior caval flow stream to the pulmonary arteries, needs to be investigated at pulsatile flow conditions. Quantification of the energy efficiency of the “failing” venous flows may provide additional haemodynamic indices that complement the previously derived steady total cavopulmonary connection energy loss formulations.Reference Dasi, Pekkan, Katajima and Yoganathan16
The major causes of late mortality in this patient cohort have been attributed to impaired ventricular function, due to systemic right ventricle morphology;Reference Yoshimura, Yamaguchi and Oshima22–Reference Hosein, Clarke and McGuirk25 low ejection fraction less than 60%;Reference Yoshimura, Yamaguchi and Oshima22 atrioventricular valve regurgitation;Reference Yoshimura, Yamaguchi and Oshima22 higher ventricular end-diastolic pressure;Reference Williams, Sleeper and Colan23, Reference Khairy, Fernandes and Mayer24 protein-losing enteropathy;Reference Khairy, Fernandes and Mayer24 thromboembolism;Reference Khairy, Fernandes and Mayer24 elevated pulmonary artery pressures;Reference Williams, Sleeper and Colan23 and atrial arrhythmias.Reference Williams, Sleeper and Colan23 Modern non-invasive methods of in vivo investigation – such as phase-contrast magnetic resonance imaging, computational tomography, and modern echocardiography – are beginning to help improve the overall understanding of late Fontan failure. Results using such imaging techniques will be used here in efforts to better understand the effects of caval flow pulsatility.
Earlier bioengineering studies on Fontan haemodynamics exclusively focused on patients who are doing well, despite the growing number of adult late survivors with declining haemodynamic states. The available multi-channel acquisition of caval waveforms, respiratory and echocardiography signals reveal that the caval flow waveforms at rest are mainly based on two harmonics corresponding to respiratory and cardiac effects.Reference Marsden, Vignon-Clementel, Chan, Feinstein and Taylor26, Reference Hsia, Khambadkone, Redington, Migliavacca, Deanfield and de Leval27 Real-time magnetic resonance imaging measurements by Hjortdal et alReference Hjortdal, Emmertsen and Stenbog19 in patients with total cavopulmonary connection (mean age: 12, standard deviation: 4.6) show that the inferior caval flow waveform is periodic, in phase with the echocardiography signal, and has a biphasic topology. For these functional single-ventricle patients, the flow variations in the inferior caval flow waveform coincide well with the respiratory cycle, and minimum flow appears close to the end of expiration. In contrast, the corresponding superior caval flow waveforms do not have a well-defined characteristic shape.Reference Hjortdal, Emmertsen and Stenbog19 A comparison of both normal patients and single-ventricle patients (mean age: 10, standard deviation: 4) by Hsia et alReference Hsia, Khambadkone, Redington, Migliavacca, Deanfield and de Leval27 reported similar observations on caval waveforms but emphasised significantly lower cardiac dependence of caval flow in total cavopulmonary connection compared with normal patients. A recent magnetic resonance imaging study identified that patients with extra-cardiac conduit (mean age: 13.8, standard deviation: 11.2) and intra-atrial lateral tunnel (mean age: 16.9, standard deviation: 11.6) have significantly less caval pulsatility compared with atriopulmonary connections (mean age: 19.0, standard deviation: 7.9).Reference Klimes, Abdul-Khaliq and Ovroutski28 The authors highlighted the suboptimal haemodynamic state, that is, retrograde flow and atrial dilation, of the atriopulmonary connection and speculate the utility of caval pulsatility evaluation to predict late Fontan failure.
On the basis of these investigations, the objective of this study was to quantify the characteristic venous flow pulsatility and associated changes in the surrogate measures of haemodynamic performance – energy efficiency and hepatic flow distribution – in “failing” and functional Fontan patients. We aim to focus on the sequel of altered venous flow pulsatility in order to suggest the potential causes for the suboptimal physiological state of the “failing” Fontan patient group.
Materials and methods
Patient selection and ultrasonographic caval flow waveforms
We chose two representative “failing” Fontan patients, aged 25 and 13 years, with severe suboptimal haemodynamics in the New York Heart Association functional class III. Formerly, both patients underwent an extra-cardiac total cavopulmonary connection procedure without employing fenestration and were examined 14 years (standard deviation: 7) after the operation for this study. Before the examination, “failing” Fontan-1 patient developed major pulmonary arteriovenous malformations; both patients had ventricle systolic dysfunction and abnormal sinus rhythm, yet no clinical signs of protein-losing enteropathy. The subjective assessment of ventricular systolic function by echocardiography indicated impairment, and magnetic resonance imaging assessment of the ejection fraction was not available. “Failing” Fontan caval waveforms were acquired in-house using multi-channel simultaneous echocardiography, respiration, and real-time ultrasound measurements at the University of Pittsburgh, Children's Hospital. Measurements were recorded with an Acuson 128XP computed sonography (Acuson, Mountain View, California, USA), incorporating a 2.5-megahertz transducer during tidal breathing. Doppler sampling was guided via colour flow mapping to minimise the angle of insonation between the direction of the flow and the Doppler beam. Recordings were performed at the inferior caval vessel, 2 centimetres distal to the junction hepatic vein, and at the superior caval vessel, 1 centimetre distal to the junction to left pulmonary artery, for several respiratory cycles. Ultrasonic flow waveforms for the “failing” Fontan-2 patient (body surface area: 1.2 square metre, heart rate: 56 beats per minute, respiration rate: 32 cycles per minute) for three respiratory cycles is given in Figure 1. The corresponding functional Fontan caval waveforms were reproduced from the patient-specific real-time phase-contrast magnetic resonance imaging measurements available in the literature and are shown in Figure 2a.Reference Hjortdal, Emmertsen and Stenbog19 The trial was approved by the institutional review boards of the University of Pittsburgh. Informed consent was obtained from all patients before study enrolment.
Raw pulse-wave caval Doppler recordings sync with the respiration of the “failing” Fontan-2 patient. FF2 = “failing” Fontan-2 patient; IVC = inferior caval vein; SVC = superior caval vein.

The effectiveness of the emerging mechanical assist therapies for single-ventricle patientsReference Pekkan, Sasmazel and Sundareswaran29, Reference Throckmorton, Ballman, Myers, Frankel, Brown and Rodefeld30 may be influenced by the caval flow waveform quality and its effect on the local total cavopulmonary connection haemodynamics. Hence, in addition to the patient-specific caval flows, the pulsatile haemodynamic efficiency of waveforms generated through Fontan mechanical circulatory support is also investigated. The mechanically assisted venous flow waveforms utilised in this study were acquired (Fig 2b) through the six-compartmental bench-top of pulsatile single-ventricle flow loop incorporating Medos pulsatile infant ventricle assist device (Medos Medizintechnik AG, Stolberg, Germany; SV: 10 millilitres, 100 beats per minute) anastomosed to the inferior caval vein.Reference Dur, Lara and Arnold31
Flow waveform pulsatility analysis
Frequency and amplitude content of each caval flow waveform set was identified using fast Fourier transform, as shown in Figures 2 and 3. A discrete number of harmonics was used to reconstruct the time-dependent variation of venous flows, which is in strong agreement with the original ultrasound data (R2 = 0.90). Reconstructed “failing” Fontan flow waveforms were scaled to match the mean cardiac output of the functional Fontan data (Q = 3 litres per minute) in order to allow an unbiased comparison of caval pulsatility-dependent power loss and hepatic flow distribution.
Real-time venous flow waveforms from a typical functional Fontan patientReference Hjortdal, Emmertsen and Stenbog19 (a) and the bench-top single-ventricle flow loop incorporating paediatric Medos ventricle assist device anastomosed to the inferior caval veinReference Dur, Lara and Arnold31 (b) are plotted using three major harmonics over the original waveforms on the left. The frequency spectrum of each set of flow waveforms is given on the right. IVC = inferior caval vein; SVC = superior caval vein; 3H = three harmonics.

Doppler measurements of patient-specific “failing” caval flow waveforms (dashed lines) for “failing” Fontan-1 patient (a) and “failing” Fontan-2 patient (b) are reconstructed with discrete number of harmonic components (solid lines) with high accuracy (R2 = 0.90). The full spectral decompositions of these waveforms are also provided on the right. IVC = inferior caval vein; SVC = superior caval vein; 5H = five harmonics.

To quantify the pulsatility of the flow waveforms, two pulsatility indices were proposed. Time integral of the fluctuation of the total instantaneous venous flow, QV(t) from the time-average caval flow rate QAVG – that is, total cardiac output = 3 litres per minute, constant for this study – provided an index to predict the energy loss increase due to any arbitrary pulsatile flow waveform. The Total Caval flow Pulsatility Index was defined as

where QV(t) = QIVC(t) + QSVC(t) and  . The caval flow waveforms appear periodic with a period, with T referring to the length of the respiration cycle.
Frequency content of the inflow waveforms were quantified by a second index, that is, the Caval Frequency Index, which averages the amplitude-weighted frequency of the major harmonics of the caval flow waveforms. The number of harmonics used to decompose venous waveforms, utilised in the caval frequency index calculation, was determined based on the desired accuracy of the waveform reconstruction (R2 = 0.90):

In the above formula, subscript fi and Ai refer to the frequency and amplitude of the harmonics associated with inferior and superior caval flow waveforms. To further illustrate the influence of the caval flow pulsatility on the haemodynamic performance, the total amplitude fluctuations – that is, Total Caval flow Pulsatility Index – of the functional Fontan flow waveforms were minimised by modulating the phase-angle between the caval vein waveforms based on the protocol described previously.Reference Dur, DeGroff, Keller and Pekkan20 These venous flow waveforms were named “optimal” and are shown in Table 1.
Summary of results for the conduit energy losses, echocardiography-derived parameters that describe the venous flow pulsatile characteristics, and the hepatic flow distribution to left pulmonary artery for the typical Fontan patient flow waveforms.

CFI = caval frequency index; FUN = functional Fontan patient; FF1 = “failing” Fontan-1 patient; FF2 = “failing” Fontan-2 patient; H-LPA = hepatic flow to left pulmonary artery; IVC = inferior caval vein; OPT = phase-angle-optimized Fontan flow waveforms; SVC = superior caval vein; TCPI = total caval flow pulsatility index; VAD = ventricle assist device
Computational fluid dynamics
Computational fluid dynamics simulations were conducted on the idealised one-diameter offset standard total cavopulmonary connection geometry in order to illustrate the isolated effect of flow waveform pulsatility on energy lossReference Dur, DeGroff, Keller and Pekkan20 and remove the anatomy bias. Computations were performed using the unsteady second-order accurate solver of FLUENT version 6.3.26 (ANSYS Inc., Canonsburg, Pennsylvania, United States of America) to simulate incompressible and Newtonian blood flow with constant haemodynamic properties (ρ = 1060 kilogram per cubic metre, μ = 3.71 × 10⁻³ pascal-second).Reference Wang, Pekkan and de Zelicourt10, Reference Dur, DeGroff, Keller and Pekkan20 The accuracy of the solver was validated experimentally using in vitro models.Reference Wang, Pekkan and de Zelicourt10 Grid independency of the computational model (∼250k computational elements) was demonstrated previously.Reference Dur, DeGroff, Keller and Pekkan20 Reconstructed cavopulmonary flow waveforms were specified as periodic inlet boundary conditions in the computational simulations. As higher flow rates are known to generate higher energy losses, that is, as in exercise,Reference Whitehead, Pekkan, Kitajima, Paridon, Yoganathan and Fogel6 to eliminate the effect of mean cardiac output all waveforms used are scaled to provide the same total cardiac output of 3 litres per minute. The energy loss inside the surgical connection was calculated on the basis of the energy difference between the inlet and outlets.Reference Dur, DeGroff, Keller and Pekkan20 For the “failing” Fontan-1 patient, power loss is calculated through a converged running-average of three consecutive respiration cycles (∼11 seconds) because of cycle-to-cycle variations (aperiodicity) in the caval flow waveforms. In contrast, the periodicity of caval flows synchronised with the respiratory cycle allowed evaluation of the power loss for “failing” Fontan-2 and functional Fontan patients based on one respiration cycle. Hepatic flow distribution to the lungs was calculated by computing the trajectories of 400–600 zero-mass particles seeded across the inferior caval vessel inlet.Reference Dasi, Whitehead and Pekkan32 Pulmonary flow split was adjusted to satisfy equal flow distribution (QLPA/QRPA = 1) to both lungs at each time step. The details of the computational model have been previously described by Dur et alReference Dur, DeGroff, Keller and Pekkan20 Scatter plots and statistical regression analysis were performed with MedCalc Software Version 11.4.4 (Mariakerke, Belgium) to assess the strength and significance of the correlations between power loss and pulsatility indices.
Results
Detailed spectral analysis indicated that the functional Fontan caval flow waveforms can be accurately reconstructed (R2 = 0.91) using only the three main harmonics – the respiratory (fresp ∼0.3 hertz), cardiac (fcardiac ∼1.8 hertz), and tertiary (ftertiary ∼0.6 hertz) components as shown in Figure 2a-left. The tertiary component indicated the complex nature of the caval flows related to compliant vessel walls, splanchnic flow contribution, inertia of blood flow, and downstream wave reflections. In contrast, the frequency spectrum of both “failing” Fontan flow waveforms appeared more complex and required increased number of discrete harmonic pairs for accurate waveform construction. For “failing” Fontan-1 data, cardiac and tertiary components were replaced by a series of relatively smaller amplitude harmonics distributed over a large (0.6–1.2 hertz) frequency band. For “failing” Fontan-2 data, an additional high-frequency (∼2.6 hertz) harmonic contributed highly to the caval flow. The period of the respiration cycle was about 3.2 seconds for the functional Fontan flow waveforms (∼0.3 hertz), whereas the respiration cycle was relatively shorter for “failing” Fontan-1 (∼0.44 hertz) and “failing” Fontan-2 (∼0.53 hertz). Albeit the inferior caval flow of the failing” Fontan-2 data, the respiratory harmonic component contributed relatively highest to both inferior and superior caval flows. This indicates the functional respiratory flow augmentation in these “failing” Fontan patients. The ventricle assist device flow waveforms comprised very high-frequency oscillations (2–5 hertz) because of the lack of low-frequency respiration flow augmentation in the bench-top single-ventricle flow loopReference Dur, Lara and Arnold31 and the elevated pump speed to achieve the desired venous flow augmentation. Hence, cardiac pulsations were overridden in the ventricle assist device venous flow waveforms.
The energy efficiency of functional and “failing” Fontan flow waveforms, computed from computational fluid dynamics simulations, is found to be significantly different regardless of having the same time-averaged flow rate (QIVC + QSVC). Energy loss inside the one-diameter offset cavopulmonary connection geometry for the functional caval flow waveforms was 8.43 milliwatts, whereas the energy loss for “failing” Fontan-1 and “failing” Fontan-2 waveforms was 6.04 and 6.83 milliwatts, respectively (Table 1). Hence, energy loss was attenuated, which in turn increased the energy efficiency of the venous circulation by about 20–30% in “failing” Fontan patients for the fixed surgical design at the same cardiac output. Similarly, energy losses within the ventricle assist device-connected Fontan conduit appeared to be 16% lower than the functional and approximately 10% higher than the “failing” Fontan cases at the same cardiac output.
The two pulsatility indices (Equations 1 and 2) for each waveform were calculated from echocardiography data, based on the spectral content of the caval flow waveforms, and are presented in Table 1, together with the corresponding time-averaged energy loss. The pulsatile fluctuation of the total venous flow – total cavopulmonary pulsatility index – appeared to be the highest (approximately 64%) for the functional caval flows. The total cavopulmonary pulsatility index for the “failing” Fontan-1 and “failing” Fontan-2 patients and ventricle assist device-supported venous flow waveforms was notably lower, that is, 40%, 55%, and 49%, respectively. Figure 4a demonstrates that the marginally significant correlation (p = 0.052) between total cavopulmonary pulsatility index and the observed time-averaged hydrodynamic power loss variations at fixed cardiac output. The caval frequency index indicated that “failing” Fontan-2 (approximately 8.6) had a higher frequency content compared with “failing” Fontan-1 and functional Fontan flow data, which had similar frequency content (approximately 4.7). As expected, ventricle assist device venous waveforms had a notably higher frequency content (15.2) compared with the patient-specific venous flows because of the high pump speed and the lack of respiration in the bench-top single-ventricle mock loop.Reference Dur, Lara and Arnold31 According to Figure 4b, the power loss variation correlated weakly (p < 0.69) with caval frequency index provided that the outliers (failing Fontan-1 patient and functional waveforms) with significantly different total caval pulsatility index are excluded. Therefore, caval frequency index was unable to fully represent the variation in power loss for waveforms alone; instead, the pulsatile power loss was influenced by the interaction of multiple indices. The ‘Discussion’ section describes the collective interpretation of the pulsatile indices and their relation to the underlying physics.
Total caval flow pulsatility index was correlated well (p < 0.052) with the observed time-averaged hydrodynamic power loss variations at fixed cardiac output and surgical connection (a). Power loss correlated weakly (p < 0.69) with caval frequency index (b). Dotted curves represent the 95% confidence interval for the regression line (R2 = 0.77). CFI = caval frequency index; FF1 = “failing” Fontan-1 patient; FF2 = “failing” Fontan-2 patient; FUN = functional Fontan patient; OPT = phase-angle-optimized Fontan flow waveforms; PL = power loss; TCPI = total caval flow pulsatility index; VAD = ventricle assist device, respectively.

Hepatic flow distribution between the lungs differed considerably both along the cardiac/respiration cycle and among the different caval flow waveforms, as shown in Table 1. Particle-flow tracking analysis indicated that inferior caval flow distributes to the distal lung only when the flow reserve in the proximal lung is exceeded, that is, when inferior caval flow exceeds the right pulmonary flow for the given one-diameter offset total cavopulmonary connection configuration (Fig 5). For the “failing” patients, only a limited portion of inferior caval flow (9–18%) was directed to the lung on the opposite side of the offset, that is, left pulmonary artery. Inferior caval flow was distributed more evenly for the functional Fontan (32%) and ventricle assist device (28%) flow waveforms (Table 1). Figure 6 shows the strong correlation (p < 0.02) between the hepatic flow reaching to the distal lung (QH−LPA/QIVC) and caval flow split ratio (β = QIVC/QSVC). This trend indicates that a more balanced inferior caval flow distribution was achieved when time-averaged inferior caval flow exceeds the superior caval flow, that is, higher β. In addition, comparing the functional and caval phase-angle-optimised flow waveformsReference Dur, DeGroff, Keller and Pekkan20 (details are presented in the ‘Discussion’ section), the flow distribution to the left pulmonary artery was further improved (approximately 15%) by optimising the pulsatile content of the caval flows at the fixed β.
Hepatic flow distribution for functional Fontan and “failing” Fontan 2 patient at two sets of representative time points during the respiration cycle, where inferior caval vein (blue) and superior caval vein (red) streams alternately dominate the flow distribution to the lungs. For the one-diameter offset total cavopulmonary connection geometry, hepatic flow distributes to the distal lung, left pulmonary artery, only when the flow reserve in the proximal lung is exceeded, that is, when inferior caval vein flow is higher than the right pulmonary artery flow. Note that for the particular case of QLPA/QRPA = 1, QIVC > QRPA condition is analogous to β = QIVC/QSVC > 1 based on conversation of mass principle (net mass inflow = net mass outflow). IVC = inferior caval vein; LPA = left pulmonary artery; RPA = right pulmonary artery; SVC = superior caval vein.

Hepatic flow reaching the distal lung (QH-LPA/QIVC) correlated strongly (p < 0.02) with the caval flow split ratio (β = QIVC/QSVC). Dotted curves represent the 95% confidence interval for the regression line (R2 = 0.77). FF1 = “failing” Fontan-1 patient; FF2 = “failing” Fontan-2 patient; FUN = functional Fontan patient; OPT = phase-angle-optimized Fontan flow waveforms; VAD = ventricle assist device; IVC = inferior caval vein; SVC = superior caval vein; H-LPA = hepatic flow to left pulmonary artery, respectively.

Discussion
The Fontan operation is now a very common palliative procedure performed to treat patients with complex congenital cardiac defects unable to receive bi-ventricular repair. The Fontan procedure has created a growing population of patients with complex congenital cardiac disease, a significant portion of who now survive past childhood. In fact, many of these Fontan patients now survive for decades, and much of the improved survival rates may be attributable to an improved understanding of Fontan haemodynamics leading to refined surgical procedures. The prospect of continuing late attrition, however, remains a genuine concern.
Unfortunately, progress to develop alternative surgical strategies for patients with single-ventricle physiology has been reaching a plateau with little derived physiological benefit from what are now minimal adjustments to already refined surgical techniques. Recent studies indicate that application of a paediatric mechanical circulatory support in the Fontan circuit may augment venous flow, improve ventricular preload, and reverse the Fontan Paradox of under-filling of the pulmonary arteries during late failing states of the disease.Reference Throckmorton, Ballman, Myers, Frankel, Brown and Rodefeld30, Reference Dur, Lara and Arnold31 However, poorly designed circulatory assist therapies could potentially increase caval flow stream collisions, resulting in poor conduit flow quality and worsening efficiencies. Therefore, such circulation assist options should be validated through clinical investigations guided by bioengineering analysis.Reference Sundareswaran, Pekkan and Dasi5, Reference Pekkan, Frakes, De Zelicourt, Lucas, Parks and Yoganathan7, Reference Dur, Lara and Arnold31
Previously, we studied the pulsatile characteristics of venous flow waveforms that might be generated at the inferior and superior caval vessels by such venous assist therapies. Our numerical findings indicated that flow pulsatility variations due to the modulation of phase-angle between inferior and superior caval flow have a significant impact on venous energetics, and if optimised may provide 2–34% power loss relief – a function of conduit anatomy – inside the total cavopulmonary connection pathway for the fixed geometry.Reference Dur, DeGroff, Keller and Pekkan20 By modulating the caval vein phase-angle, in turn decreasing the total caval pulsatility index, we demonstrated the feasibility of venous flow waveform optimisation, which yielded 11% lower energy loss compared with the functional data for the same cardiac output – 3 litres per minute. In this study, we embarked upon evaluating the venous flow energetics of the functional and “failing” Fontan patients based on the respiration-synchronised patient-specific Doppler ultrasound caval flow waveforms from a small subset of Fontan patients. Our computational study revealed that pulsatile energy loss of “failing” Fontan patient flow waveforms was significantly lower compared with the functional Fontan patient flow waveforms for the same cardiac output and fixed surgical template. Provided that the effect of cavopulmonary power loss on cardiac index is significant, having lower energy losses at this suboptimal state may be an intrinsic physiologic attempt to augment cardiac output in “failing” Fontan patients.Reference Dasi, Krishnankuttyrema and Kitajima4, Reference Sundareswaran, Pekkan and Dasi5 To note, it is faulty to interpret our findings, as the patient-specific “failing” Fontan energy efficiency is superior to the functional. Fully patient-specific energy evaluation of cavopulmonary power loss depends strongly on the cardiac output,Reference Whitehead, Pekkan, Kitajima, Paridon, Yoganathan and Fogel6, Reference Dasi, Pekkan, Katajima and Yoganathan16 conduit geometry,Reference Pekkan, de Zelicourt and Ge11, Reference Marsden, Bernstein and Reddy33, Reference Migliavacca, Dubini, Bove and de Leval34 body surface area,Reference Dasi, Pekkan, Katajima and Yoganathan16 pulmonary anatomy,Reference Dasi, Krishnankuttyrema and Kitajima4 and pulsatile content of the venous flow.Reference Dur, DeGroff, Keller and Pekkan20 In this proof-of-concept study, we demonstrated the significance of patient-specific venous flow pulsatility on haemodynamic performance of Fontan connection and the higher efficiency of “failing” Fontan caval flows relative to the functional Fontan solely based on isolated effect of the pulsatile content, that is, for the same cavopulmonary geometry, body surface area and cardiac output.
The proposed echocardiography-derived pulsatility indices successfully predicted the energy efficiency of different caval flow waveform sets with different harmonic contents. Our results show that the total caval pulsatility index followed the trend in energy loss variation closely and provided a comparative basis for the venous energy efficiency in Fontan patients. On the other hand, a comparison between optimal and ventricle assist device flow waveforms indicated that, based on the higher frequency content, mechanically supported Fontan caval flow yielded lower power loss (6%) at the same total caval pulsatility index. Hence, in addition to the venous flow phase-angle and amplitude fluctuations, the frequency content of caval flow waveforms also influences the conduit energy efficiency remarkably. Recently, we developed a hybrid theoretical–numerical model and identified an analytical relationship between the pulsatile venous flow fluctuations and the energy loss inside total cavopulmonary connection.Reference Dur35, Reference Dur, Kocyildirim, Degroff, Wearden, Morell and Pekkan36 These analyses also indicated that the flow field within the one-diameter offset total cavopulmonary connection geometry follows the frequency-dependent characteristics of Womersley flow closely. Flow over a wide range of inflow frequency showed that the flow profile at low frequencies displayed a Poiseuille-like parabolic appearance along the one-diameter offset total cavopulmonary connection pathway. In contrast, when high-frequency oscillations were present, flow profiles were not able to reach the fully developed shape and yielded lower shear stresses, and in turn lower energy losses. Hence, higher frequency content of the “failing” Fontan-2 flow waveform contributed to the higher energy efficiency and agreed with our energy loss calculation. It is worthwhile to note that uneven caval flow split (β ≠ 1) also affect the pathway power loss at fixed cardiac output,Reference Khunatorn, Mahalingam, DeGroff and Shandas12 and needs to be considered to fully identify the relation between caval pulsatility and energy losses.
Clinically, it will be valuable to delineate easy-to-calculate pulsatility parameters that can correlate with the conduit energetics and allow patient-to-patient comparisons. The proposed indices complement the previously introduced steady-state non-dimensional metrics to characterise the total cavopulmonary connection power lossesReference Dasi, Pekkan, Katajima and Yoganathan16 and allows predicting the pulsatile power loss changes without time-demanding in silico computational fluid dynamics calculations. This study suggests a retrospective protocol, where the time-resolved inferior and superior caval flows – if available also the pulmonary flows – are acquired and exported to a spreadsheet to calculate the proposed time-integral-based caval flow pulsatility indices. In addition, fast Fourier transform analysis is required to calculate the proposed frequency content index. This methodology can also be interfaced with any real-time imaging modality – Doppler Ultrasound or Magnetic Resonance Imaging – which will be particularly useful for comparing the pulsatile performance of any arbitrary Fontan patient venous flows for immediate feedback in clinic. To note, previously, several imaging-based pulsatility indices have been proposed as clinically meaningful parameters to assess the peripheral vascular disease and atherosclerotic occlusions, renovascular function, foetal cardiovascular function, and arterial growth.Reference Guyton and Hartley37–Reference Evans, Barrie, Asher, Bentley and Bell39 Analogously, the proposed venous flow pulsatility indices may also provide a rationale that can correlate Fontan haemodynamics with altered cardiopulmonary dynamics, cardiac malfunction, and post-operative complications.Reference Ghanayem, Berger and Tweddell2, Reference Anderson, Sleeper and Mahony3 It is worthwhile to note that all the above image-based pulsatility indices,  , were used for quantifying the pulsatility of arterial flow waveforms with a characteristic monophasic topology synchronised with QRS complex. For the caval venous flow waveforms with biphasic or more complex topology, as in “failing” Fontan patients, traditional pulsatility index formulation may produce misleading results. A comparison of the proposed time-integral approach and traditional pulsatility index indicated that six out of twelve Fontan cavopulmonary flow waveforms fall outside of the correlation with 95% confidence interval (Fig 7). In addition, comparing the relative pulsatile content between the selected cavopulmonary waveforms (Table 2), the traditional pulsatility formula predicted relative pulsatility variation up to 70% error in comparison to the time-integral pulsatility scores. Hence, our study also demonstrates the significance of using the time-integral approach to quantify the cavopulmonary pulsatility in Fontan patients.
Comparison of the proposed time-integral evaluation of pulsatility index,  , and traditional pulsatility index,
 , indicated six out of twelve Fontan cavopulmonary flow waveforms fall outside of the correlation (R2 = 0.81) with 95% confidence interval (dotted curves). Traditional pulsatility formula predicted the relative pulsatility variation between the given cavopulmonary waveforms with up to 70% error in comparison to the time-integral pulsatility scores. Qmax, Qmin and
 , refer to the instantaneous flow waveform, peak flow, minimum flow and time-averaged flow, and period of the flow waveform, respectively. PI = pulsatility index; TIPI = time-integral evaluation of pulsatility index.

Pulsatility indices evaluation for the four cavopulmonary flow waveform sets based on traditional PI and TIPI formulations.
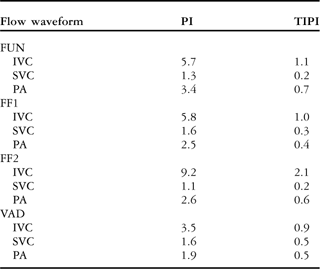
FUN = functional Fontan patient; FF1 = “failing” Fontan-1 patient; FF2 = “failing” Fontan-2 patient; IVC = inferior caval vein; PA = pulmonary artery; PI = pulsatility index; SVC = superior caval vein; TIPI = time integral pulsatility index; VAD = ventricle assist device
Similar to the total cavopulmonary pulsatility index, time integral pulsatility index is calculated as  , whereas, traditional pulsatility index is defined as
 . Q(t), Qmax, Qmin, and
 , refer to the instantaneous flow waveform, peak flow, minimum flow and time-averaged flow and period of the flow waveform, respectively
Recent clinical studies indicate that liver-derived “hepatic factors” are required for prevention of the pulmonary arteriovenous malformations,Reference Justino, Benson and Freedom40 and thus to allow normal lung development. Even distribution of hepatic flow to the lungs will ensure sustaining adequate concentration of hepatic factors present in the lungs. Hepatic flow distribution depends strongly on the surgical design of the cavopulmonary conduit.Reference Dasi, Whitehead and Pekkan32 Theoretically, for the one-diameter offset total cavopulmonary connection geometry, which offers minimum cross-flow mixing at the cavopulmonary junction, the relative hepatic flow reaching the lungs will depend solely on the inferior caval vein flow split to lungs. Our analysis indicated that for the fixed cardiac output and one-diameter offset surgical connection, inferior caval flow distribution to lungs depends strongly on the patient-specific caval flow waveforms. On the basis of the superior caval flow dominance, that is, lower β, “failing” Fontan patients exhibited compromised hepatic flow distribution to their lungs – to the lung distal to inferior caval vessel anastomosis. Comparison of the functional and caval phase-angle-optimised flow waveforms – at the same β – highlighted the effect of pulsatility on the hepatic flow distribution within the one-diameter offset total cavopulmonary connection. Hence, we demonstrated that modulation of the caval phase-angle not only reduces the hydrodynamic energy losses within the one-diameter offset total cavopulmonary connection,Reference Dur, DeGroff, Keller and Pekkan20 but also allows the inferior caval flow to distribute more evenly between the lungs. Hepatic flow distribution and its relation to “β and flow pulsatility” for different offset designs require further investigation. At present, this case study was based on a small patient cohort and lacks the effect of patient-specific anatomical features on venous pulsatility and compliance, which complicates the hepatic flow control. Therefore, this methodology needs to be expanded on a larger patient cohort, incorporate patient-specific anatomy, and post-operative haemodynamics in order to fully characterise the Fontan venous pulsatility and its correlation to the broader spectrum of “failing” Fontans.
The significant effect of caval pulsatility on cavopulmonary power dissipation may provide the impetus to design emerging mechanical assist therapies for single-ventricle patients to consider the influence of caval flow waveform quality on the local pathway haemodynamics. As a limitation, the ventricle assist device-inserted bench-top Fontan mock circuit lacked the sophistication of incorporating realistic respiratory mechanics and cardiothoracic interactions of the single-ventricle circulation. Possible animal models, more reliable bench-top paediatric single-ventricle flow loops, and circuit analogue lumped parameter models, are required for systemic evaluation and optimisation of new mechanical support strategies for short- or moderate-term use in the “failing” Fontans to decrease the workload on the single ventricle, thereby theoretically extending the life of the ventricle, or allow time as a bridge to transplant.Reference Pekkan, Frakes, De Zelicourt, Lucas, Parks and Yoganathan7, Reference Dur, Lara and Arnold31
Conclusion
This proof-of-concept study presents, to our knowledge, the first attempt to systematically quantify the haemodynamics in “failing” Fontan patients. On the basis of both the patient-specific Doppler echocardiography and mechanically generated time-resolved venous flows, we demonstrated the significance of venous flow pulsatility on conduit energetics and hepatic flow distribution within the one-diameter offset total cavopulmonary connection geometry. Our analysis indicated that because of the higher frequency content and lower amplitude fluctuations, “failing” Fontan patients had lower pulsatile energy dissipation, and in turn higher haemodynamic efficiency compared with the functional patients at the same normalised cardiac output. This lower pulsatile energy loss state for “failing” Fontan patients may be an indication of an inherent cardio/venous-adaptive management in order to reduce the strain on the malfunctioning single ventricle. Future numerical and in vivo studies will look to identify this condition incorporating a larger Fontan clinical database. As demonstrated in this study, quantification of the energy efficiency of the venous flow topology in terms of “clinically accessible” time-integral-based pulsatility indices may enable patient-to-patient haemodynamic performance comparison in clinic.



