Implications
Environmental and economic concerns regarding phosphorus (P) in pig production demand a reduction in dietary P provision. This requires an improvement in our ability to predict the amount of calcium (Ca) and P absorbed and retained taking into account the main sources of variation. In this context, the present meta-analysis proposes a quantitative evaluation of the influence of dietary P sources, Ca concentration and phytase addition on pig response to dietary P. The relationship established in this work will represent a useful tool to fine-tune dietary P and Ca supply.
Introduction
Dietary phosphorus (P) is essential for growth performance and bone mineralization in pigs, but high-P manure in areas of intensive pig production leads to environmental problems. Although strategies have been developed in recent decades to address the environmental issue of P in pig production, the constantly changing context of P feedstuffs, such as the changes in the price of inorganic phosphates and the use of microbial phytase (PhytM; Selle and Ravindran, Reference Selle and Ravindran2008), distillers dried grains with solubles (Stein and Shurson, Reference Stein and Shurson2009) and low-phytate ingredients (Htoo et al., Reference Htoo, Sauer, Yáñez, Cervantes, Zhang, Helm and Zijlstra2007), have resulted in a need to revise P feeding strategies. To better handle the forthcoming challenges of sustainable pig production, robust methods that consider both economic and environmental criteria are needed.
The development of new P feeding strategies requires the improved prediction of P absorption and retention by the pig, taking into account the main variables, dietary P sources, dietary calcium (Ca) concentrations and dietary additions of phytase. In feedstuffs of plant origin, P is found as phytate P (PP) or non-phytate P (NPP). PP is known to be only partially utilized by pigs in particular because of the poor solubility of phytate in the small intestine impeding its hydrolysis by endogenous phytase (Hu et al., Reference Hu, Wise and Henderson1996). The variable of dietary Ca concentration must be included as Ca concentrations can antagonize P absorption (Heaney and Nordin, Reference Heaney and Nordin2002) but remains essential for the deposition of P in bones. Although PhytM provides an opportunity to reduce dietary P, the most effective reduction of P and the dietary conditions that optimize phytase and P efficiency remain to be determined (Selle and Ravindran, Reference Selle and Ravindran2008).
Meta-analysis is a relevant method for summarizing and quantifying knowledge acquired through previously published research (Sauvant et al., Reference Sauvant, Schmidely, Daudin and St-Pierre2008). Given the large number of publications on P utilization in pigs, this statistical method was chosen to illustrate the complexity of the processes involved. Considering that dietary P forms, Ca and exogenous phytases may play a significant role on P utilization, the objective of this meta-analysis was to quantify their impact and their interactions on the response of P utilization criteria.
Material and methods
Data collection and coding
Articles investigating P digestibility in pigs from 1974 to 2009 were selected. A database that included general information (e.g. author name, date of publication), qualitative data (e.g. breed, sex) and quantitative data (e.g. feed composition, P digestibility, growth performance of the pigs) was then created. The database used for the meta-analysis comprised 377 treatments (Ntrt ) from 86 experiments (Nexp ) in 74 published references. Throughout the selected experiments, diets were formulated to meet all nutrient requirements of pigs except for P and Ca, the main explanatory variables studied. Among the references, 53% originated from Europe and the remaining from North America.
To avoid any confounding effect relative to the inactivation of intrinsic phytase activity due to feed processing such as steam pelleting (Jongbloed and Kemme, Reference Jongbloed and Kemme1990), the experiments in which plant phytase (PhytP) activity had not been analyzed (about 25%) were removed. The database was further refined by keeping only treatments focusing on PhytM feed enzyme derived from Aspergillus niger, which was the main source of phytase in the retained experiments (PhytM activity ranging from 164 to 1565 phytase units (FTU) per kilogram).
To select relevant observations for the analyses, codes were used to categorize the data; each publication included in the database was given a unique code, as well as their experiments there reported (Sauvant et al., Reference Sauvant, Schmidely, Daudin and St-Pierre2008). Each observation corresponded to the mean of one treatment group.
Calculations and choice of the dependent and independent variables
In the models, digestible P (g/kg), retained P (g/kg), average daily gain (ADG, g/day) and average daily feed intake (ADFI, g/day) were selected to assess P response. The amount of digestible P and retained P (g/kg) in the diet was calculated as the product of its dietary concentration (as-fed basis, g/kg) and of its apparent total-tract digestibility and its retention coefficient reported in the publications, respectively.
Dietary characteristics that were considered the most likely to impact in the P utilization were evaluated in the meta-analysis. Dietary total P (tP), PP, NPP and NPP of plant (NPPp), mineral (NPPm) and animal (NPPa) origins in each experimental diet were estimated from the list of ingredients, based on a table of feedstuffs composition (Sauvant et al., Reference Sauvant, Perez and Tran2004). Calculations of NPPm and NPPa were performed using only the P content of each source without any correction for their respective availability. Dietary NPP concentration was calculated as the sum of dietary NPPp, NPPm and NPPa concentrations. In 37% of the experimental treatments, the diets were supplemented with mineral P as dicalcium phosphate (34%), monocalcium phosphate (28%), defluorinated phosphate (18%), monodicalcium phosphate (11%) or monosodium phosphate (9%). Moreover, no more than 7% of the experimental treatments involved supplementation with NPPa as blood meal (54%), whey (32%) or fish meal (14%). Therefore, NPPm and NPPa were put together and named NPPm-a for the subsequent statistical analyses. Estimated values were generally selected for all explanatory variables except for dietary Ca concentration and phytase activity, for which preference was given to analyzed values. One phytase unit is the amount of enzyme that liberates 1 μmol inorganic P from 5.1 mmol/l sodium phytate per minute at pH 5.5 and 37°C.
The following explanatory variables were used in the statistical models: body weight (BW), dietary concentrations of PP, NPP, Ca, NPPp and NPPm-a (g/kg diet), and activity of phytase (FTU/kg diet) of PhytP or PhytM.
Data investigation and statistical analyses
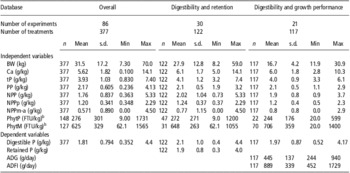
Three analyses were conducted using three data sets. The first data set contained the complete data set in which digestible P was systematically studied, the second was a subset restricted to the data for which both digestible P and retained P were reported, and the third one was restricted to studies in which digestible P, ADG and ADFI were available during the same period.
Descriptive statistics (mean, s.d., range of values) were generated for each variable in the selected subgroups (Table 1), as was a matrix of correlation between all nutritional parameters (results not shown).
Descriptive statistics for the databasesFootnote a

BW = body weight; Ca = calcium; P = phosphorus; tP = total P; PP = phytate P; NPP = non-phytate P; NPPp = non-phytate P from plant sources; NPPm-a = non-phytate P from mineral and animal sources; PhytP = plant phytase; PhytM = microbial phytase; ADG = average daily gain; ADFI = average daily feed intake.
a Publications used: overall database = Adeola et al. (Reference Adeola, Olukosi, Jendza, Dilger and Bedford2006), Akinmusire and Adeola (Reference Akinmusire and Adeola2009), Barrier-Guillot et al. (Reference Barrier-Guillot, Casado, Maupetit, Jondreville, Gatel and Larbier1996), Bayley and Summers (Reference Bayley and Summers1975), Beaulieu et al. (Reference Beaulieu, Bedford and Patience2007), Bohlke et al. (Reference Bohlke, Thaler and Stein2005), Bruce and Sundstøl (Reference Bruce and Sundstøl1995), Calvert et al. (Reference Calvert, Besecker, Plumlee, Cline and Forsyth1978), Cromwell et al. (Reference Cromwell, Coffey, Monegue and Randolph1995), Dilger and Adeola (Reference Dilger and Adeola2006), Düngelhoef et al. (Reference Düngelhoef, Rodehutscord, Spiekers and Pfeffer1994), Eeckhout and De Paepe (Reference Eeckhout and De Paepe1992), Guggenbuhl and Simões Nunes (Reference Guggenbuhl and Simões Nunes2007), Harper et al. (Reference Harper, Kornegay and Schell1997), Hill et al. (Reference Hill, Sutton and Richert2009), Jendza et al. (Reference Jendza, Dilger, Adedokun, Sands and Adeola2005 and Reference Jendza, Dilger, Sands and Adeola2006), Johnston et al. (Reference Johnston, Williams, Southern, Bidner, Bunting, Matthews and Olcott2004), Jongbloed and Kemme (Reference Jongbloed and Kemme1990), Jongbloed et al. (Reference Jongbloed, Mroz and Kemme1992, Reference Jongbloed, Kemme and Mroz1996 and Reference Jongbloed, Mroz, van der Weij-Jongbloed and Kemme2000), Kemme et al. (Reference Kemme, Jongbloed, Mroz and Beynen1997a, Reference Kemme, Radcliffe, Jongbloed and Mroz1997b, Reference Kemme, Jongbloed, Mroz, Kogut and Beynen1999a and Reference Kemme, Jongbloed, Mroz, Kogut and Beynen1999b), Ketaren et al. (Reference Ketaren, Batterham, Dettmann and Farrell1993), Kies et al. (Reference Kies, Kemme, Sebek, van Diepen and Jongbloed2006), Kim et al. (Reference Kim, Simmins, Mullan and Pluske2005 and Reference Kim, Sands, Mullan and Pluske2008), Kornegay and Qian (Reference Kornegay and Qian1996), Lantzsch et al. (Reference Lantzsch, Wjst and Drochner1995), Larsen and Sandström (Reference Larsen and Sandström1993), Lei et al. (Reference Lei, Ku, Miller and Yokoyama1993a and Reference Lei, Ku, Miller, Yokoyama and Ullrey1993b), Létourneau-Montminy et al. (Reference Létourneau-Montminy, Narcy, Magnin, Sauvant, Bernier, Pomar and Jondreville2010b), Liu et al. (Reference Liu, Bollinger, Ledoux, Ellersieck and Veum1997), Lyberg et al. (Reference Lyberg, Simonsson and Lindberg2005), Mroz et al. (Reference Mroz, Jongbloed and Kemme1994), Murry (Reference Murry1995), Narcy et al. (Reference Narcy, Létourneau-Montminy, Bouzouagh, Même, Magnin and Dourmad2010), Olukosi et al. (Reference Olukosi, Sands and Adeola2007), O'Quinn et al. (Reference O'Quinn, Knabe and Gregg1997a and Reference O'Quinn, Knabe and Gregg1997b), Pallauf et al. (Reference Pallauf, Rimbach, Pippig, Schindler and Most1994), Pointillart (Reference Pointillart1991), Pointillart et al. (Reference Pointillart, Fontaine and Thomasset1984, Reference Pointillart, Fontaine, Thomasset and Jay1985, Reference Pointillart, Fourdin and Delmas1987a and Reference Pointillart, Fourdin and Fontaine1987b), Qian et al. (Reference Qian, Kornegay and Conner1996), Radcliffe and Kornegay (Reference Radcliffe and Kornegay1998), Radcliffe et al. (Reference Radcliffe, Zhang and Kornegay1998 and Reference Radcliffe, Pleasant and Kornegay2006), Rodehutscord et al. (Reference Rodehutscord, Faust and Pfeffer1999), Sandberg et al. (Reference Sandberg, Larsen and Sandström1993), Sands et al. (Reference Sands, Ragland, Baxter, Joern, Sauber and Adeola2001), Schindler et al. (Reference Schindler, Lantzsch, Mosenthin, Biesalski and Drochner1997), Seynaeve et al. (Reference Seynaeve, Janssens, Hesta, Van Nevel and De Wilde2000), Skiba et al. (Reference Skiba, Hazouard, Bertin and Chauvel2000 and Reference Skiba, Callu, Castaing, Paboeuf, Chauvel and Jondreville2004), Spencer et al. (Reference Spencer, Allee and Sauber2000), Stein et al. (Reference Stein, Kadzere, Kim and Miller2008), Steiner et al. (Reference Steiner, Mosenthin and Greiner2006), Thacker et al. (Reference Thacker, Rossnagel and Raboy2003), Tonroy et al. (Reference Tonroy, Plumlee, Conrad and Cline1973), Veum et al. (Reference Veum, Ledoux, Raboy and Ertl2001 and Reference Veum, Bollinger, Buff and Bedford2006), Vipperman et al. (Reference Vipperman, Peo and Cunningham1974), Woyengo et al. (Reference Woyengo, Sands, Guenter and Nyachoti2008), Yi et al. (Reference Yi, Kornegay, Ravindran, Lindemann and Wilson1996), Zhang et al. (Reference Zhang, Kornegay, Radcliffe, Wilson and Veit2000), Zimmermann et al. (Reference Zimmermann, Lantzsch, Mosenthin, Schöner, Biesalski and Drochner2002 and Reference Zimmermann, Lantzsch, Mosenthin, Biesalski and Drochner2003); Digestibility and retention database = Bayley and Summers (Reference Bayley and Summers1975), Bruce and Sundstøl (Reference Bruce and Sundstøl1995), Düngelhoef et al. (Reference Düngelhoef, Rodehutscord, Spiekers and Pfeffer1994), Hill et al. (Reference Hill, Sutton and Richert2009), Ketaren et al. (Reference Ketaren, Batterham, Dettmann and Farrell1993), Lantzsch et al. (Reference Lantzsch, Wjst and Drochner1995), Larsen and Sandström (Reference Larsen and Sandström1993), Lei et al. (Reference Lei, Ku, Miller and Yokoyama1993a and Reference Lei, Ku, Miller, Yokoyama and Ullrey1993b), Létourneau-Montminy et al. (Reference Létourneau-Montminy, Narcy, Magnin, Sauvant, Bernier, Pomar and Jondreville2010b), Lyberg et al. (Reference Lyberg, Simonsson and Lindberg2005), Murry (Reference Murry1995), Narcy et al. (Reference Narcy, Létourneau-Montminy, Bouzouagh, Même, Magnin and Dourmad2010), Pallauf et al. (Reference Pallauf, Rimbach, Pippig, Schindler and Most1994), Pointillart (Reference Pointillart1991), Pointillart et al. (Reference Pointillart, Fontaine and Thomasset1984, Reference Pointillart, Fontaine, Thomasset and Jay1985, Reference Pointillart, Fourdin and Delmas1987a and Reference Pointillart, Fourdin and Fontaine1987b), Rodehutscord et al. (Reference Rodehutscord, Faust and Pfeffer1999), Sands et al. (Reference Sands, Ragland, Baxter, Joern, Sauber and Adeola2001), Spencer et al. (Reference Spencer, Allee and Sauber2000), Stein et al. (Reference Stein, Kadzere, Kim and Miller2008), Veum et al. (Reference Veum, Ledoux, Raboy and Ertl2001), Vipperman et al. (Reference Vipperman, Peo and Cunningham1974), Zimmermann et al. (Reference Zimmermann, Lantzsch, Mosenthin, Schöner, Biesalski and Drochner2002 and Reference Zimmermann, Lantzsch, Mosenthin, Biesalski and Drochner2003); Digestibility and growth performance database = Adeola et al. (Reference Adeola, Olukosi, Jendza, Dilger and Bedford2006), Cromwell et al. (Reference Cromwell, Coffey, Monegue and Randolph1995), Harper et al. (Reference Harper, Kornegay and Schell1997), Jendza et al. (Reference Jendza, Dilger, Sands and Adeola2006), Kies et al. (Reference Kies, Kemme, Sebek, van Diepen and Jongbloed2006), Kim et al. (Reference Kim, Sands, Mullan and Pluske2008), Kornegay and Qian (Reference Kornegay and Qian1996), Lantzsch et al. (Reference Lantzsch, Wjst and Drochner1995), Létourneau-Montminy et al. (Reference Létourneau-Montminy, Narcy, Magnin, Sauvant, Bernier, Pomar and Jondreville2010b), Narcy et al. (Reference Narcy, Létourneau-Montminy, Bouzouagh, Même, Magnin and Dourmad2010), Pointillart et al. (Reference Pointillart, Fontaine and Thomasset1984), Qian et al. (Reference Qian, Kornegay and Conner1996), Radcliffe and Kornegay (Reference Radcliffe and Kornegay1998), Radcliffe et al. (Reference Radcliffe, Zhang and Kornegay1998), Sands et al. (Reference Sands, Ragland, Baxter, Joern, Sauber and Adeola2001), Veum et al. (Reference Veum, Ledoux, Raboy and Ertl2001), Yi et al. (Reference Yi, Kornegay, Ravindran, Lindemann and Wilson1996), Zhang et al. (Reference Zhang, Kornegay, Radcliffe, Wilson and Veit2000).
b Values and numbers from experimental groups related to diets containing plant and microbial phytase only; FTU, phytase unit.
Particular attention was given to the meta-design, while the relationship between the independent variables taken 2 by 2 was examined graphically to assess the extent of variation in each experiment and to identify outliers. Any collinearity was identified. A graphical examination of the within- and between-experiment responses of each dependent variable (ADG, ADFI, digestible P and retained P) to the main covariate (dietary P) was also performed for each subgroup of data. This step made it possible to verify whether the relationship is the same within and between experiments and to choose the type of model to use. Considering that several qualitative factors, such as animal breed lines, physiological stages (weanling v. growing) and measurement methods (e.g. collection of total feces and urine v. grab sampling), could result in severe imbalance, which could lead to biased parameters estimates, the study effect has been included in the model (Sauvant et al., Reference Sauvant, Schmidely, Daudin and St-Pierre2008). This effect has been considered fixed rather than random to study the mean response valuable in the conditions of the database, that is, low-P diets, and not to generalize over the data range, as supported when considering the experiment as a random effect.
Thus, all statistical analyses were carried out using the GLM model (Minitab, version 14, State College, PA, USA). On the basis of previous literature data, a quadratic model was tested (Ekpe et al., Reference Ekpe, Zijlstra and Patience2002; Alebrante et al., Reference Alebrante, Donzele, Oliveira, Saraiva, Guimarães and Ferreira2011). Relationships between Y and the main explanatory variables X (PP, NPP, Ca, PhytM, PhytP and BW) were studied with a variance–covariance model as follows:

where Yij is the value of the dependent variable Y in the experiment i with the level j of dietary P; α is the overall intercept; αi is the effect of the experiment group i on the intercept α with the condition that the sum of each αi is equal to 0; b 1 and b 2 are the linear and quadratic coefficients of the relationship, respectively; and eij is the residual error. The quadratic model was also fitted to the data by including the cross-product of each dependent variable. All the variables found to be significant (P < 0.10) were kept, and the interactions between these variables were tested.
The fit of each relationship was then examined by studying the studentized residuals of the model and the normality of the residuals using the Shapiro–Wilk test. Outliers were identified first on the basis of residuals and by Cook's distance and DFITS (difference between the predicted values calculated with and without the ith observation; Sauvant et al., Reference Sauvant, Schmidely, Daudin and St-Pierre2008). The confidence interval of the model coefficient at 95% corresponds to plus or minus standard error of the coefficient (s.e.) multiplied by 1.96. Probability was considered significant at P-values less than 0.05 (P < 0.05), and tendencies were noted at P-values less than 0.10 (P < 0.10). Graphical examinations were carried out at each stage of the meta-analysis process.
Results and discussion
This work was part of an ongoing program for modeling the overall utilization of P by growing pigs, with dietary Ca and exogenous phytases taken into account (Létourneau-Montminy et al., Reference Létourneau-Montminy, Narcy, Lescoat, Magnin, Bernier, Sauvant, Jondreville and Pomar2011). Given the decrease in P in pig diets in recent years, the new challenge has been to include these critical parameters in feed formulation systems. Therefore, the current paper will (1) evaluate the impact of NPP, PP, Ca and phytases on digestible P, retained P and on ADG and ADFI; and (2) compare the effects of NPP, PP, Ca and phytases on digestible P v. retained P or digestible P v. growth performance.
Adjusted model of digestible phosphorus
Digestibility represents the first step in determining P utilization by the animal. For that reason, P availability for absorption in the digesta represents a major limiting factor that depends notably on the form of the P and the supply of dietary Ca and phytases. Indeed, in diet without phytase, P provided by mineral or animal feedstuffs is considered highly available, whereas only a small part of P from plant sources would be considered as such because that form needs to be hydrolyzed.
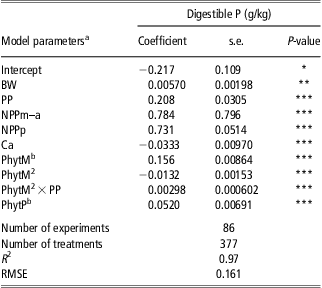
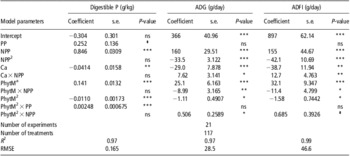
A linear relationship between NPP and digestible P was established (P < 0.001; Table 2).
Response of digestible P (g/kg) to variations in BW (kg), NPPm-a (g/kg), NPPp (g/kg), PP (g/kg), PhytM (FTU/kg), PhytP (FTU/kg) and Ca (g/kg)

P = phosphorus; BW = body weight; NPPm-a = non-phytate P from mineral and animal sources; NPPp = non-phytate P from plant sources; PP = phytate P; PhytM = microbial phytase; PhytP = plant phytase; Ca = calcium; R 2 = coefficient of determination; RMSE = root mean square error.
*P < 0.05; **P < 0.01; ***P < 0.001.
aOnly significant parameters are presented.
bPhytM and PhytP are expressed in 100 FTU/kg diet; FTU, phytase unit.
Considering the linearity of the response, it is likely that P transport across the digestive wall did not represent a limiting step for P absorption, at least in the conditions of the experiments introduced in the database. Both NPPm-a and NPPp remain highly digestible for pigs regardless of the NPP concentration, as proven by their estimated digestibility coefficients (78% and 73%, respectively, P < 0.001).
In the same way, it is likely that PP cannot be entirely hydrolyzed in the digestive tract because of the limited solubility of PP, which depends on pH conditions and on the transit of digesta (Létourneau-Montminy et al., Reference Létourneau-Montminy, Narcy, Lescoat, Magnin, Bernier, Sauvant, Jondreville and Pomar2011). PP utilization depends on several modulating dietary factors. First, the response of digestible P (Table 2) confirms that a considerable portion of dietary PP, namely 20 ± 6.1% (P < 0.001), is available for absorption without any exogenous phytase supply (Jongbloed et al., Reference Jongbloed, Mroz and Kemme1992; Rapp et al., Reference Rapp, Lantzsch and Drochner2001; Kemme et al., Reference Kemme, Schlemmer, Mroz and Jongbloed2006). Indeed, PP hydrolysis may be achieved by means of microbes such as lactic acid bacteria in the stomach (Shirai et al., Reference Shirai, Revah-Moiseev, García-Garibay and Marshall1994; Sreeramulu et al., Reference Sreeramulu, Srinivasa, Nand and Joseph1996), traces of activity remaining from feedstuffs and alkaline phosphatase activity in the small intestine (Schlemmer et al., Reference Schlemmer, Jany, Berk, Schulz and Rechkemmer2001).
Furthermore, the model indicates that PhytP and PhytM supply improves digestible P to different extents. First, the effect of PhytP is linear (P < 0.001), whereas PhytM displays both linear and quadratic components (P < 0.001). This discrepancy between the responses of the two phytases is probably related to the meta-design, given that PhytP activity is generally lower than PhytM activity (276 ± 310 v. 636 ± 345 FTU/kg). Moreover, the model confirms that the effect of PhytM on digestible P is greater than that of PhytP (2.4 times). This difference between the two phytases could be explained by a differential susceptibility to acidic pH and the fact that pepsin degradation in the stomach would be more conducive to PhytM activity than PhytP activity (Eeckhout and De Paepe, Reference Eeckhout and De Paepe1992; Phillippy, Reference Phillippy1999).
For a fixed dietary PP amount of 2.3 g/kg, the addition of 500 and 1000 FTU PhytM/kg led to 0.62 ± 0.08 and 0.93 ± 0.14 g digestible P/kg diet, respectively. These values are consistent with those of Kornegay et al. (Reference Kornegay, Radcliffe and Zhang1998), who reported 0.66 and 0.81 g digestible P/kg for 500 and 1000 FTU PhytM from A. niger per kilogram, respectively. It is worthy to note that, according to those authors, the equivalency value for 500 FTU PhytM/kg should correspond to 0.767 g digestible P/kg based on nonlinear equations generated from BW gain and bone mineralization responses obtained by feeding graded levels of inorganic P and PhytM.
The model also reveals that the amount of dietary PP may influence the impact of PhytM on digestible P (PP × PhytM2, P < 0.001). Indeed, for 2 and 3 g PP/kg, 500 FTU PhytM/kg increased digestible P by 0.60 and 0.67 g/kg, respectively. This enzyme–substrate interaction confirms that, as pointed out by Selle and Ravindran (Reference Selle and Ravindran2008), insufficient attention has been paid in the literature to dietary substrate levels in relation to phytase inclusion, especially in studies devoted to the assessment of phytase equivalency values for digestible P. Such studies should be carried out under standardized conditions of dietary PP provision.
Moreover, because the solubility of phytate largely determines its susceptibility to hydrolysis by phytase (Kemme, Reference Kemme1998), any factors that influence its solubility is likely to influence the efficacy of phytase in releasing P. Selle et al. (Reference Selle, Cowieson and Ravindran2009) indicated in their review that some authors reported that Ca may form insoluble complexes with PP in vitro. This interaction would in turn reduce the amount of soluble phytate and thus its susceptibility to hydrolysis by phytase. The current in vivo model reveals that dietary Ca linearly decreases digestible P (P < 0.01) independently of phytase supply. For example, increasing the dietary Ca concentration from 5 to 8 g/kg induces a reduction of 0.10 g digestible P/kg. This result is consistent with those of recent studies presenting an adequate experimental design in which different concentrations of dietary Ca are crossed with different levels of PhytM (e.g. Adeola et al., Reference Adeola, Olukosi, Jendza, Dilger and Bedford2006; Narcy et al., Reference Narcy, Létourneau-Montminy, Bouzouagh, Même, Magnin and Dourmad2010; Létourneau-Montminy et al., Reference Létourneau-Montminy, Narcy, Magnin, Sauvant, Bernier, Pomar and Jondreville2010b). In high-Ca diets, the unabsorbed dietary Ca would interact with P in the chyme to form insoluble salts, resulting in reduced absorption of dietary P (Heaney and Nordin, Reference Heaney and Nordin2002).
It also appears that P availability for absorption in the digesta could depend on factors related to the animal. Indeed, the model reveals that pigs of higher BW had higher digestible P (P < 0.01). For 30- and 60-kg pigs fed the same diet, digestible P differed by 0.17 g. This difference could be related to an influence of digestive tract development or physiology on P absorption capacity (Kidder and Manners, Reference Kidder and Manners1978; Laplace et al., Reference Laplace, Aumaitre and Rerat2001).
Comparison between digestible and retained phosphorus responses
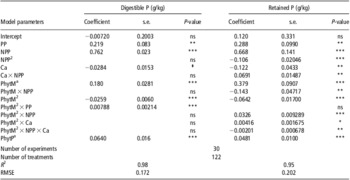
The aim of this particular analysis was to compare the responses of digestible and retained P to the dietary components studied. The digestibility of PP is similar to that found in the previous database (22% v. 21%, P < 0.05), which is also true for NPP digestibility (Table 3).
Responses of digestible P (g/kg) and retained P (g/kg) to variations in PP (g/kg), NPP (g/kg), PhytM (FTU/kg), PhytP (FTU/kg) and Ca (g/kg) in a specific database where they were both measured within each treatment

P = phosphorus; PP = phytate P; NPP = non-phytate P; PhytM = microbial phytase; PhytP = plant phytase; Ca = calcium; R 2 = coefficient of determination; RMSE = root mean square error.
aPhytM and PhytP are expressed in 100 FTU/kg diet; FTU, phytase unit.
‡ P < 0.10; *P < 0.05; **P < 0.01; ***P < 0.001.
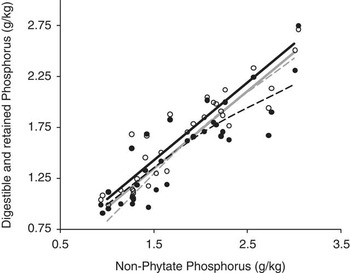
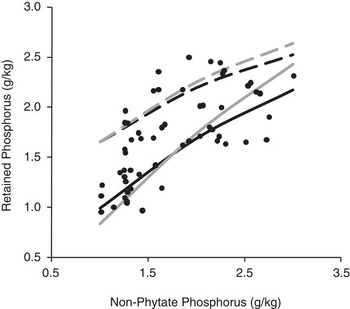
The responses of retained P to dietary NPP concentration differ from the one of digestible. Whereas digestible P increases linearly (P < 0.001) with increasing dietary NPP concentration, retained P evolves both linearly and quadratically (P < 0.001; Figure 1).
Responses of digestible phosphorus (P, g/kg) and retained P (g/kg) to dietary concentrations of non-phytate P (NPP, g/kg) and calcium (Ca, g/kg) with phytate P (PP) = 2.2 g/kg, microbial phytase (PhytM) = 0 FTU/kg and plant phytase (PhytP) = 0 FTU/kg. The solid and dotted lines represent digestible and retained P, respectively. The black and gray lines represent diets containing 5 and 8 g Ca/kg diet, respectively. The black and the white points represent retained and digestible P, respectively. Digestible P = −0.007 + 0.219 × PP + 0.762 × NPP − 0.028 × Ca + 0.180 × PhytM − 0.026 × PhytM2 + 0.008 × PhytM2 × PP + 0.064 × PhytP. Retained P = 0.120 + 0.288 × PP + 0.668 × NPP − 0.106 × NPP2 − 0.122 × Ca + 0.069 × Ca × NPP + 0.379 × PhytM − 0.143 × NPP × PhytM − 0.064 × PhytM2 + 0.032 × PhytM2 × NPP + 0.004 × PhytM2 × Ca − 0.002 × PhytM2 × NPP × Ca + 0.048 × PhytP.

The quadratic response of retained P to NPP is consistent with bone response to dietary P, which is known to reach a plateau with increasing dietary P in growing pigs if Ca is not limiting (Maxson and Mahan, Reference Maxson and Mahan1983).
The responses of digestible and retained P to dietary Ca concentration also differ. Any increase in dietary Ca concentration linearly depresses digestible P (P = 0.06) regardless of dietary P concentration. This negative effect still remains on retained P but is modulated as dietary NPP decreases (NPP × Ca, P < 0.01). For example, increasing the dietary Ca concentration from 5 to 8 g/kg decreases retained P by 0.16 g/kg in a diet containing 1 g NPP/kg, compared with an increase of 0.26 g/kg in a diet containing 3 g NPP/kg. This interaction between Ca and NPP on retained P was expected, given that this criterion reflects processes occurring in bone, where P and Ca combine in a ratio of ∼2.2 : 1 to form a hydroxyapatite-like (Ca10(PO4)6(OH)2) compound (Crenshaw, Reference Crenshaw2001).
The difference between digestible and retained P corresponds to urinary P losses. The current models show that increasing dietary NPP by 1 g/kg leads to 0.76 g digestible P. In a diet containing 5 g Ca/kg, 0.48 g of this 0.76 g digestible P will be retained, compared with 0.69 g for a diet containing 8 g Ca/kg. Thus, 37% and 9% of the digestible P will be lost in urine with diets containing 5 and 8 g Ca/kg, respectively, because of the lack of Ca (Pointillart and Fontaine, Reference Pointillart and Fontaine1983). In short, the current model for retained P shows that increasing dietary Ca will increase the amount of retained P as long as P and Ca are balanced or until bone tissue reaches a plateau.
Microbial phytase addition did not influence digestible and retained P in the same way. Although the response of both criteria increases quadratically (P < 0.001) with PhytM, the quadratic component depends on dietary PP (PhytM2 × PP, P < 0.001) for digestible P but on dietary NPP and Ca for retained P (PhytM2 × NPP × Ca, P < 0.01). The impact of PhytM on retained P decreases as NPP increases because of the quadratic response of retained P to NPP (Figure 2).
Response of retained phosphorus (P, g/kg) to dietary concentrations of non-phytate P (NPP, g/kg), calcium (Ca, g/kg) and microbial phytase (PhytM, FTU/kg) with phytate P (PP) = 2.2 g/kg and plant phytase (PhytP) = 0 FTU/kg. The solid and dotted lines represent 0 and 500 FTU PhytM/kg, respectively. The black and gray lines represent diets containing 5 and 8 g Ca/kg diet, respectively. FTU, phytase unit. Retained P = 0.120 + 0.288 × PP + 0.668 × NPP − 0.106 × NPP2 − 0.122 × Ca + 0.069 × Ca × NPP + 0.379 × PhytM − 0.143 × NPP × PhytM − 0.064 × PhytM2 + 0.032 × PhytM2 × NPP + 0.004 × PhytM2 × Ca − 0.002 × PhytM2 × NPP × Ca + 0.048 × PhytP.

For example, the addition of 500 FTU PhytM/kg increases retained P by 0.58 and 0.64 g/kg in low-P diets (1.5 g NPP/kg) containing 5 and 8 g Ca/kg, respectively, compared with 0.35 and 0.26 g/kg in high-P diets (3 g NPP/kg).
Results obtained for digestible and retained P deserve particular attention. Indeed, they clearly confirm the positive effect of phytase on P digestive utilization, and in turn its role in reducing excretion of P in feces. However, they highlight the possible consecutive loss of P in urine if dietary Ca provision is too low. In other words, an insufficient dietary Ca provision may reduce the effect of phytase on P excretion by pigs.
Comparison between digestible phosphorus and growth performance responses
The aim of this particular analysis was to compare the responses of digestible P and growth performance with the dietary components studied. The digestibility of PP is similar to the results obtained in the two previous databases, whereas the digestibility of NPP is slightly higher (85%; Table 4).
Responses of digestible P (g/kg), ADG (g/day) and ADFI (g/day) to variations in PP (g/kg), NPP (g/kg), PhytM (FTU/kg), PhytP (FTU/kg) and Ca (g/kg) in a specific database where they were both measured within each treatment

P = phosphorus; ADG = average daily gain; ADFI = average daily feed intake; PP = phytate P; NPP = non-phytate P; PhytM = microbial phytase; PhytP = plant phytase; Ca = calcium; R 2 = coefficient of determination; RMSE = root mean square error.
aPhytM is expressed in 100 FTU/kg diet; FTU, phytase unit.
‡ P < 0.10; *P < 0.05; **P < 0.01; ***P < 0.001.
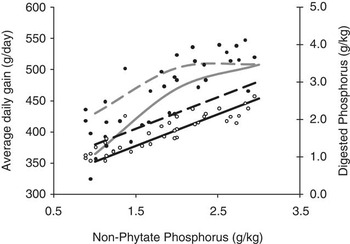
The response of digestible P to dietary NPP is linear (P < 0.001), in contrast to the curvilinear responses (P < 0.001) of ADG and ADFI, as previously reported in growing pigs (Reinhart and Mahan, Reference Reinhart and Mahan1986; Ekpe et al., Reference Ekpe, Zijlstra and Patience2002). The fitted models for growth performance confirm the deleterious effect of P deficiency on ADG and ADFI. In pigs, P deficiency was reported to result in loss of appetite and subnormal growth (Underwood and Suttle, Reference Underwood and Suttle2001). Increasing dietary Ca linearly decreases digestible P (P < 0.05), as observed in the previous analysis, regardless of dietary P provision. In contrast, ADG and ADFI decrease linearly with increasing dietary Ca (P < 0.001 and P < 0.01, respectively), but the magnitude of the effect of Ca depends on the dietary concentration of NPP (Ca × NPP, P < 0.05 and P < 0.01, respectively). For example, increasing dietary Ca from 5 to 8 g/kg reduces digestible P, ADG and ADFI by 0.12 g/kg, 53 g/day and 59 g/day, respectively, in a diet containing 1.5 g NPP/kg. These reductions are estimated to, respectively, 0.12 g/kg, 18 g/day and 1.5 g/day in a diet containing 3.0 g NPP/kg. Thus, the current models confirm that a high dietary Ca concentration can adversely affect pig growth performance, and this problem is exacerbated when low dietary P levels are provided, as previously demonstrated by Reinhart and Mahan (Reference Reinhart and Mahan1986).
The current models clearly illustrate the positive effect of PhytM on P utilization through the improvement of digestible P and of growth performance, as previously reviewed by Selle and Ravindran (Reference Selle and Ravindran2008). However, the extent of the response to PhytM increases the most when dietary PP is high for digestible P (PP × PhytM2, P < 0.001) and when dietary NPP is low for ADG and ADFI (PhytM × NPP, P < 0.01 and P < 0.05, respectively; PhytM2 × NPP, P = 0.05 and P = 0.08, respectively; Figure 3).
Responses of digestible phosphorus (P, g/kg) and average daily gain (ADG, g/day) to dietary concentrations of non-phytate P (NPP, g/kg) and microbial phytase (PhytM, FTU/kg) with phytate P (PP) = 2.2 g/kg, plant phytase (PhytP) = 0 FTU/kg and calcium (Ca) = 6.0 g/kg. The black and gray lines represent digestible P and ADG, respectively. The solid and dotted lines represent 0 and 500 FTU PhytM/kg, respectively. FTU, phytase unit. The black and the white points represent ADG and digestible P, respectively. Digestible P = − 0.304 + 0.252 × PP + 0.846 × NPP − 0.041 × Ca + 0.141 × PhytM − 0.011 × PhytM2 + 0.002 × PhytM2 × PP. ADG = 366 + 160 × NPP − 33.5 × NPP2 − 29.0 × Ca + 7.62 × Ca × NPP + 25.1 × PhytM − 8.99 × PhytM × NPP − 1.11 × PhytM2 + 0.506 × PhytM2 × NPP.

The lower effect of PhytM on ADG and ADFI with increasing NPP results from the curvilinear responses of these criteria to NPP. For example, the addition of 500 FTU PhytM/kg increases ADG by 49 and 0.54 g/day in diets containing 1.5 and 3.0 g NPP/kg, respectively. This finding indicates that the response of growth performance to phytase increases as P deficiency is aggravated, as previously observed in broilers (Driver et al., Reference Driver, Pesti, Bakalli and Edwards2005; Létourneau-Montminy et al., Reference Létourneau-Montminy, Narcy, Lescoat, Bernier, Magnin, Pomar, Nys, Sauvant and Jondreville2010a). It is worthy to note that the change in growth performance response to dietary PhytM supply for different dietary NPP concentrations highlights the risk of biased response when assessing PhytM equivalencies by means of these indicators. This holds true especially in case of severe P deficiency for which equivalency values may be overestimated, which is the case for most studies compiled in the current database.
General discussion and conclusions
Unfortunately, the number of publications that included all the criteria studied in this meta-analysis was too low to allow a comparison between them. However, some elements of comparison can be examined based on the previous analysis.
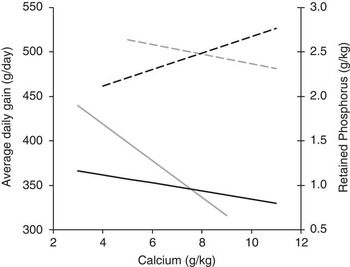
First, the responses of the studied criteria to dietary NPP and Ca differ. Digestible P depends on the dietary concentrations of both NPP and Ca without interaction between these variables. Moreover, increasing dietary Ca negatively affects both retained P and growth performance in low-NPP diets but increases retained P and does not influence growth performance in high-NPP diets (Figure 4).
Responses of retained phosphorus (P, g/kg) and average daily gain (ADG, g/day) to dietary concentrations of non-phytate P (NPP, g/kg) and calcium (Ca, g/kg) with phytate P (PP) = 2.2 g/kg, microbial phytase (PhytM) = 0 FTU/kg and plant phytase (PhytP) = 0 FTU/kg. The black and gray lines represent retained P and ADG, respectively. The solid and dotted lines represent 1.1 and 2.1 g NPP/kg, respectively. Retained P = 0.120 + 0.288 × PP + 0.668 × NPP − 0.106 × NPP2 − 0.122 × Ca + 0.069 × Ca × NPP + 0.379 × PhytM − 0.143 × NPP × PhytM − 0.064 × PhytM2 + 0.032 × PhytM2 × NPP + 0.004 × PhytM2 × Ca − 0.002 × PhytM2 × NPP × Ca + 0.048 × PhytP. ADG = 366 + 160 × NPP − 33.5 × NPP2 − 29.0 × Ca + 7.62 × Ca × NPP + 25.1 × PhytM − 8.99 × PhytM × NPP − 1.11 × PhytM2 + 0.506 × PhytM2 × NPP.

This discrepancy in responses is easily explained by the concentrations of Ca and P throughout the pig's body. Within the body, 96% to 99% of Ca and about 70% to 80% of P is fixed together in the skeletal tissue in the form of hydroxyapatite. The remaining P is contained in soft tissue, where the two elements have little or no common function. This illustrates the specific requirements of Ca and P for bone mineralization, whereas soft tissue development is dependent mainly on P.
As previously shown (Narcy et al., Reference Narcy, Létourneau-Montminy, Bouzouagh, Même, Magnin and Dourmad2010; Létourneau-Montminy et al., Reference Létourneau-Montminy, Narcy, Magnin, Sauvant, Bernier, Pomar and Jondreville2010b), although reducing dietary Ca may promote growth performance, such a reduction must be carried out with care. That is especially true in phytase-supplemented diets, given that Ca reduction could in turn limit bone mineralization. Moreover, the beneficial environmental impact of reduced NPP provision may be challenged by extra losses of P in urine, when dietary Ca is lacking for P deposition in bones.
The pig's response to P depends on both the response criterion and the dietary components. The present meta-analysis focused only on a fungal phytase for which a lot of P digestibility data were available in the literature. This offered the possibility of testing multiple interactions with other components of the diet. Nevertheless, more digestibility data are still needed for the other phytases currently used on the market to perform powerful analyses and to precise their interactions. The conditions in which P sources, including phytases, are evaluated need to be standardized. A multi-criteria approach with an adequate compromise between digestible P, retained P, bone mineralization and growth performance should be promoted for the formulation of new recommendations regarding P, Ca and phytases provision in pig feeding. The success of such an approach depends on precise knowledge and modeling of P utilization (Létourneau-Montminy et al., Reference Létourneau-Montminy, Narcy, Lescoat, Magnin, Bernier, Sauvant, Jondreville and Pomar2011) so that more robust tools for dietary P and Ca formulation for growing pigs can be developed.