Introduction
The permanent challenge in animal production is the development of new profitable systems, while meeting beef consumer requirements.
Bull beef production is typically based on expensive high-concentrate diets fed over prolonged finishing periods. However, feed costs are a major proportion of the total costs in most cattle production systems, and since grazed grass is a cheaper feedstuff than concentrates in temperate climates (Finneran et al., Reference Finneran, Crosson, O’Kiely, Shalloo, Forristal and Wallace2011), there is interest in including a grazing period in bull systems to decrease the cost of production. In this regard, recent research on suckler bull production systems has investigated the feasibility of exploiting compensatory growth by incorporating a grazing period before finishing indoors (O’Riordan et al., Reference O’Riordan, McGee, Moloney and Crosson2012).
Meat quality is influenced by multiple interacting factors including animal growth path and diet, and hence any change in the production system should be careful analysed. Therefore, the aim of the present study was to evaluate the influence of different winter growth rates (WGR) followed by different levels of supplementation at pasture on selected meat quality characteristics of spring-born suckler bulls slaughtered at 19 months of age.
Material and methods
In total, 90 spring-born ca. 8 months old, late-maturing breed suckler bulls (369 kg live weight, SD 27.3 kg) were assigned to a two different WGR×three different pasture supplementation levels design, balanced for sire, breed, birth date and initial weight. During the first winter (127 days), bulls were offered grass silage (GS) ad libitum (dry matter (DM) digestibility 688 g/kg) and either 3 kg (WGR3) or 6 kg (WGR6) of a barley-based concentrate (862 g/kg rolled barley, 60 g/kg soya bean meal, 50 g/kg molasses and 28 g/kg minerals–vitamins) daily. At the end of the winter period, all animals were turned out to pasture and rotationally grazed (six 2.3 ha paddocks/treatment). Pasture bulls were assigned to one of three supplementation rates (n=15): grass without supplementation (PO), grass plus 0.2 DM intake as concentrates (PL ~2.7 kg fresh weight) or grass plus 0.4 predicted DM intake as concentrates (PH ~5.3 kg fresh weight). At the end of this period (98 days), all bulls were housed for the finishing period (76 days) and gradually adapted to an ad libitum barley-based concentrates plus GS (DM digestibility 677 g/kg) diet. All animals were slaughtered immediately after arrival at the slaughter plant by bolt stunning followed by exsanguination at an average age of ~19 months. The slaughter and dressing procedures were in accordance with EU regulations.
After ~48 h in the chill at 0°C, longissimus thoracis (LT) colour (5th/6th rib interface, 1 h after cutting and exposure to oxygen) was measured with a portable spectrophotometer (Miniscan EZ portable spectrophotometer; HunterLab, Reston, VA, USA) using Hunter values. The LT was then removed, and cut into 2.5-cm thick steaks. The sample for proximate analysis was frozen immediately, and the samples for sensory evaluation, cook loss and Warner–Bratzler shear force (WBSF) analysis were frozen after 12 days of additional ageing. Just before analysis, all steaks were thawed in a water bath at 20°C, and trimmed of external fat and connective tissue.
The sample for chemical composition was blended (R101, Robot Coupe SA, France) and intramuscular fat and moisture contents were determined using SMARTrac (CEM Corporation, Matthews, NC, USA). Protein was determined by the method of Sweeney and Rexroad (Reference Sweeney and Rexroad1986) using a LECO protein analyser (Model FP-428; Leco Corporation, St. Joseph, MI, USA).
The WBSF sample was used also for cook loss determination. Briefly, after excess moisture was removed, the weights of the steaks were recorded and conditioned for 15 min at 20°C. The steaks were cooked in vacuum pack bags to an internal temperature of 70°C, by immersing in a water bath (Model Y38; Grant Instruments Ltd, Cambridgeshire, UK) at 72°C. The internal temperature of the steaks was measured using a Hanna Foodcare digital thermometer (Model HI 9041; Hanna Instruments Ltd, Bedfordshire, UK). After cooking, all the juices were poured out of bag and the steaks were left to cool. The percentage cook loss was determined by the following formula=[(raw weight of steak−cooked weight of steak)/(raw weight of steak)×100] Finally, WBSF was measured according to the procedure of Shackelford et al. (Reference Shackelford, Koohmaraie, Cundiff, Gregory, Rohrer and Savell1994) using an Instron Universal testing machine equipped with a Warner–Bratzler shearing device.
Sensory analysis was performed by a 10 member, in-house trained panel on steaks grilled to an internal temperature of 70°C, according to American Meat Science Association (1995). Panellists were asked to assess the samples for the following attributes: tenderness (scale 1 to 8; 1=extremely tough, 8=extremely tender), firmness (scale 1 to 8; 1=very mushy, 8=very firm), overall flavour, overall texture (scale 1 to 8; 1=very poor, 8=very good) and overall acceptability (scale 1 to 8; 1=not acceptable, 8=extremely acceptable).
All data were analysed using a mixed GLM (ANOVA) with the GLIMMIX procedure of SAS (SAS Institute Inc., Cary, NC, USA). The statistical model included slaughter day, breed, WGR and pasture supplementation level as fixed effects. A Tukey post hoc test was used to determine differences between means. Multivariate analyses were performed using the partial least square regression (PLSR) tool of UNSCRAMBLER. Briefly the Y-matrix was designed as dummy variables (where 0 indicates that the samples did not belong to the analysed category and 1 indicates that the sample belonged to the analysed category) for the different treatments (3-PO, 3-PL, 3-PH, 6-PO, 6-PL and 6-PH). The matrix of dummy variables allows the transformation of treatments from a categorical variable to a numerical variable. The X-matrix was constituted by the individual results of all the meat quality and performance parameters analysed, all the X-matrix variables were weighted by dividing them with their own standard deviations. This allows all variables to contribute to the model, regardless of whether they have a small or large standard deviation from the outset (Martens and Martens, Reference Martens and Martens2001).
Results and discussion
No interaction (P>0.05) between WGR and pasture supplementation was found for animal performance variables.
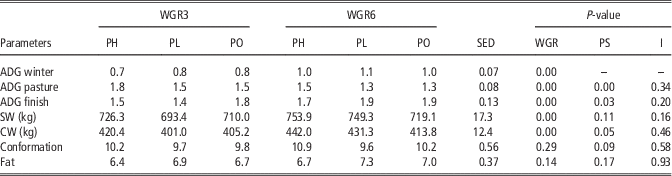
WGR6 bulls had heavier slaughter and carcass weight (CW) than WGR3 bulls (P<0.05). No differences were found due to pasture supplementation. The average daily weight gain (ADG) during each period (winter, pasture and finishing) was affected by both WGR and pasture supplementation independently (P<0.05). However, no treatment differences were found for carcass conformation and fat scores (Table 1).
Effect of winter concentrate level and supplementation at pasture on bull performance

Data from McMenamin et al. (Reference McMenamin, Marren, McGee, Moloney, Kelly and O’Riordan2014).
WGR3=grass silage ad libitum plus 3 kg of a commercial concentrate; WGR6=grass silage ad libitum plus 6 kg of a commercial concentrate; PH=grass plus 0.4 predicted dry matter intake (DMI) as concentrates; PL=grass plus 0.2 predicted DMI as concentrates; PO=grass without supplementation; WGR=winter growth rate; PS=pasture supplementation; I=interaction between WGR×PS; ADG=average daily weight gain (kg/day); SW=slaughter weight; CW=carcass weight; Conformation=carcass conformation score (1 to 15); Fat=carcass fat score (1 to 15).
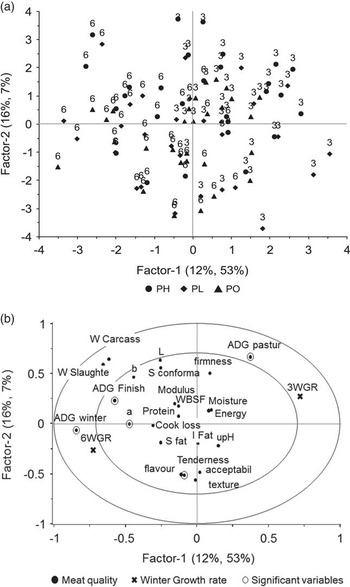
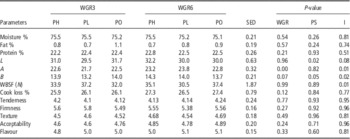
In relation to eating quality, the chemical composition of the LT was similar for all treatment groups (Table 2). For colour, the main differences found were: higher lightness (L) in PH compared with PO and PL, an interaction between WGR and pasture supplementation for redness (a), such that within WGR3, redness was lower (P<0.05) for PL compared with PO and PH which did not differ, whereas within WGR6, redness was lower (P<0.05) for PO compared with PH and PL, which did not differ (Table 2). Higher a and b values have been previously related with higher growth rate in intensive productions systems, whereas higher slaughter weight has been related with increased redness of LT muscle (Vestergaard et al., Reference Vestergaard, Oksbjerg and Henckel2000). In the present work, a (or redness) was positively correlated (P<0.05) with the higher WGR6 (Figure 1b). The lack of difference in intramuscular fat suggests that these differences in colour may reflect a specific muscular fibre profile for each growth path (Pette and Staron, Reference Pette and Staron2000). Nevertheless, those differences in appearance in fresh beef are not marked enough to affect meat acceptability, further analyses must be done in order to fully understand how these changes in fresh colour may affect the shelf life of the meat.
Partial least square using only WGR treatments (a) scores plot (b) correlation loadings plot. WGR=winter growth rate=grass silage ad libitum and either 3 kg (WGR3) or 6 kg (WGR6) of a commercial concentrate; PO=grass without supplementation, PL=grass plus 0.2 predicted dry matter intake (DMI) as concentrates; PH=grass plus 0.4 predicted DMI as concentrates; W=weight; S conform=conformation scores; S fat=fat scores; ADG=average daily gain; WBSF=Warner–Bratzler shear force values; I Fat=intramuscular fat; Modulus=modulus of deformability (Mpa) calculated as the slope in the 20% to 80% segment of the total WBSF peak, mainly related to the sample elasticity; Energy=total energy (J), the total peak area of WBSF, it is related to the total energy used to chew the meat until it can be swallowed.

Effect of winter concentrate level and supplementation at pasture on longissimus thoracis eating quality of bulls

WGR3=grass silage ad libitum plus 3 kg of a commercial concentrate; WGR6=grass silage ad libitum plus 6 kg of a commercial concentrate; PH=grass plus 0.4 predicted dry matter intake (DMI) as concentrates; PL=grass plus 0.2 predicted DMI as concentrates; PO=grass without supplementation; WGR=winter growth rate; PS=pasture supplementation; I=interaction between WGR×PS; ADG=average daily weight gain (kg/day); SW=slaughter weight; CW=carcass weight; Conformation=carcass conformation score (1 to 15); Fat=carcass fat score (1 to 15).
Tenderness, firmness, overall flavour, overall texture and overall acceptability (scale 1 to 8).
There was an interaction (P<0.05) between WGR and pasture supplementation for WBSF values Within WGR3, WBSF was lower and hence the meat more tender (P<0.05) for PO compared with PL and PH which did not differ, whereas within WGR6, WBSF values indicated higher tenderness (P<0.05) for PL compared with PH and PO which did not differ (Table 2). These differences are likely due to the effect of the different growth rates between groups in different stages (winter, pasture and finishing) (Purslow, Reference Purslow2014). Explanation of these differences is complicated, as many factors contribute to meat toughness. However, it seems that groups with lower slaughter weight and CW (Table 1) within the same WGR (3PL and 6PO) had tougher meat. In addition, LT from 3PL and 6PO was less red (Table 2), indicating that a fibre component might be affecting the final texture.
Differences in instrumental texture (WBSF), however, were not detected by the sensory panel as overall texture or tenderness and WBSF values were poorly correlated (P>0.05) with the production system (Figure 1b).
The PLSR model was unable to classify the animals by pasture supplementation, but WGR was correctly classified in two clusters (Figure 1a). The ADG during winter and finishing period were positively correlated (P<0.001) with WGR6, whereas ADG during grazing was negatively correlated (P<0.005). For meat quality parameters, both redness (P=0.009) and acceptability (P=0.015) were positively correlated with WGR6 (Figure 1b).
Conclusions
Adapting bull beef production systems to regional habitats can provide additional resources for farmers to produce meat profitably while ensuring its quality. The differences detected in the present study are unlikely to be commercially important. Therefore, bull producers can choose the most profitable option from those examined without concern for beef quality
Acknowledgements
This project (11/SF/322, ‘BullBeef’) was funded by the Irish Department of Agriculture, Food and the Marine’s competitive research programmes. The authors acknowledge the assistance of staff at Teagasc Animal & Grassland Research and Innovation Centre, Grange. The assistance of staff and management at Kepak Group, Clonee, Co. Meath with sample collection and carcass measurement is greatly appreciated.