Introduction
Graphene oxide (GO) is the functionalized graphene sheet, which besides being the precursor for the graphene production show very interesting properties. It has certain band gap, which is absent in the pure graphene sheet, due to which it has great potential in the field of optical applications [Reference Maiti, Midya, Narayana and Ray1, Reference Ji, Min, Kim, Myung, Kang, Shin, Song, Heo, Lim, An, Lee and Lee2]. Graphene is a monolayer of two-dimensional carbon set in hexagonal structure [Reference Son, Cohen and Louie3]. It has drawn substantial attention due to its exceptional electrical and optical properties. Due to graphene’s unique properties, it is used in electrochemical devices [Reference Lee, Bong, Ha, Kwak, Park and Piao4], transparent electrodes [Reference Song, Fang, Brenes and Kong5], novel nanocomposites [Reference Mensah, Kumar, Lim, Kim, Jeong and Nah6], field-effect transistors [Reference Novoselov, Geim, Morozov, Jiang, Zhang, Dubonos, Grigorieva and Firsov7], ultrasensitive sensors [Reference Zhu, Krishna Ghatkesar, Zhang and Janssen8], etc. Graphene has been known to be synthesized by chemical vapor deposition [Reference Reina, Jia, Ho, Nezich, Son, Bulovic, Dresselhaus and Kong9], mechanical exfoliation [Reference Wahab, Ali and Abdul10], electrochemical exfoliation [Reference Karthika11], solvothermal synthesis [Reference Liu, Chu, Dong, Zhang, Sun and Shen12], and reduction of GO [Reference Storm, Overgaard, Younesi, Reeler, Vosch, Nielsen, Edstro¨m and Norby13]. Benjamin Brodie was the first person who synthesized GO in 1859. GO is assumed to be the out-of-order analogue of the extremely conducting crystalline graphene. Graphene has engrossed the curiosity of physicists due to its exceptional electronic structure with linearly dispersed Dirac electrons. The insulating and flawed characteristics of GO do not permit the observation of elementary two-dimensional condensed matter effects. However, chemists and material scientists are interested to study this material due to its varied chemical and electronic structures, in conjunction with the very fact that it is dissolvable in solution. The accessibility of different forms of functional groups containing oxygen in the basal plane and the sheet edges permits the GO to interact with extensive variety of organic and inorganic materials and may form non-covalent, covalent and ionic bond, so purposeful hybrids and composites with uncommon properties may be fabricated. Furthermore, GO is an electronic material that amalgamates both the features of large energy gap between the σ-states of its sp 3-bonded carbons and conducting π-states from sp 2 carbon sites. The tunability of the quantitative relation of the sp 2 associated sp 3 fractions by reduction chemistry facilitates the tuning of its band gap and thus controllably converts GO from an insulator to a semiconductor and to a graphene-like semi-metal. Although chemical and thermal reduction can be used to reduce GO to realize graphene-like properties, residual defects, such as remnant oxygen atoms, Stone–Wales defects, and holes due to loss of carbon from the basal plane, restrain the electronic quality usually described by carrier quality of reduced graphene oxide (rGO) compared with its mechanically cleaved counterpart. The interest of researchers and chemists from varied research fields has progressively transferred from use of GO as the precursor for graphene to its own characteristics and capacities at industrial scale of applications commencing from plastic physics, optical materials, and biosensors to solar cells. It represents a brand new form of solution-processable and non-stoichiometric supermolecule, which will enhance the properties of several organic and inorganic materials. All researchers are exploring different facets of graphene and associated materials. From basic science to electronics, energy generation and storage to health and medicine, our research encompasses all that is graphene. The principal mission is to take technologies based on graphene from the laboratory to commercial applications. However, a full-scale use of graphene in marketable products will take several more years, which implies that there is still time for researchers to guarantee a chief part in this existing technological transformation, in a market that is expected to exceed. The chemical route gives a simple and cost-effective way of producing high-yield functional graphene. In the chemical route, GO is an intermediate product before the oxygen functional groups are removed chemically, thermally, or by some other mode to acquire graphene. GO and rGO properties are fascinating from an exploration point of view and have the potential for improvement for new applications. A careful comprehension of pure graphene and functionalized graphene semiconductor properties will enable their enhanced application in semiconductor and hardware devices, biosensors, and synthetic sensors. The manufacture of semiconductor devices considering a blend of customary semi-materials, for example, silicon and new graphene materials, are being tested, and achievement in this field will be important for creating cutting-edge semiconductor devices. GO usually shows p-type behavior and attachment of it with n-Si forms the p–n junction that can be exploited for the photovoltaic cell purposes. French researcher Edmond Becquerel first found the photovoltaic effect in 1839. In photovoltaics, the irradiation with light creates a difference in potential at the junction of two different materials. The ferroelectric materials also show photovoltaic effect but that are based on strength of electric polarization of the bulk [Reference Dubovik, Fridkin and Dimos14]. However, GO does not show the bulk photovoltaic effect. Therefore, in the present case, we are interested in p–n junction-based photovoltaic. GO band gap can be tuned by reduction process. Therefore, its conductivity can be varied from dielectric to semiconductor. Different processes, such as thermal reduction [Reference Schniepp, Li, McAllister, Sai, Herrera-Alonson, Adamson, Prud’homme, Car, Seville and Aksay15], chemical reduction [Reference Chua and Pumera16], electrochemical reduction [Reference Stankovich, Dikin, Piner, Kohlhaas, Kleinhammes, Jia, Wu, Nguyen and Ruoff17], and voltage/current-induced reduction [Reference Yao, Chen, Jiang, Zhao, Zhu and Zhou18], can be used to attain reduction of GO. Voltage/current-induced reduction process is a less hazardous and environment-friendly technique. In the present work, GO-(n-Si), p–n junction-based photovoltaic cell was fabricated. The full oxidized GO acts as an insulator and its conductivity can be increased by reduction process [Reference Eda, Mattevi, Yamaguchi, Kim and Chhowalla19]. The reduction of GO was achieved by applying voltage bias on its surface, i.e., by using current-induced or voltage-induced reduction [Reference Yao, Chen, Jiang, Zhao, Zhu and Zhou18]. It has been observed that the photovoltaic current significantly increases on reduction of GO.
Results and discussion
X-ray diffraction
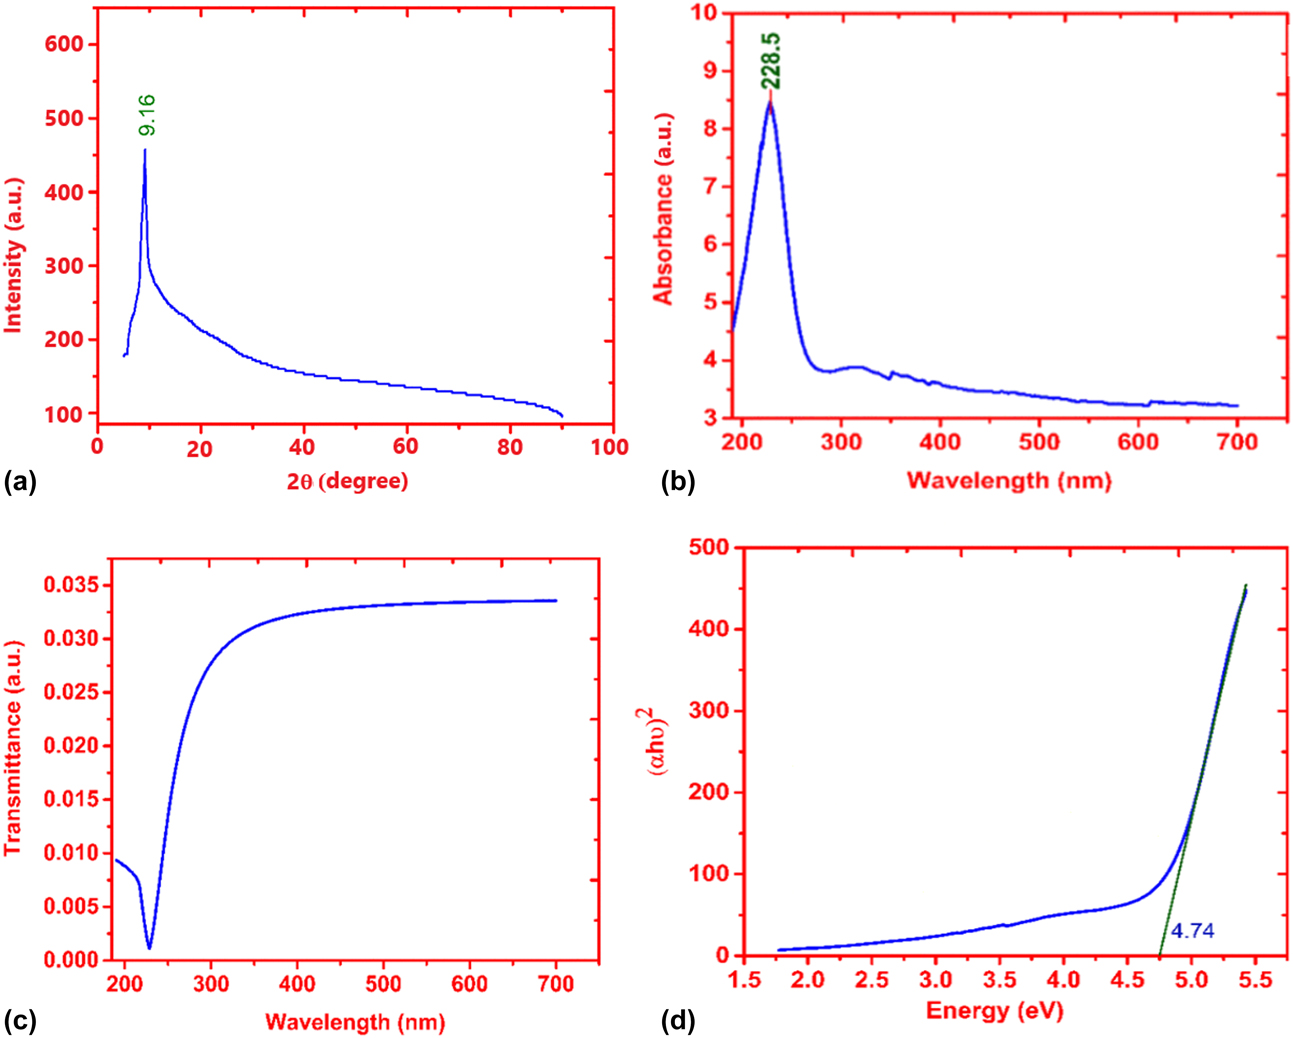
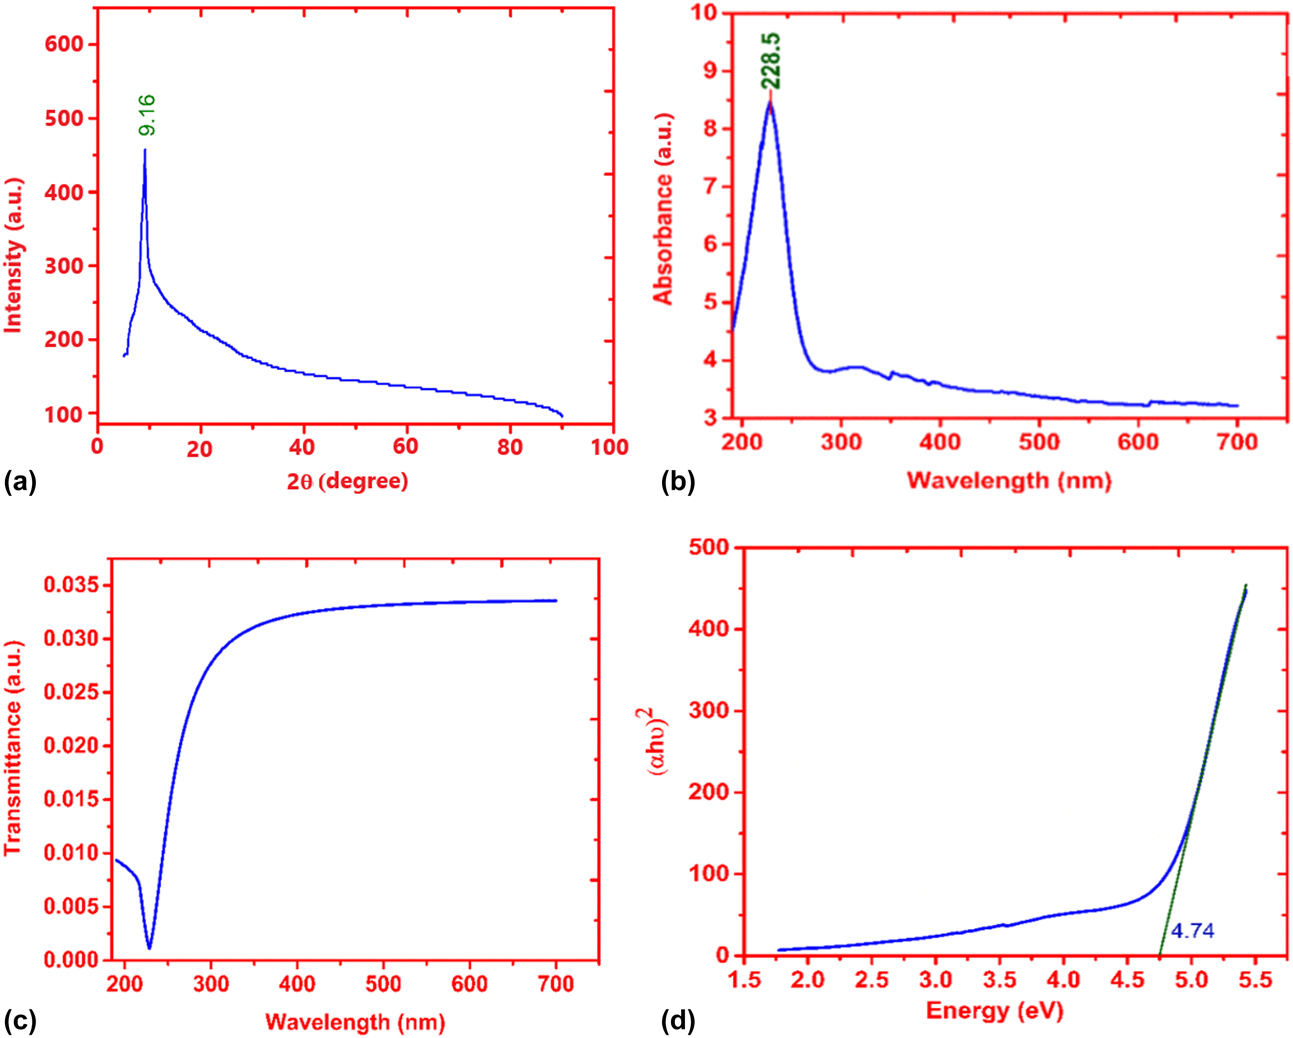
X-ray diffraction (XRD) is a useful technique to determine the crystal structure of a material. The oxidation of GO disrupts the sheets that increases its stacking order. The XRD peak for GO has been reported to lie between 7° and 12° [Reference Blanton and Majumdar20]. In the current work, the XRD pattern for GO displayed an intense single 2θ peak at 9.16°, shown in Fig. 1(a). This peak originated from (001) crystal plane [Reference Gupta, Sharma, Singh, Arif and Singh21] having an inter-planar separation of 0.964 nm, which has been calculated using Bragg’s law, affirming the formation of GO. Generally, a broader diffraction peak represents small crystallite size, while a sharp peak is obtained from large-size crystallites. The crystallite size of prepared GO was estimated using the Scherrer equation [Reference Arif, Sanger, Shkir, Singh and Katiyar22, Reference Arif, Monga, Sanger, Vilarinho and Singh23, Reference Arif, Khan, Gupta and Singh24]:
 $$\tau = {{K\lambda } \over {\beta \cos \theta }}\quad ,$$
where τ is average size of the ordered areas, K represents shape factor, which is taken to be 0.93 for spherical crystallites, β is the full width at half maximum (in radians), and λ is the Cu Kα line wavelength of source (1.5406 Å). In case of two-dimensional structure, like GO, the Scherrer equation estimates the average stacking height of the material. Once one knows the stacking height and interplanar separation, which can be calculated using Bragg’s law, the number of layers is equal to one plus the ratio of stacking height and interplanar separation [Reference Shahriary and Athawale25, Reference Andonovic, Grozdanov, Paunović and Dimitrov26]. So, using the Scherrer equation and Bragg’s law, the GO sample’s stacking height (approximately) and number of layer have been found to be 6.1 nm and seven (07), respectively.
(a) XRD diffraction of GO. (b) UV-Vis absorbance spectra of GO. (c) The transmittance spectra of GO. (d) The Tauc plot of GO.
Optical properties
The ultraviolet–visible (UV-Vis) spectra of the prepared GO showing an absorption peak at 228.5 nm are shown in Fig. 1(b). It is concluded that the π–π* transition dominates the GO optical absorption near 228.5 nm [Reference Luo, Lu, Somers and Johnson27]. The transmittance of GO can be estimated from absorbance using the following relation [Reference Arif, Sanger, Vilarinho and Singh28, Reference Shkir, Arif, Ganesh, Manthrammel, Singh, Yahia, Maidur, Shankaragouda and Alfaify29]:
 $$A = 2 - \log T\% \quad ,$$
 $$\log T\% = 2 - A\quad .$$
Transmittance,
 $$T = \exp \left( {2 - A} \right)\quad .$$
Figure 1(c) demonstrates the transmittance spectra of GO, which was computed using absorbance transmittance relation [Eq. (4)]. The nature and magnitude of optical band gap were assessed from the absorbance peak using Tauc’s relation [Reference Ganesh, Haritha, Anis, Shkir, Yahia, Singh and Alfaify30, Reference Chauhan and Sreenivas31].
 $$\alpha h\nu = A{\left( {h\nu - {E_{\rm{g}}}} \right)^n},$$
where α is the absorption coefficient, which is an inherent property of a material determining the distance traveled by a photon of certain energy before getting completely absorbed, hν is the incident photon energy, E g is the average band gap energy of the material, and n is determined by the type of transition and is equal to half (1/2) for direct band gap. Figure 1(d) represents the Tauc plot showing the fluctuation of (αℎν)2 as a function of hν with the straight-line curve indicating the direct transition [Reference Viezbicke, Patel, Davis and Birnie32]. Band gap energy of 4.74 eV was attained by extending the linear portion of the curve to the x-axis, as shown in Fig. 1(d).
Fourier transform infrared analysis
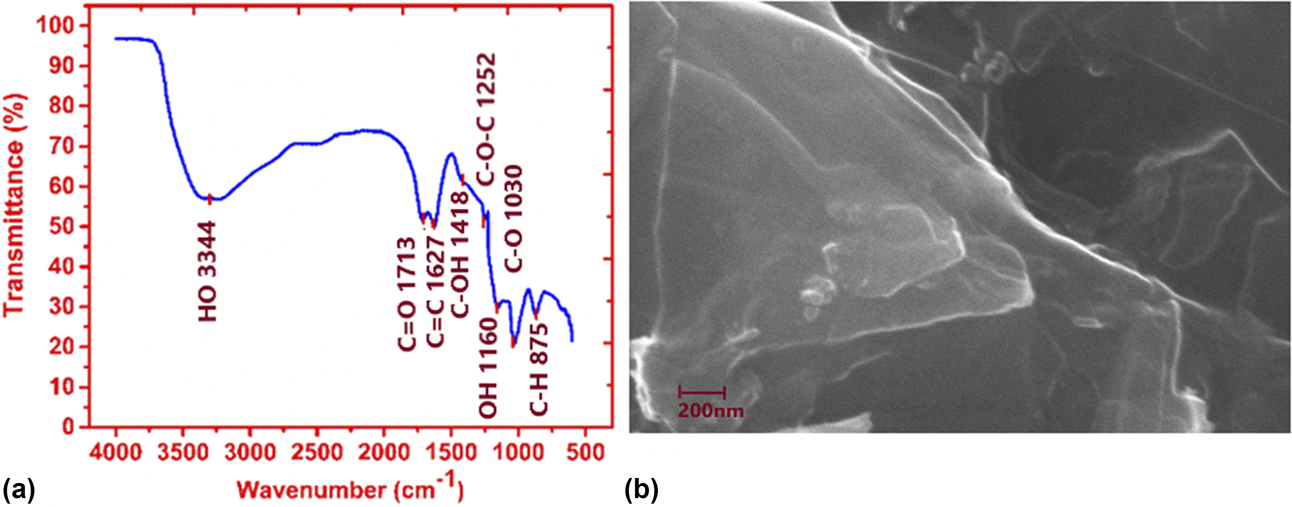
Fourier transform infrared (FTIR) spectroscopy is a useful analytical characterization technique for organic and, sometimes, inorganic materials. This technique involves measurement of the variation of the absorption of infrared radiation by the sample material as a function of wavelength. The presence of different functional group was confirmed by FTIR spectroscopy. The FTIR spectrum of GO, Fig. 2(a), illustrated the presence of C=O (1713 cm−1) due to COOH vibration, C=C (1627 cm−1) due to graphitic plane, C–OH (1418 cm−1) corresponding to hydroxyl group, C–O–C (1252 cm−1) due to ketone group, and C–O (1030 cm−1). The adsorption of water on the surface of GO resulted in a relatively broad peak at 3344 cm−1 [Reference Sudesh, Kumar, Das, Bernhard and Varma33]. Contrary to the hydrophobic graphite and graphene, GO is more hydrophilic in nature owing to the presence of all the functional groups.
(a) FTIR spectra of GO. (b) SEM image of GO shows the bending of the sheets.

Scanning electron microscopy analysis
The scanning electron microscopy (SEM) is a useful nondestructive technique for studying material’s surface morphology, chemical composition, crystal structure, and orientation. The secondary electrons lead to micrographs, which are used for the study of morphology and topography of the samples, while the back-scattered electrons give contrast micrographs used for study of composition of a multiphase sample. In the present work, the GO solution was dropped on a carbon tape and corresponding SEM images were recorded. Figure 2(b) shows the SEM micrographs of GO flakes and layers. SEM revealed that the prepared GO had a wavy, folded shape with layers like silk sheets that stacked on one another. The different layers can easily be seen in the SEM images [Reference Yamaguchi, Murakami, Eda, Fujita, Guan, Wang, Gong, Boisse, Miller, Acik, Cho, Chabal, Chen, Wakaya, Takai and Chhowalla34]. The dark region contains thick layers of GO, whereas bright region contains only one to few layers of GO. Individual sheets were observed that seemed to be closely associated with each other. These results suggested that the GO dispersion consisted thin layers of nanosheets.
Reduction and I–V characteristic of photovoltaic device
Voltage reduction of graphene oxide
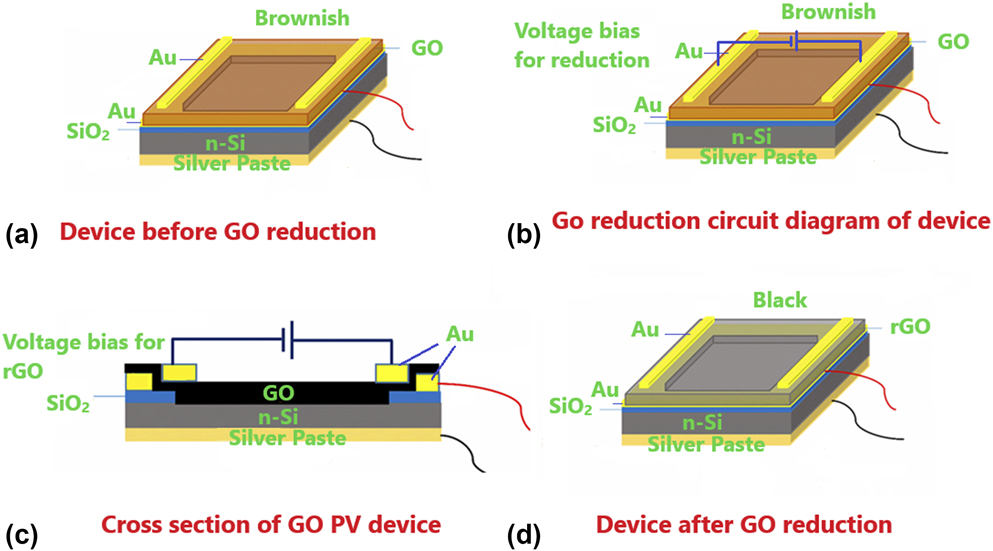
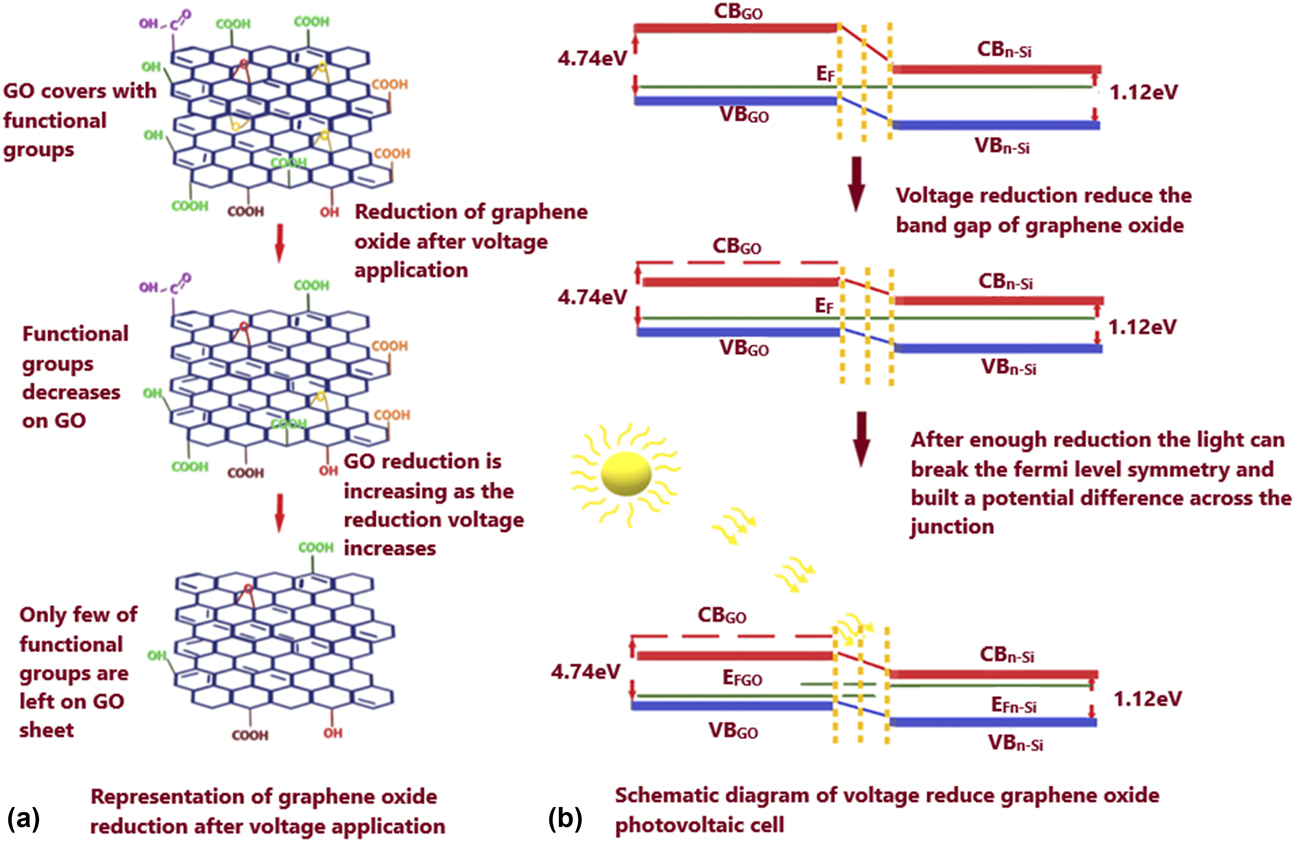
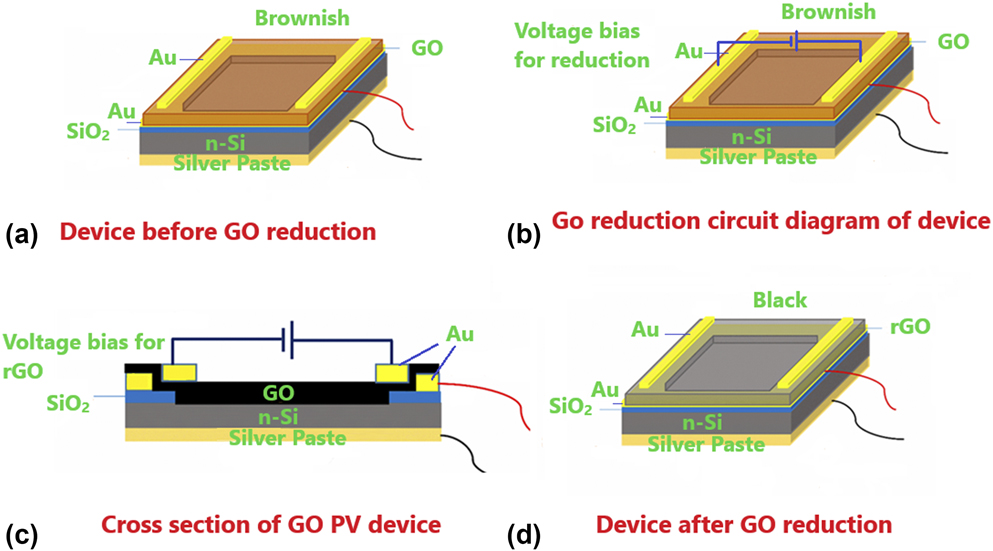
GO was reduced using the voltage reduction process. In this reduction method, an electric bias was applied between Au electrodes present on the either sides of the rectangular GO layer [Reference Mativetsky, Liscio, Treossi, Orgiu, Zanelli, Samorì and Palermo35]. Under an applied voltage, the water content of GO undergoes electrolysis and facilitates reduction through generation of hydrogen ions (H+) that react with oxygen groups, causing their release from the surface. The reduction process depends on humidity, film thickness, and the geometries of reducing electrodes. Figure 3(a) represents the schematic diagram of GO-n-Si photovoltaic cell. Figures 3(b)–3(d) display the pictorial representation of transition of GO to rGO on application of reduction voltage to the GO sheet. The GO film is reduced using 5, 10, and 15 V of electric voltage bias. Initially, the color of GO was brownish that turned to black after the reduction process [Reference Shen, Yan, Shi, Ma, Li and Ye36]. This reduction caused a noticeable increase in the current of the photovoltaic cell. Figure 4(a) represents the removal of functional groups after the application of voltage bias. The p–n junction-based photovoltaic work on the principle of shifting of p and n-type Fermi level on irradiation of the device’s junction. Figure 4(b) shows the variation in band gap after applying the reduction voltage bias and the change in Fermi level after light exposure.
(a) Schematic representation of GO-n-Si photovoltaic cell. (b) The GO-n-Si photovoltaic cell without any reduction. (c) The GO-n-Si photovoltaic cell with voltage bias applied for reduction of GO. (d) The GO-n-Si photovoltaic cell after reduction of GO.
(a) Representation of removal of functional groups after application of bias voltage. (b) Representation of variation in band gap after application of bias voltage and change in Fermi level after light exposure.

I–V characteristics of photovoltaic device
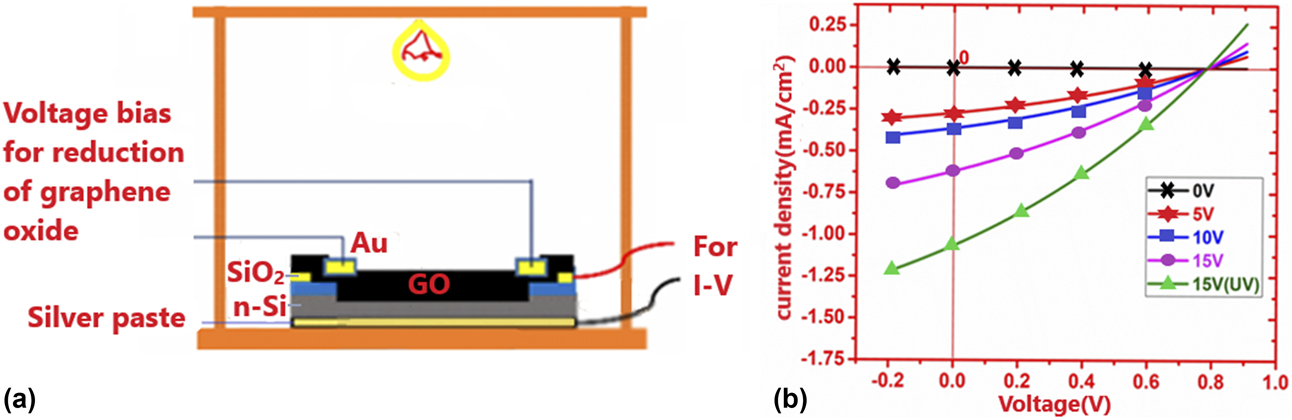
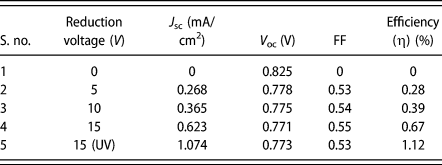
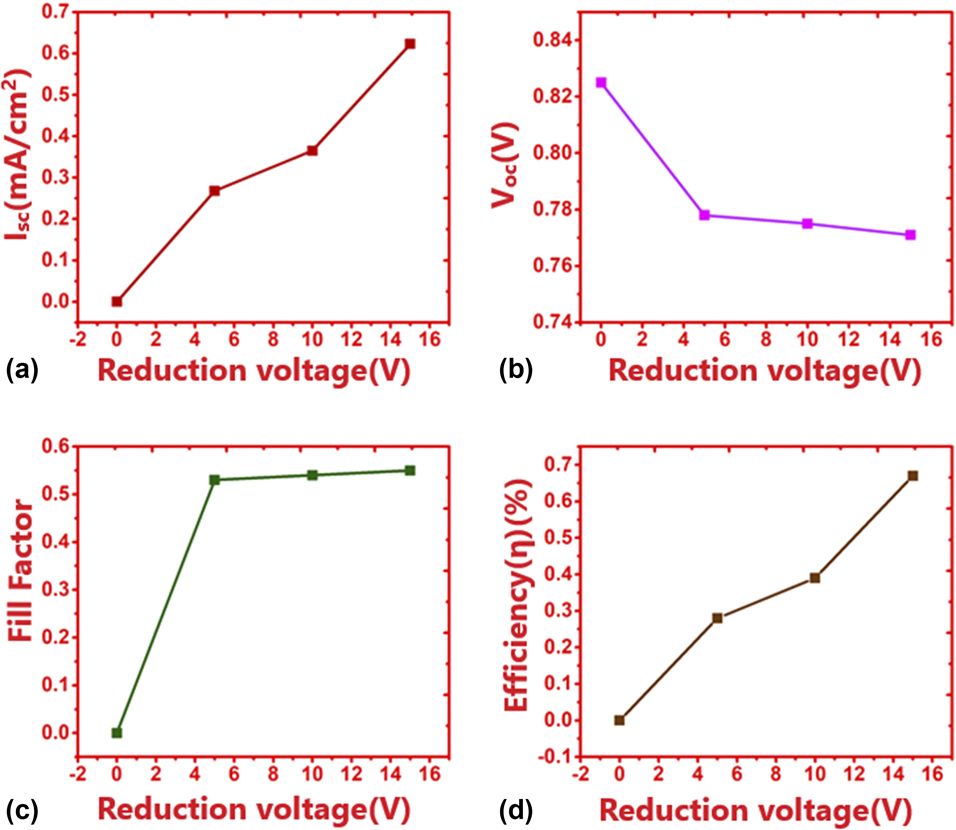
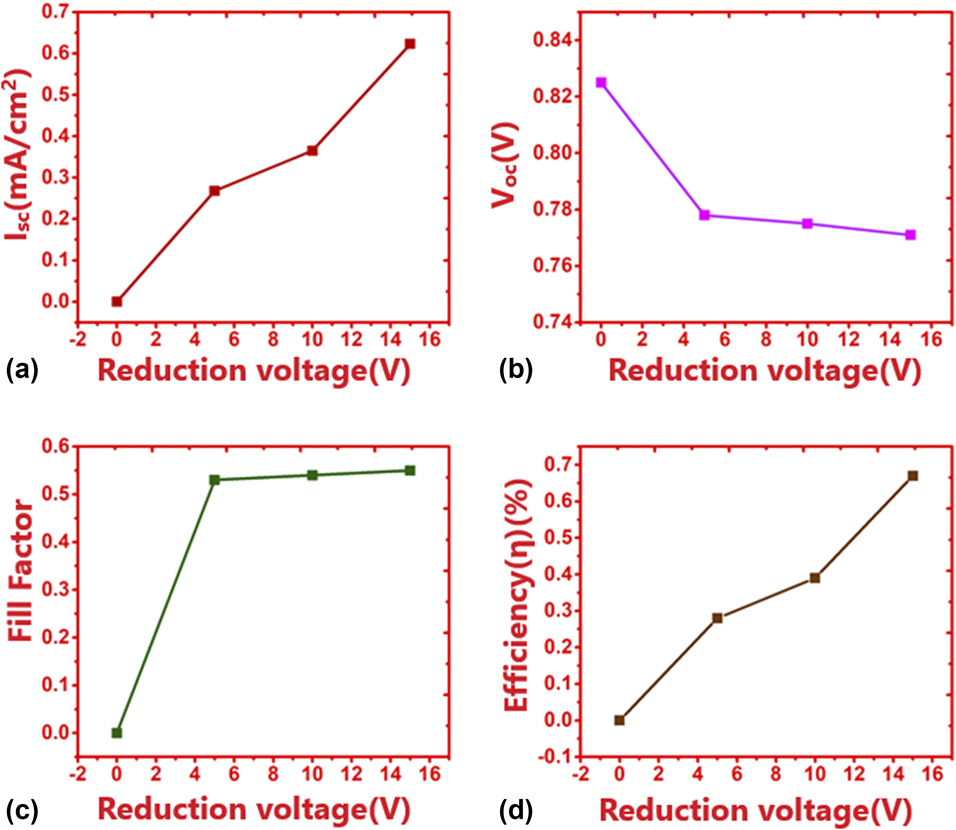
The photovoltaic cell formed by GO and patterned n-Si substrate with an exposure area of 0.64 cm2 was placed in the probe station that was attached to light source as shown in Fig. 5(a). This probe contained two pairs of output segment wires, one pair for the reduction of GO and other for the photovoltaic I–V characterization. For reduction of GO, the Scientech DC power supply was used. The photovoltaic I–V characterization was performed by Keithley 2400 SMU instrument, Keithley a Tektronix company, Beaverton, Oregon. For zero reduction voltage bias, i.e., when GO was not reduced, the photovoltaic cell did not show any significant current measurement when irradiated with visible light of power 25 mW/cm2. The top gold (Au) electrodes were used to provide reduction voltage bias for the reduction of GO. At first, a voltage of 5 V was applied for 70 s across the electrodes. After reduction, the photovoltaic I–V characterization showed 0.268 mA short-circuit current (I sc) under visible light exposure. For 10 V of reduction voltage bias, the current increased to 0.365 mA and it further increased to 0.623 mA for 15 V reduction voltage bias. In all the above measurements, photovoltaic cell was irradiated with visible light of power 25 mW/cm2. On exposing the device, reduced using 15 V bias voltage, to UV light of same power, the short circuit-current shot up to 1.074 mA. Figure 5(b) shows the I–V characteristics of GO-Si photovoltaic cell. It was observed that the open circuit voltage (V oc) of the device stayed constant at 0.78 V for all the reduction voltages. The fill factor (FF) also turned out to be constant at 0.55, while efficiency increased from 0.28 to 0.67 for increase in reduction voltage from 5 to 15 V under visible light exposure. The maximum efficiency of 1.12% was observed under UV light exposure. Table I and Fig. 6 shows the variation in short-circuit current, J sc; open-circuit voltage, V oc; fill factor, FF; and efficiency, η, with reduction voltage.
(a) Schematic diagram of probe station for photovoltaic characterization. (b) The GO-n-Si photovoltaic cell I–V characteristics for varied reduction potential of 0, 5, 10, and 15 V.

The GO photovoltaic cell parameters.

The variation in (a) short-circuit current, (b) open-circuit voltage, (c) fill factor, and (d) efficiency as a function of reduction voltage.
Conclusion
GO was synthesized using modified Hummers’ method. The XRD pattern displayed a single peak at 9.16° corresponding to (001) planes with interplanar separation of 0.964 nm. The stacking height of the graphene sheets calculated using the Scherrer equation was found to be 6.1 nm, indicating approximately 7 layers in the GO sample. UV-Vis spectra of GO without reduction showed an absorption peak at 228.5 nm owing to the π → π* transition and the band gap calculated by the Tauc plot analysis was found to be 4.74 eV. The FTIR spectra of the GO sample showed the presence of C=O (1713 cm−1), C=C (1627 cm−1), C–OH (1418 cm−1), C–O–C (1252 cm−1), and C–O (1030 cm−1) functional groups. The GO and patterned n-Si (100) interaction generated the photovoltaic activity. It worked on the principle of p–n junction formed between p-type GO and n-type silicon. The exposure area of the cell was 0.64 cm2. The gold (Au) stripes on top of the either side of the GO layer were used as electrodes for voltage biased reduction. The GO was reduced using reduction potential of 5, 10, and 15 V. The gold (Au) film deposited between GO and SiO2 was used for the photovoltaic I–V characterization. The FF of photovoltaic cell did not show much variation (0.53–0.55) and the open-circuit voltage (V oc) was found to be constant at 0.78 V for all the cases. But the efficiency (0.28–0.67) and current (0.268–0.623 mA) increased significantly. The cell showed maximum efficiency of 1.12% with short-circuit current of 1.074 mA under UV light having 25 mV/cm2 power.
Experimental procedure
Synthesis of GO
GO was prepared using natural graphite powder following the altered Hummers’ technique. Graphite powder, 3 g, and NaNO3, 1.5 g, were dissolved in concentrated H2SO4 (70 mL) placed within an ice bath on a magnetic stirrer for 4 h. Nine grams of KMnO4 was gradually added to the dissolved solution. The ice bath was used to maintain the temperature of the mixture below 20 °C to prevent any explosion that could happen on addition of KMnO4 at room temperature. After addition of KMnO4, the solution was stirred for 1 h followed by heat treatment at 35 °C for another 4 h while stirring. After that, the solution was diluted by slowly adding 140 mL of de-ionized water and then stirred at 98 °C for 15 min. The resultant solution was further diluted to 450 mL and stirred for another 30 min. In the last step of the procedure, 7.5 mL of 35 wt% H2O2 was introduced at room temperature to the stirring diluted solution. Figures 7(a) and 7(b) shows the schematic diagram of graphite to GO conversion.
(a) Graphite to GO synthesis by Hummers’ method. (b) Images of graphite powder and GO solution.

Methodology for the fabrication of photovoltaic cell
GO promptly develops a stable colloidal suspension in water. Single-layer GO was obtained by subjecting this suspension to ultrasonic treatment (300 W, 35 kHz). N-type silicon (100) wafer (doping density: 1.2–2 × 1015 cm−3) with a 400-nm SiO2 layer was patterned to a square window (0.64 cm2) in center by wet etching using hydrofluoric acid solution. Using thermal evaporation, Au thin film was deposited over SiO2, while covering the center window by masking tape. The back contact was fabricated with silver paste on the n-Si. A fine layer of GO was deposited on the patterned silicon wafer by drop casting technique. The solution was naturally dried to achieve a uniform coating on the rectangular gold (Au) layer and the underlying n-Si. Furthermore, two oppositely positioned rectangular stripes of Au were deposited on top of the GO layer by thermal evaporation and Cu mask was utilized for the desired shape deposition. The top Au layer was deposited to provide the voltage bias for reduction of GO. Figure 3(a) shows the schematic diagram of the structure of the GO-n-Si photovoltaic cell.
Acknowledgments
The authors are grateful to the University Grants Commission and Department of Science and Technology (DST), Government of India, for the financial assistance. The authors would like to thank to Dr. Azad A. Khan, CIF, Jamia Millia. One of the authors (AS) would like to express sincere thanks to DST for the award of Young Scientist and BOYSCAST Fellowship.