Background
When a new infectious disease emerges and starts to spread in a human population, rapid and effective control is critical. Reference Stern and Markel1,Reference Lipsitch, Riley and Cauchemez2 The most desirable goal is to drive the pathogen quickly to extinction, thus only allowing for a localized outbreak. This generally involves applying interventions as strongly as possible. This strategy worked well for SARS, Reference Heymann3 and it worked well for most Ebola outbreaks, albeit not as well for the large 2013 - 2016 Ebola outbreak. Reference Coltart, Lindsey and Ghinai4 Such a strategy failed for the 2009 influenza pandemic, though mortality was fortunately similar to that caused by seasonal influenza. Reference Jhung, Swerdlow and Olsen5,Reference Dawood, Iuliano and Reed6 Rapid eradication has also failed for COVID-19, with devastating consequences. Reference Buss, Prete and Abrahim7
If fast eradication is not achievable, the next best goal is to contain pathogen spread and minimize cases and burden on the health care system until suitable drugs or vaccines are available. This suppression approach calls for strong non-pharmaceutical interventions (NPI), potentially applied for a long time. Such an attempt at minimizing the morbidity and mortality impact has been taken worldwide for COVID-19, with different levels of effectiveness in different countries. Reference Bilinski and Emanuel8 Overall, NPI have helped and continue to help keep COVID-19 at levels below what it could be without such interventions, and the rapid development and availability of effective vaccines since December 2020 has demonstrated that we are able to reduce (but not remove) the burden of COVID-19 in populations that have high vaccination coverage. Reference Kissler, Tedijanto and Goldstein9–Reference Bubar, Reinholt and Kissler11
However, sustaining strong NPI for a potentially long period of time is not always feasible. Reference Hatchett, Mecher and Lipsitch12 This can lead to the worst-case scenario, in which it is not possible to drive the newly emerged pathogen to eradication quickly, nor is it possible to apply prolonged NPI to suppress its spread until drugs or vaccines become available. The December 2022 to February 2023 COVID-19 surge in mainland China with a conservative estimate of 1.41 million deaths was a case in point. Reference Du, Wang and Bai13 Mainland China maintained a very stringent NPI protocol during much of 2020 through 2022. While the overall COVID-19 vaccination rate in mainland China was high early on, the vaccination rate among the elderly was inadequate. Furthermore, vaccine-induced population immunity waned over time. Rather than adopting a gradual phase-in of relaxation of NPI protocol in spring/summer 2022 as in other jurisdictions in the Asia-Pacific, the Chinese government maintained their “Zero-COVID” policies until early December 2022, and then suddenly terminated all NPI protocols; allowing a rapid surge in COVID-19 case count in the winter months of December 2022 - February 2023. The resulting case surge overwhelmed healthcare facilities and led to a vast number of excess deaths that would have otherwise been preventable.
The best option in such a worst-case scenario is to implement interventions such that new infections accrue slowly and do not overly strain the health care system, while allowing for enough infections to occur for the population to reach a level of immunity that will naturally stop further spread (the herd/population immunity threshold). At that point, interventions can be relaxed without risking a resurgent epidemic. Note that such an approach only works if the pathogen induces some amount of immunity following infection. This applies to many recently emerged pathogens, including SARS-CoV, MERS-CoV, Reference Liu, Fontanet and Zhang14–Reference Wu, Wang and Chang16 Ebola virus, Reference McElroy, Akondy and Davis17 and also SARS-CoV-2. Reference Rydyznski, Ramirez and Dan18 Footnote † If this is the case, an outbreak will recede once enough individuals have been infected, and are thus protected. If people must rely on pathogen-induced immunity for an outbreak to end, an important goal is to use NPI in a way that allows enough individuals to become infected for herd immunity to be achieved, while at the same time preventing excess morbidity, and mortality.
Ways to implement NPI or other types of interventions such that the total number of infections (the attack rate) is as low as possible while still reaching population level immunity, have previously been discussed. Reference Handel, Longini and Antia19–Reference Lauro, Kiss and Miller21 In this work, the focus is shifted from minimizing cases to an arguably more important goal, namely minimizing mortality, and years of life lost. For many pathogens, different age and risk groups have different mortality rates. For example, COVID-19 related mortality among children is low, while the elderly are at a much higher risk. This suggests that in a worst-case scenario where containment is not possible, overall mortality can be minimized with NPI that preferentially protect the elderly while allowing the minimum number of infections required to reach population immunity to occur in the least vulnerable groups. This research therefore illustrates how NPI applied to different target groups affect overall mortality, using a simple simulation model (see Supplement for details). Three age groups, children, adults, and the elderly, are considered, and interventions that reduce the risk of infection for each age group are implemented.
Methods
Basic model
For illustration, a simple simulation model (a compartmental SIR-type model) was used. The model was of a population that is stratified by children, adults, and the elderly. It was assumed that there are 20% children and 25% elderly in the population, with the rest being adults. This is similar to the population composition of many developed countries. For simplicity and generality, the population size was set to 1 million. Changing this number only re-scales the numbers and does not impact results.
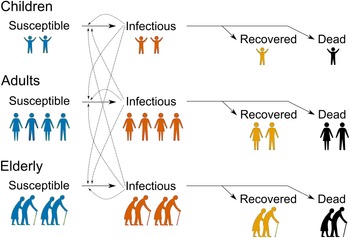
For each age group, the model tracks the number of individuals who are uninfected and susceptible, the number of individuals who are infected and infectious, and the number of individuals who have recovered and are presumed to be immune. It also tracks the number of individuals who died from the disease. Figure 1 shows a schematic diagram of the model. For the model simulations shown here, chosen values for model parameters were in line with values estimated for COVID-19.
Schematic of the model. The population is stratified into 3 age groups, children, adults, and the elderly. In each age group, individuals are initially uninfected and susceptible. Through contact with infected and infectious individuals of any age group, they can become infected. Contact rates and thus risk of infection differ between age groups. Infected individuals can either recover or die. The risk of mortality differs by age group, and in the model, is assumed to be highest for the elderly and lowest for children. See supplementary material for model details, including the equations and values for model parameters, as well as the computer codes that implement the model.

COVID-19 has a strong age-dependent mortality profile, with children the least at risk and elderly the most. For this study, mortality risks of 0.1%, 1%, and 10% were used, in line with several recent reports. Reference Mizumoto and Chowell22,Reference Verity, Okell and Dorigatti23 Within- and among- group transmission rates that are simplifications based on previous work that applies generally to respiratory and other pathogens were utilized. Reference Mossong, Hens and Jit24–Reference Steele, Remais and Gambhir26 The transmission rates were calibrated to get an overall reproductive number R 0, of 2, which is similar to estimates for influenza, and at the lower side of estimates for COVID-19. Reference Li, Guan and Wu27,Reference Billah, Miah and Khan28 Also, in line with COVID-19 estimates, it was assumed that the duration of the infectious period is 10 days, and for simplicity this value was used for all age groups. Reference Wölfel, Corman and Guggemos29 It is important to point out that the overall findings are qualitative and conceptual, and thus do not rely on specific choices of model structure and parameter values. The same overall patterns were found for values chosen to mimic other pathogens, e.g., influenza or Ebola.
Model equations and further details, as well as all codes to run the model and reproduce the results, are provided as supplementary materials. There is also a free online version of the model that users can explore through a graphical interface (as described in the supplementary materials).
Non-pharmaceutical interventions (NPI)
The model explored the impact of different NPI that reduce the rates at which different age groups become infected. The exact type of NPI is not further specified in the model; it is only assumed that it reduces the rates of infection for a specific age group. In practice, such reductions can be accomplished by wearing masks, social distancing, and limiting interactions with others, as well as closing schools, full lock-down, etc. Essentially any measure that reduces transmission could be considered. The developed model is agnostic toward the specifics; it only assumes that some intervention reduces infection risk for a given group. Different interventions that preferentially target the different age groups were considered. For all intervention scenarios, intervention was started at day 100 and applied for 120 days. The exact timing and the strength of the reduction in transmission is not important; other ways of choosing the interventions will produce the same overall patterns as those shown below. The model was deliberately kept simple. It was used to explore and illustrate the conceptual idea and findings in a qualitative manner, but is not detailed enough to be applied to any specific real-world scenario.
Results
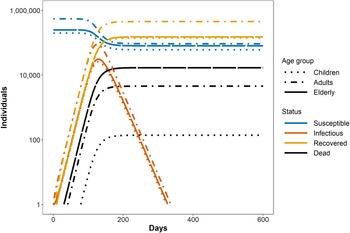
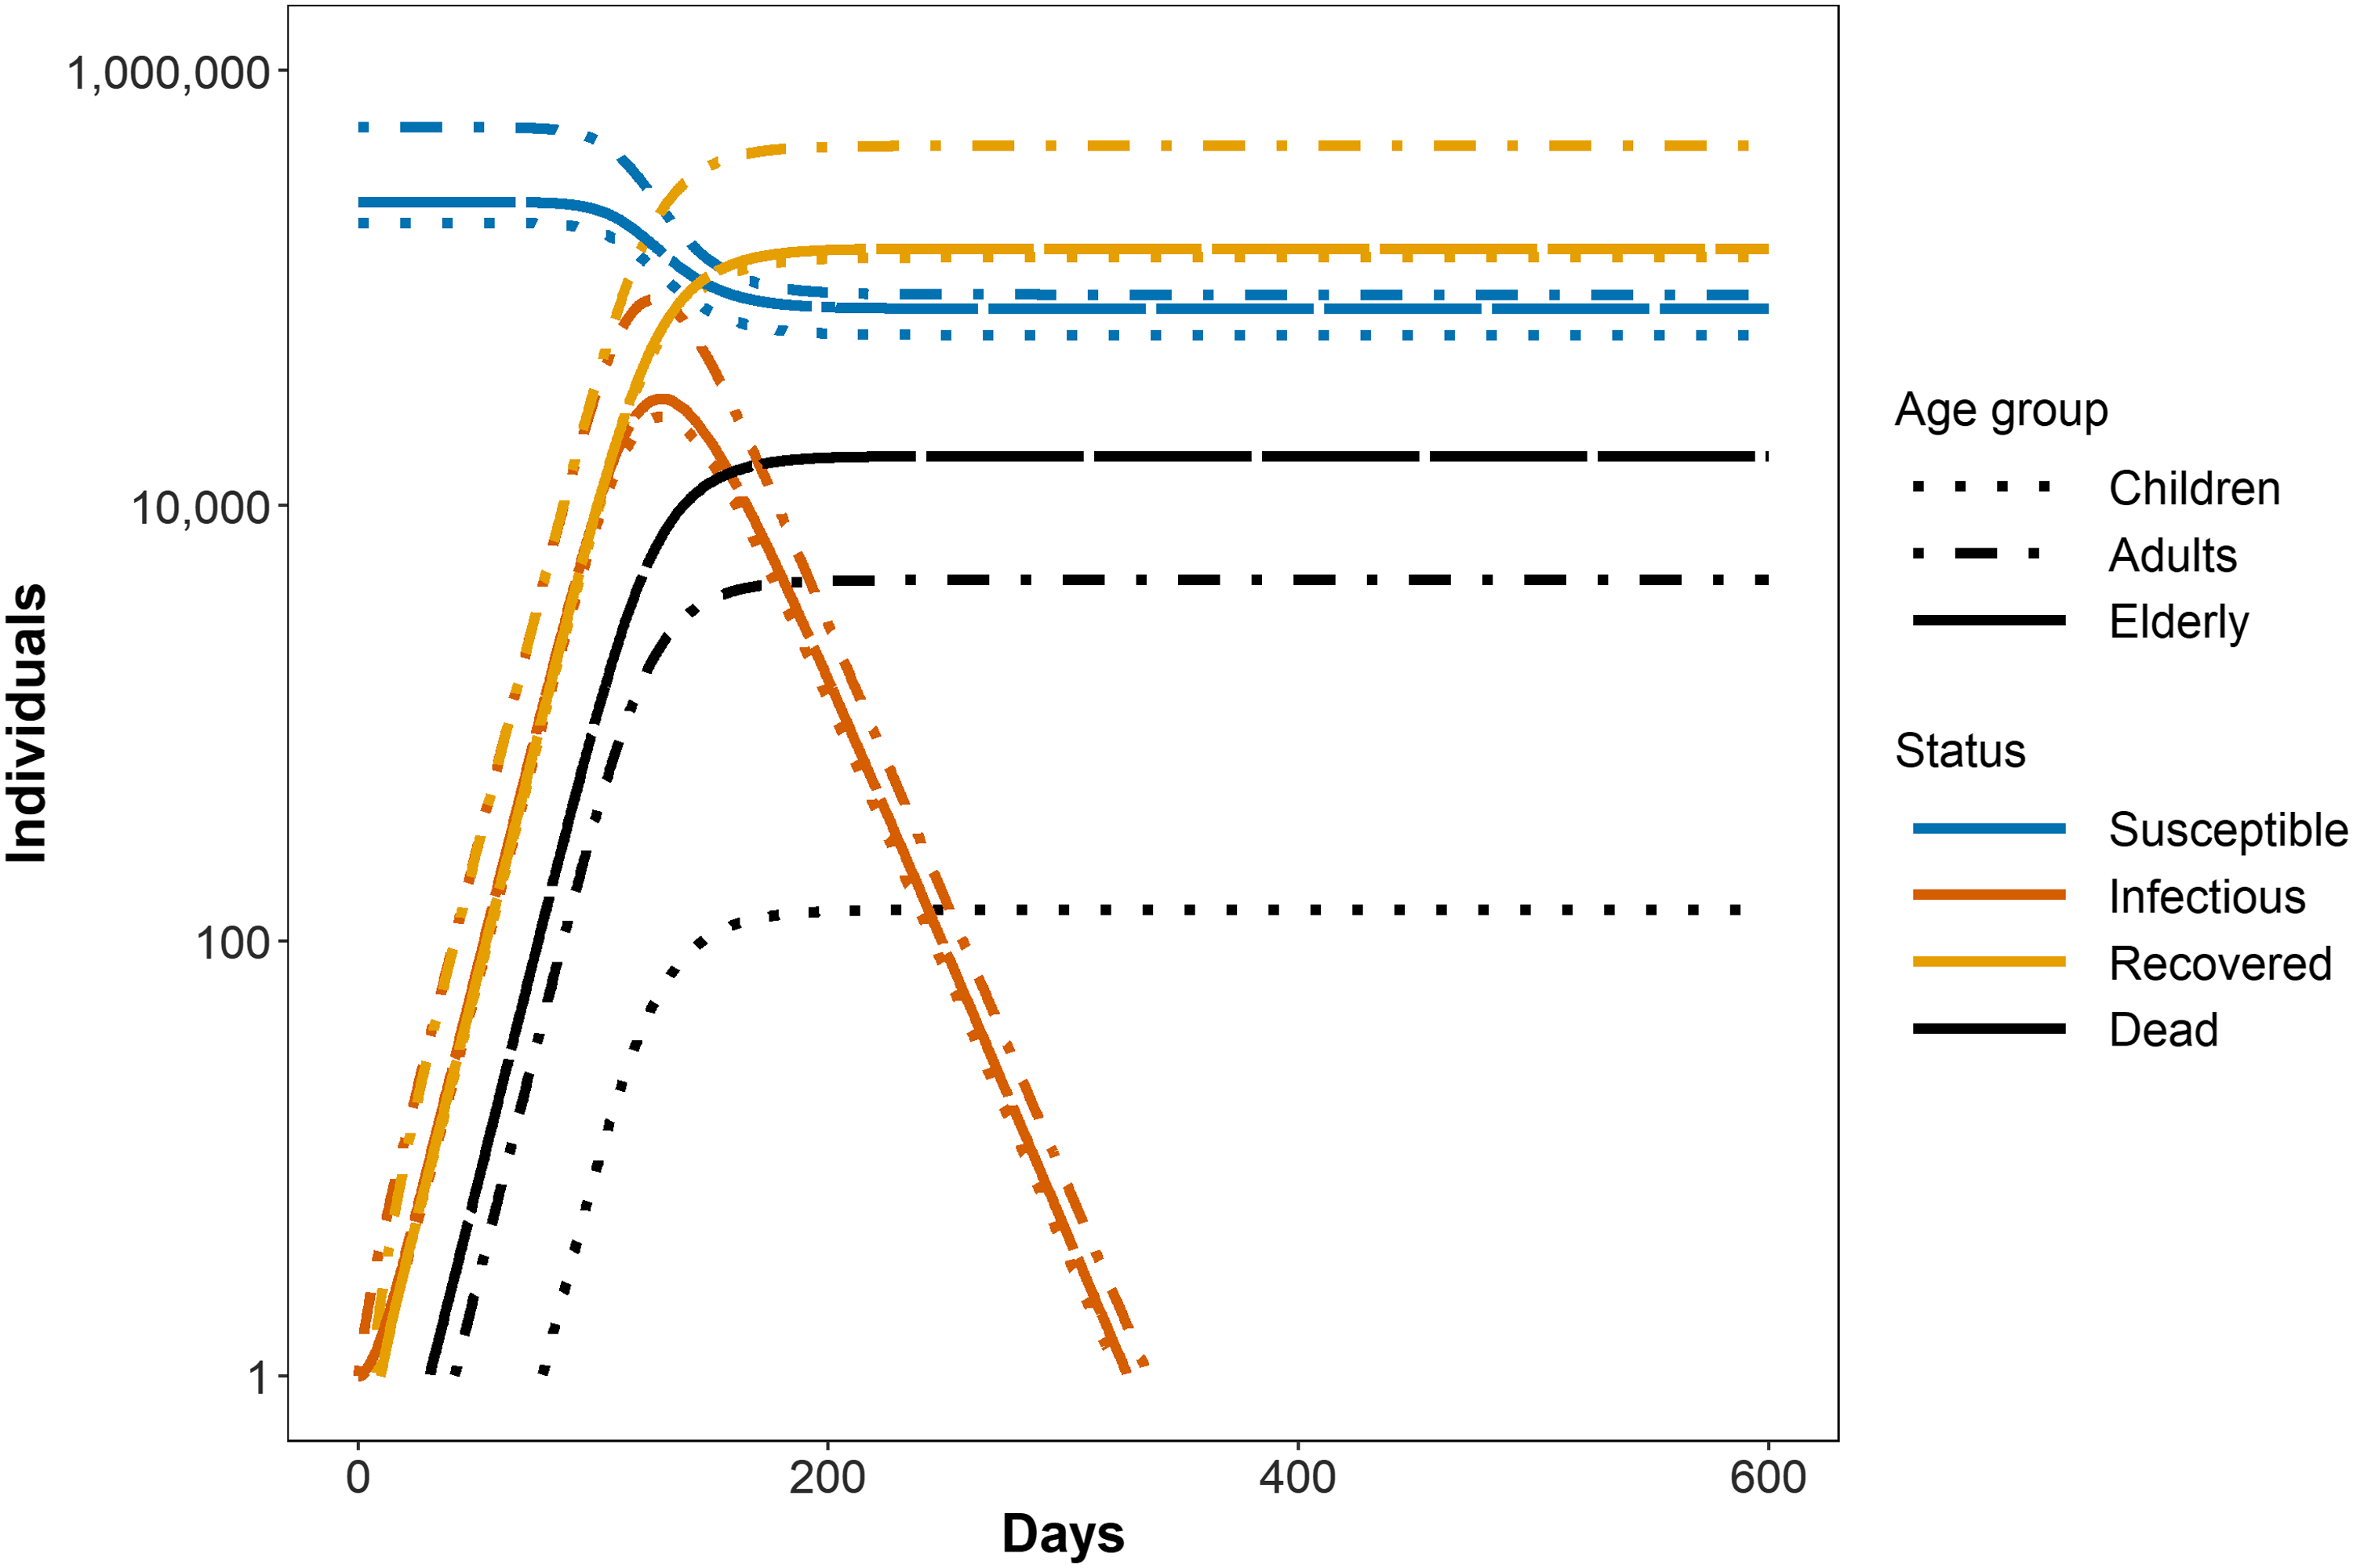
An outbreak was simulated, in the absence of any interventions. This serves as the baseline, to which the different interventions were compared. Figure 2 shows such an outbreak in the absence of any NPI for each of the age groups in the model.
Susceptible, Infected/Infectious, Recovered, and Dead for each age class in the absence of any intervention. Children suffer the lowest number of deaths, the elderly the highest. This occurs even though the largest number of individuals in the model is in the adult category (55% adults, 25% elderly, 20% children), and can be attributed to the much higher fraction of mortality for elderly (10%) versus adults (1%) and children (0.1%) (Note the logarithmic scale for the y-axis.). More detailed information regarding settings for the model that is used to produce the figure, and full code to reproduce this and all other figures is given as supplementary data.
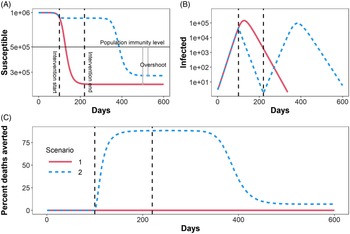
In Figure 3, the baseline, no-intervention scenario was shown again (solid red line). This time individuals in the different age groups were added together and a plot of the total numbers of susceptible and infected, as well as deaths averted (since the no-intervention simulation serves as baseline, deaths averted are 0), was drawn. Plotting the sum of individuals across age groups allowed the illustration of the important overshoot concept. Reference Handel, Longini and Antia19 Without interventions, the total number of susceptible people drops far below the population immunity level. This means many more individuals become infected than would be needed to reach population level immunity. This is because population level immunity is reached at the peak of the outbreak (which is the reason why the outbreak begins to wane). However, as the outbreak wanes, there are still many additional individuals that become infected.
Total (sum of all age groups) Susceptible (A) and Infected/Infectious (B) individuals, as well as percentage deaths averted compared to the no-intervention baseline (C). The no-intervention scenario (scenario 1, red solid line) is the same as in the previous figure. The outbreak in the absence of interventions leads to a large overshoot (gray arrow), i.e., a drop among the susceptible population far below the population immunity level (solid horizontal line). In scenario 2 (dashed blue line), a strong intervention is applied to all groups, starting on day 100 after outbreak start. This is enough to drive down the outbreak while the intervention is active, thus initially strongly reducing mortality. However, once the intervention is stopped (in this simulation assumed to be after 120 days), a consecutive outbreak occurs; leading to an overshoot and drop in the number of susceptible people similar to the no-intervention scenario, and the overall number of averted deaths at the end of the outbreak is low.

Figure 3 also shows a simulation in which strong control is applied for some amount of time (scenario 2, dashed blue line). While the intervention is active, the number of infected people drops quickly (compare panel B for the 2 scenarios) and the number of susceptible people drops a little (panel A), which leads to many averted deaths (panel C). However, this effect only lasts while the intervention is applied. If - for whatever reason - the intervention cannot be sustained before the pathogen has been driven to extinction (or new cases are imported), a subsequent outbreak occurs. Depending on the strength of the initial intervention, this outbreak might be as large as or even larger than the first outbreak (see second peak for scenario 2 in panel B). The overall result is that during the second outbreak, the population not only reaches but again drops far below the population immunity threshold, with an overshoot that can be almost as large as that seen in the no-control scenario (panel A). This results in a small final number of averted deaths (panel C). Switches from strong to reduced NPI and back, leading to multiple peaks and declines in incidence, was clearly at display for COVID-19 in 2020 in Europe, and the US, as well as other countries. Reference Monod, Blenkinsop and Xi30
Previous studies have explored how to apply control to minimize the overshoot, and thus achieve the best possible outcome under this worst-case scenario where prolonged NPI are not possible. Focusing on the reduction of infections, it has been showed that any intervention that ensures a soft drop of the susceptible population to the population immunity level, while preventing further infections (minimizing the overshoot) is ideal, and such interventions can be implemented in different ways. Reference Handel, Longini and Antia19–Reference Lauro, Kiss and Miller21
This study, however, focuses on a different objective, which is arguably more important: the minimization of mortality instead of infections. If there is no difference in mortality risk among those infected, then minimizing the number infected at the same time minimizes the number dying. However, for most pathogens, including COVID-19, there are strong mortality differences based on characteristics such as age. If this is the case, then the goal should be to apply intervention measures in such a way that enough infections occur for the population to reach immunity threshold, while at the same time protecting those at risk from death as much as possible.
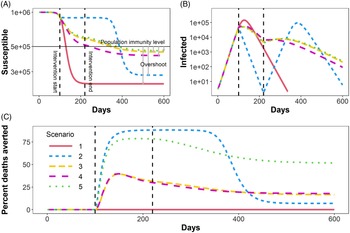
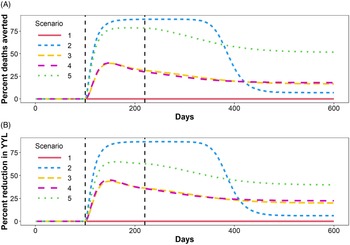
This idea is shown in Figure 4. In addition to the baseline with no control, and the strong-control scenario from the previous figure, 3 additional intervention scenarios are shown. The overall strength of those 3 interventions is comparable. The difference is that in scenario 3, the main targets of the intervention are children (i.e., the risk that children become infected is strongly reduced). For scenario 4, the main targets are adults; while for scenario 5, the main targets are the elderly. One can see that the 3 interventions are similar regarding the number of infected people (panel B) and the size of the overshoot, i.e., excess depletion of susceptible numbers beyond the population level threshold (panel A). Crucially, the averted deaths differ meaningfully. Not surprisingly, intervention 5, which preferentially targets high-risk elderly, leads to the highest reduction in mortality. Results are similar if people consider years of life lost (YLL) instead of mortality. In such a case, a death among children weighs more than a death among adults, which in turn weighs more than a death among the elderly. Figure 5 shows that this shifts the relative impact of the different intervention strategies somewhat, but since risk of death among elderly is much higher compared to the other 2 groups, a strategy that mainly protects the elderly is still the most impactful.
Susceptible, infected, and percentage of deaths averted for a simulated outbreak. Scenarios 1 and 2 are the same as those shown in the previous figure. Scenarios 3 - 5 show interventions that preferentially prevent children, adults, and the elderly respectively, from getting infected. To ensure intervention strengths are comparable, there is always some intervention applied to the adult group. See the supplementary data for details on the model and intervention implementation.

(A) Reduction in mortality, and (B) Reduction in Years of Life lost (YLL) for the different intervention scenarios. See the supplementary data for details on the YLL computation.

Discussion
This conceptual, model-supported analysis makes several points. First, it has been re-iterated that under a worst-case, non-containment scenario where prolonged NPI are not possible, and vaccine and therapeutics are unavailable, the best people can achieve is to allow the number of infected individuals to grow to a level at which the population level immunity threshold is reached, and to do so might require interventions that are targeted in a smart way. Specifically, strong NPI for some duration is not ideal if it cannot be maintained. Instead, weaker (but sustainable) NPI might be better.
It is important to clarify that this analysis does not support the idea of allowing enough people to become infected with COVID-19 to reach population immunity. Reference Sridhar and Gurdasani31 In fact, many countries have demonstrated that it is possible to keep COVID-19 incidence at low levels. Results strongly disagree with theories that an approach that has population immunity as goal is appropriate for COVID-19. 32 Indeed, the fact that many countries were able to produce and roll out vaccines long before they reached the population level immunity threshold, shows that the strong NPI many countries implemented prior to vaccination roll-out to slow the spread was the correct approach for minimizing morbidity, and mortality. Nevertheless, in the future, there might be pathogens, or settings where sustaining NPI until drugs or vaccines become available is not feasible. In such a scenario, the strategy described here is the best that people can hope for, and a minimization of mortality while allowing infections to build up to population immunity should be targeted.
That said, while conceptually sound, there are many practical considerations that make this approach tricky to use. First, the population level immunity threshold is difficult to determine. Taking COVID-19 as an example, current estimates vary widely. Reference Fontanet and Cauchemez33,Reference Omer, Yildirim and Forman34 In addition, populations are not homogeneously mixed. This means that the concept of a single population immunity threshold is at best a conceptual abstraction and approximation. This threshold will differ between specific populations and settings. It might be possible to reach population immunity in some areas or among some groups of people while it is still far away in others (a feature that is at unfortunate display with COVID-19 in the US, where minorities bear an over-sized brunt of the disease.). Reference Dyer35 This non-homogeneous mixing also applies to age groups. Thus, insofar as children encounter the elderly, having a child that is protected due to prior infection helps. However, it does not help for any contacts within the elderly age group and among adults and the elderly. The implications of this are that if pathogens are introduced into a setting with mostly contacts among the elderly (e.g., an elderly home), it could lead to an explosive outbreak in that setting, even if the general outbreak in the population is waning.
Furthermore, for viruses such as SARS-CoV-2 or influenza, their frequent mutations lead to immunity (whether induced by natural infection or vaccine) waning over time. Replenishment of susceptible individuals in the population would make subsequent outbreaks possible.
Even if it were possible to compute the population level immunity threshold for specific groups, strong surveillance or sero-prevalence studies would be needed to estimate the number already infected, so people can estimate how far a population is from their immunity threshold. Having good estimates for the number of infections for COVID-19 has proven to be difficult. It is generally agreed that there is substantial under-reporting. For pathogens with more distinct symptom profiles (e.g., Ebola), under-reporting might be less of a problem. However, even then there can be strong under-reporting if the outbreak occurs in areas with weak public health surveillance.
Lastly, estimates need to be made on the impact of current interventions and based on that information, adjustment decisions will be made. If new infections among low-risk groups are minimal, a relaxation of NPI in those groups can be considered. Conversely, if the outbreak increases too rapidly in any group, NPI will need to be tightened. The difficulties of estimating the impact of NPI in real-time have been on display during COVID-19, where different groups have made attempts to provide real-time estimates for the impact of NPI (usually quantified by the effective reproductive number, which is a measure of disease spread, with a value above 1 meaning an expansion, and below 1 meaning a contracting outbreak). Those estimates have often been quite uncertain and inconsistent. Reference Soltesz, Gustafsson and Timpka36–Reference Kucharski, Russell and Diamond39 The problem of adherence is an important concern as well. If individuals do not follow the NPI in place, then policy makers have limited abilities to fine-tune intervention measures.
In general, for any newly emerging pathogen, the best approach to minimize morbidity and mortality is to initially implement all feasible interventions as quickly as possible to eradicate, or at least suppress the disease. If eradication is not feasible and that long-term suppression until drugs or vaccines become available is also not feasible, people might need to consider as a last resort the approach described here. NPI should be implemented such that the least vulnerable individuals become infected in as controlled a manner as possible (i.e., keeping infected numbers at any time at a low level), until population level immunity is achieved. At the same time, the most vulnerable groups need to be strongly protected, and infections managed to ensure the health care system remains functional. With the right surveillance in place, decision-makers can be adequately informed as they try to balance the need to relax interventions, keep transmission low, and reduce mortality. Fortunately, for COVID-19, obtaining effective vaccines in a timeframe that did not require this strategy of last resort, was possible. While acquired immunity against COVID-19 wanes over time, the availability of booster doses and NPI adopted strategically when case count surges, would help keep case count at a level that would not overwhelm healthcare capacity.
Nevertheless, being aware of the concepts and ideas described here is useful both for the ongoing COVID-19 pandemic and potential future outbreaks. Specifically, if children or adults are less vulnerable compared to the elderly (as is the case for many infectious diseases), NPI that preferentially target the elderly, while allowing some transmission among less vulnerable populations, might be preferable. For example, in some Asian communities, many senior citizens continue to wear facemasks voluntarily, even though the COVID-19 facemask mandate has been lifted by their governments.
During the COVID-19 pandemic, different countries took different approaches regarding keeping schools open. Many European countries kept schools open as much as possible while closing other venues, while the US was quicker to close schools when the pandemic first hit. While school closures have proven to be an important means for delaying or reducing outbreaks, Reference Jackson, Vynnycky and Hawker40,Reference Fung, Gambhir and Glasser41 they come with large economic and societal costs, with generally an outsized impact on disadvantaged, and vulnerable populations. Reference Navarro, Kohl and Cetron42
In light of this analysis, the approach of keeping schools open in a safe manner (i.e., if teachers can be protected from getting infected by their students) for as long as feasible was the better approach. School closures preferentially reduce infections in low risk groups, Reference Jackson, Vynnycky and Hawker40,Reference Garza, Basurto-Dávila and Ortega-Sanchez43 thus possibly shifting infections that occur on the way to population immunity towards higher risk groups. It is, however, important to point out that school closures have likely stronger secondary effects on contact patterns compared to interventions targeting the elderly. For instance, closed schools might require adults to stay home, thus changing their infection risk, or having grandparents care for their grand-children so that the parents can go to work. Reference Miller, Danon and O’Hagan44 Likewise, potential deaths among teachers may have a lasting impact on many school systems, especially in disadvantaged communities where the lack of funding renders recruitment of teachers challenging and raises ethical challenges of putting teachers and their families at risk. Thus, the exact implications of school closure in redistributing the risk of COVID-19 morbidity and mortality among community members of different age groups remain uncertain. It is important to analyze the impact of different interventions using detailed models and empirical epidemiological studies, so that decision-makers can be adequately informed as they balance the need to slow transmission and to reduce mortality in the community.
Conclusion
In conclusion, in a worst-case scenario where containment is not possible, vaccines and therapeutics are not available, and reaching population level immunity through natural infection is the only option, it might be necessary to implement NPI in such a way as to allow sufficient infections to occur to achieve population immunity. In such a setting, if there are differential mortality risks in the population, interventions should focus on protecting those at the highest risk, while allowing enough of those at low risk to become infected to achieve population level immunity.
Supplementary material
To view supplementary material for this article, please visit https://doi.org/10.1017/dmp.2023.203
Competing interests
ICHF declares that he is a consultant for Merck & Co., Inc.