I. INTRODUCTION
The radiant power leaving a surface, both emitted and reflected, per unit area, per unit solid angle (projected on to the surface normal of the selected direction), and per unit wave length is the spectral intensity, with units of W/(m2·sr·μm). The term “spectral” denotes wave length dependence. A blackbody is a perfect absorber (no reflection or transmission) of radiant energy, whose spectral intensity follows Planck’s law with respect to wave length and temperature:
 $$I_{\rm{T}} ({\rm{\lambda }}) ={ (2hc^2 )\over({\rm{\lambda }}^5 (\exp (hc/({\rm{\lambda }}kT)) - 1))}\quad,$$
where h is Planck’s constant (6.626 × 10⁻³⁴ J-s), k is Boltzmann’s constant (1.381 × 10⁻²³ J/K), λ is wave length (m4/5·μm1/5), c is the speed of light (2.998 × 10⁸ m/s), and T is the absolute temperature (K). A blackbody surface emits diffusely (no variation in spectral intensity with orientation); upon integrating over the hemisphere of emission, the spectral radiosity is obtained, R T (λ) = π I T (λ),Reference Incropera and DeWitt1 which is the radiant power emitted per unit surface area per unit wave length. For real (nonblackbody) surfaces, spectral intensity varies with orientation, I T (λ, θ, ϕ); diffuse emission generally occurs for both polished metal and dielectric surfaces at view orientations up to ∼45° from the normal.Reference Incropera and DeWitt1
The efficiency of radiation heat transfer from a surface is described by the spectral emissivity, which is the ratio of the spectral radiosity emitted from a real body to that from a blackbody at the same temperature, at a given wave length. For diffuse emitters, the spectral emissivity is equivalently the ratio of spectral intensities.
If the spectral radiosity as a function of wave length is known, an independent measure of temperature may be made using Wien’s displacement law, T = b/λmax, where λmax is the peak wave length, b is a constant (2897.7685 μm-K), and T the absolute temperature. Temperature determination using Wien’s displacement law would require adequately gray behavior (constant spectral emittance with wave length) so that the position of the maximum of the spectral radiosity/intensity distribution is unaltered from that of a blackbody at that temperature.
Deviations from blackbody absorption result from reflections from the surface, or transmission through the body. Such transmission would only occur in a dielectric since the free electrons in a metal would move to oppose the electric field of the electromagnetic radiation. On the assumption that the dielectric is adequately thick to absorb all incident radiation (that was not reflected), then the spectral emissivities of dielectrics are substantially higher than (polished) metals since such metals demonstrate much higher reflectivity. The spectral emissivity is a material’s property, which assumes a polished surface. For rough-surfaced materials, there is the potential for multiple reflections inside of microscopic surface crevices, increasing the propensity for absorption. The spectral emittance has been coined as a term to describe the effective spectral emissivity for such real surfaces; spectral emittance increases with increasing surface roughness.Reference Touloukian2
In dielectrics, there are regions in the infrared portion of the spectrum, which are highly absorbing because the incident radiation is resonant with the vibration frequencies of atoms in the lattice. Increasing absorption with longer wave length in the 1–6 μm range (the range evaluated in this work) is generally associated with the ascension to the maximum of this broad absorption band. For example, the rise in absorption leading to this peak occurs over the 2–5 μm range for BeO and the 2.5–8 μm range for MgO.Reference Siegel and Howell3 The maximum of the blackbody spectrum shifts to shorter wave lengths with increasing temperature, e.g., at 500 °C, λmax = 3.75 μm, and at 2000 °C, λmax = 1.27 μm. Since absorption is lower in these shorter wave length spectral regions, the total emissivity (average determined by integrating spectral emissivity over all wave lengths) of dielectrics tends to decrease with increasing temperature.Reference Siegel and Howell3
Polished metals of increasing electrical conductivity have higher surface reflectivities, thus lower emissivities (Hagen–Rubens relationReference Siegel and Howell3). For most polished metals, spectral emissivity in the infrared decreases with increasing wave length. Since the blackbody spectrum shifts to shorter wave lengths (where the spectral emissivity is higher) with increasing temperature, and the electrical resistivity increases with increasing temperature, an increase in total emissivity is observed for polished metals with increasing temperature.
The formation of an oxide layer on a polished metal can substantially increase the spectral and total emittances.Reference Modest4 For example, the total emittance of copper increases from ∼0.05 to 0.9 as a copper oxide surface scale of 5.5 μm forms.Reference Brannon and Goldstein5
Spectral emittance is an important parameter of merit for ultrahigh temperature ceramics (UHTCs) since the steady-state temperatures they attain via velocity-induced aerothermal heating will be determined, in part, by the efficiency with which they radiate heat away to the cold surroundings. Experimental measurement of spectral emittance is often complicated by the fact that the self-luminescent specimen must be observed in relative isolation; reflections of thermal radiation from nearby hot regions (such as heating elements or furnace walls) become merged with radiation emitted by the specimen. These problems have been overcome by rapidly rotating a cylindrical specimen in a furnace with a water-cooled viewing port, wherein briefly exposed portions of the specimen are viewed under conditions of no furnace reflections.Reference Clark and Moore6, 7 In a solar furnace (specimen heating via concentrated solar radiation), reflected concentrated solar radiation was subtracted from specimen surface radiosity via a rotating disk, intermittently blocking incident solar radiation.Reference Noguchi and Kozuka8
ZrB2-based materials are of interest as UHTCsReference Wuchina, Opila, Opeka, Fahrenholtz and Talmy9, Reference Paul, Jayaseelan, Venugopal, Zapata-Solvas, Binner, Vaidhyanathan, Heaton, Brown and Lee10 since they have melting/decomposition temperatures well in excess of 3000 °C. They are electrical conductors and hence have comparatively high thermal conductivities at elevated temperatures. This is required to mitigate thermal stresses induced from extreme heat fluxes developed in applications such as leading edges for hypersonic vehicles. Typically, 20 vol% SiC is introduced into the microstructure to improve oxidation resistance via the formation of a self-sealing silicate surface layer. Karlsdottir and HalloranReference Karlsdottir and Halloran11 took advantage of the fact that ZrB2-based materials behave as metallic conductors; machined ribbons of ZrB2-based ceramic compositions were resistively heated. A modification of this methodology has been developed for the work described herein to avoid the aforementioned reflection problem when measuring spectral emittance.
Scatteia et al.Reference Scatteia, Alfano, Monteverde, Sans and Balat-Pichelin12 determined total emittances (based on total radiosities via integration of measured total intensities over all view angles) of unoxidized ZrB2–15 vol% SiC specimens of two different surface roughnesses using concentrated solar radiation as a heat source, in a low pressure oxidizing atmosphere, over the temperature range ∼800–1600 °C. In another study using similar equipment, Scatteia et al.Reference Scatteia, Cooosentino, Cantoni, Balat-Pichelin, Beche and Sans13 measured the total emittances of sintered ZrB2–SiC as well as plasma-sprayed coatings (compositions not specified), at both 200 and 10−3 Pa total pressure. It is not apparent in these studies that the effects of atmospheric absorption/emission were considered. Meng et al.Reference Meng, Chen, Hu and Wang14 studied the spectral emittances of preoxidized ZrB2–20 vol% SiC–15 vol% C over the 1100–1800 °C and 3–18 μm ranges using FTIR. Measurements from opposing identical furnaces, one containing a blackbody cavity and the other containing the specimen, allowed determination of total normal emittance as a ratio of integrated spectral intensities. It was implied that the effects of furnace reflections off the specimen canceled out, which may not have been the case since a blackbody cavity would uniquely absorb and separately reemit radiation incident on the cavity entrance. Zapadaeva et al.Reference Zapadaeva, Nikolaeva, Ordan’yan and Petrov15 studied the spectral emittances of ZrB2–10% LaB6 at a single wave length of 0.65 μm over the temperature range 1000–2700 °C via direct electrical heating of the specimen. The results of all these literature studies are presented in the Sec. III and compared to the results obtained herein. In this work, we have used direct electrical heating on machined ribbon samples of a ZrB2–6 mol% B4C–30 mol% SiC composition to evaluate the spectral emissivity in the 1–6 μm and ∼1100–1500 °C ranges.
II. EXPERIMENTAL PROCEDURE
Theoretically dense test specimens were fabricated using techniques as described in our prior work,Reference Peng and Speyer16, Reference Peng, Van Laningham and Speyer17 with a composition of 64.25 mol% ZrB2, 6.04 mol% B4C, and 29.70 mol% SiC (70.32 vol% ZrB2, 7.82 vol% B4C, and 21.87 vol% SiC). These have shown good oxidation resistance up to 1900 °C in flowing dry air.Reference Peng, Van Laningham and Speyer17 ZrB2 (d 50 = 2.20 μm; H.C. Starck, GmbH, Munich, Germany), B4C (d 50 = 0.8 μm; H.C. Starck), and α-SiC (d 50 = 0.88 μm; Superior Graphite, Chicago, IL) powders were suspended in methanol and mixed in a ball mill. The dried powder mixtures were then mixed in aqueous suspension with soluble organic pressing agents, dried, and sieved. They were uniaxially pressed into the shape of rectangular prisms, followed by cold isostatic pressing. The compacts were then exposed to thermolysis, pressureless sintering, and hot isostatic pressing temperature/pressure treatments. The pore-free rectangular specimens were machined (Advanced Ceramics Manufacturing, Tucson, AZ) into approximately 1 cm in width and 3 cm in length. Regions of the specimens at which electrical contacts were made were comparatively thick, leaving the thinned (0.3 mm) center regions of higher resistance as the heating zones. In the machining process, the samples were ground with a 100-grit diamond wheel, which was dressed before each sample was ground. The surface finish was estimated (by Advanced Ceramics Manufacturing) to be 0.4–0.8 μm Ra.
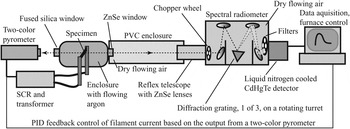
A schematic of the experimental setup to measure spectral intensity is shown in Fig. 1. A custom-built enclosure facilitated atmosphere control, as well as electrical contact to the specimens. These specimens were clamped at each end to copper feed-through bus bars, which extended through insulated gastight seals out of the chamber. These copper bars were, in turn, connected to welding cables feeding to the secondary stage of a step-down transformer. The copper contact surfaces were periodically cleaned with 220-grit SiC sandpaper to remove oxidation. The front and back specimen surfaces faced opposing viewports, one of fused silica, through which an orthogonally mounted two-color pyrometer received radiation, and another of ZnSe, through which an orthogonally mounted spectral radiometer received radiation (thus, measurements were of surface normal spectral intensity). Specimens were loaded and removed via an O-ring-sealed plate on the top of the chamber.
Configuration of components used to measure spectral intensity.

An inlet tube provided argon to this enclosure (Ultra High Purity grade; Airgas, Atlanta, GA, <1 ppm O2, <1 ppm H2O, <0.5 ppm CO2), and the outlet tube led to either a mechanical vacuum pump or a bubble flow check valve, selected via a three-way valve. Internal pressure of the chamber was monitored with a mechanical pressure gauge. Atmospheres were established by three pump down–backfill sequences, followed by flowing argon at 100 cm3/min.
The temperatures of the specimens were monitored by the two-color pyrometer (Modline 5R; IRCON, Inc., Santa Cruz, CA) focused on a circular area of approximately 4 mm in diameter at the center of the heated specimen. Pyrometer temperature readings were fed (RS232) to a personal computer; a proportional-integral-derivative (PID) algorithm generated a 4–20 mA instruction (via a 12-bit D/A converter) to a semiconductor-controlled rectifier (SCR), which throttled power to the step-down transformer (10 V RMS secondary). The pyrometer was not adequately sensitive to temperatures below 1000 °C, so specimens were heated to this temperature by a linear rate of power increase until a valid signal was reported by the pyrometer. At this point, the samples were heated at 200 °C/min to a set point soak temperature (1100, 1200, 1300, 1400, or 1500 °C) and then held at that temperature for ∼60 min, during which time spectral measurements were taken. Spectral intensity measurements were not begun until the specimens had stabilized to within 3 °C of the specified set point soak temperature.
Spectral intensity data collection was performed with the computer-controlled spectral radiometer (OL Series 750 Automated Spectroradiometric Measurement System; Gooch & Housego, formally Optronic Laboratories, Orlando, FL), which diffracted incoming radiation on a reflective grating mounted on a rotating turret, thereby directing specific wave lengths to a detector (Fig. 1). A multiposition higher-order interference blocking filter was placed in the optical path, along with a computer-controlled variable frequency optical chopper to subtract out ambient radiation. Spectral intensity was measured over a range of wave lengths from 1 to 6 μm using a liquid nitrogen-cooled CdHgTe detector. The spectral radiometer was equipped with a ZnSe inlet lens. It had a target area of less than 1 cm in diameter at a distance of 90 cm. The radiometer enclosure was not airtight; it featured a purge gas port through which a shield gas was used to flood its interior. The optical path from the radiometer to the ribbon chamber was enclosed by a length of PVC pipe (∼11 cm in diameter), which was outfitted with a purge gas port. To minimize the effect of atmospheric absorption due to the presence of H2O and CO2 gases, dry synthetic air (Ultra Zero Grade; Airgas, Atlanta, GA, <2 ppm H2O, <1 ppm CO2) was flowed through the spectral radiometer and within the PVC pipe along the line-of-sight to the specimen chamber, for a period of not less than 4 h before measurement, and continued throughout the measurement.
The spectral radiometer was calibrated using a stainless steel blackbody cavity machined into a conical shape (opening on the narrow end), mounted within a MoSi2 heating element box furnace. Calibrations were performed through the same ZnSe window that was mounted in the specimen chamber, so that optical paths were identical. The optical path from the radiometer to the cavity opening was enclosed by a length of PVC pipe (∼11 cm in diameter), which contained a purge gas port. The cavity was protected against excessive oxidation via flowing argon, which also flowed through the optical path within the PVC pipe to the radiometer lens. The radiometer interior was exposed to flowing dry synthetic air. These gases were allowed to flow for ∼6 h before measurements were taken. The furnace was held by a PID control algorithm at a set point soak temperature, and the back wall temperature of the cavity was measured to be 1185 °C using a Type B thermocouple junction placed in direct contact with it, before and after spectra were captured by the radiometer. Using Planck’s law (for spectral intensity) for that temperature, the radiometer was then calibrated for all evaluated wave lengths. These calibrations were then confirmed by measuring the spectral intensity of the cavity back wall at another known temperature (1263 °C) and comparing to the spectral intensities predicted by Planck’s law: the fit was acceptable, with λmax = 1.879 μm (using a 7th order polynomial fit, as described in the Sec. III), translating to a Wein’s displacement law temperature of 1269 °C.
Specimens first underwent oxidation in a MoSi2 furnace in stagnant air on a zirconia setter at 1500 °C for 1 h. At electrical contact surface locations, the oxide coatings on these samples were ground from the top and bottom surfaces of the thickened regions with dry 220-grit SiC sandpaper so that a low-resistance electrical connection could be made. A multimeter was used to measure resistance as a check on the progress of the oxide removal, with subohm readings being considered indicative of a fully cleaned surface. This method was preferred over the use of an oxidizing atmosphere during spectral intensity measurements, over concern of forming resistive oxide layers at the electrical contacts as the spectral measurements progressed.
Identical short-to-long wave length scans were conducted, one after the other, to characterize any changes over the time of the measurements. Each 1–6 μm scan, with a step size of 10 nm, required ∼30 min to complete.
Scanning electron microscopy (LEO 1550; Carl Zeiss Microscopy, Thornwood, NY) was performed using secondary electron imaging. Specimens were cut with diamond saw in cross section and then mounted in epoxy, followed by grinding and polishing steps. These surfaces were then sputter coated with gold (∼5–10 nm thick). Images were obtained at 15 kV. Elemental constituents were identified using energy dispersive spectroscopy (Oxford Instruments, Tubney Woods, UK).
III. RESULTS AND DISCUSSION
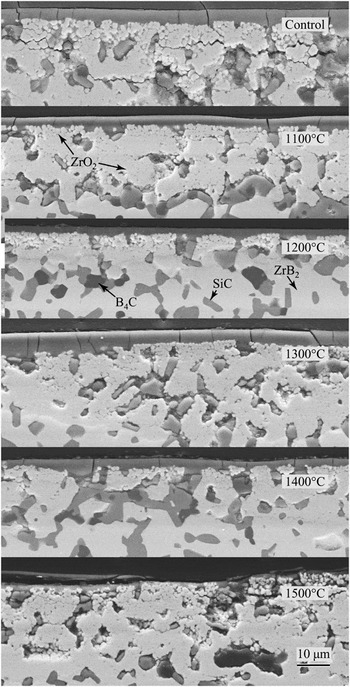
Microstructures of specimen cross sections after an initial oxidation in static air (at 1500 °C), followed by soaks at various temperatures in flowing argon for spectral intensity measurements, are shown in Fig. 2. As reported in our previous work,Reference Peng and Speyer16, Reference Peng, Van Laningham and Speyer17 after surface oxidation, a silicate surface layer covers a region of zirconia surrounded by silicate glass and/or porosity. Further below the surface, unchanged ZrB2, SiC, and B4C phases may be observed. Exposure to a low-oxygen environment during spectral intensity measurements did not appear to affect the near-surface microstructure. Oxide layers of ∼5–20 μm are seen in the micrographs. Variation in oxide layer thickness of this approximate range was also seen at differing locations along any given specimen’s cross section.
Secondary electron images of specimen cross sections after exposure to 1500 °C air (Control) and exposure to this oxidation heat treatment, followed by two scans of spectral intensity measurements in a flowing argon atmosphere at the indicated soak temperatures. The surfaces shown were those which faced the spectral radiometer. Phases (indicated in the figure) were identified with the assistance of elemental analysis from energy dispersive spectroscopy. Cracks in the microstructures are interpreted to have been induced by the diamond wafering saw in cutting specimens into cross sections.

Spectral intensities of specimens held at pyrometer-reported temperatures between 1100 and 1500 °C were collected for two consecutive 1–6 μm scans. An independent measure of specimen temperature was made using Wien’s displacement law. These data were interpreted as adequately gray as to reveal the correct Planck’s law-based λmax: for metallic solids, specific infrared absorption/emission wave length bands are not present. For dielectrics, the vibration resonance absorption bands are very broad relative to the measured 1–6 μm range and would not mask the maxima of the spectral intensity distributions, which in this temperature range would be comparatively sharp.
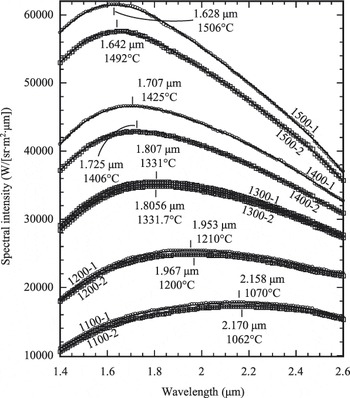
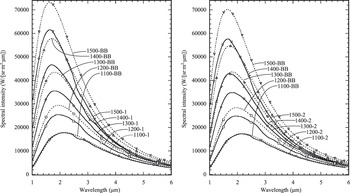
Location of the exact maximum was hampered by the finite digital precision of the spectral radiometer, giving identical spectral intensities for a number of data points near the maximum. Thus, data for the spectra in the 1.4–2.6 μm range (Fig. 3) were selected for polynomial least squares fits of spectral intensity data. This range bracketed the maxima for the five evaluated set point temperatures, yet avoided portions of the infrared spectrum significantly affected by absorption/emission of CO2 and H2O (discussed subsequently). Polynomial fits from 3rd order to 9th order were evaluated for optimum fit to the data; 7th order polynomials appeared to consistently yield R values closest to unity (KaleidaGraph; Synergy Software, Reading, PA). In the vicinities of the spectral intensity maxima, the polynomial fits showed only single maxima. Calculated blackbody temperatures for the first and second scans were not identical; deviations may be attributed to nongray changes in spectral emissivity of the specimens with time or nongray vapor deposits on the ZnSe window, effecting the two-color pyrometer measurement. The original data, along with the Planck’s blackbody distribution based on Wein’s displacement law-determined blackbody temperatures, are shown in Fig. 4.
Spectral intensity data collected at (two-color pyrometer) set point temperatures of 1100–1500 °C, and over the 1–6 μm spectral range, but restricted in this plot to 1.4–2.6 μm. Data are labeled based on set point soak temperatures and whether it was the first or second scan (e.g., 1100-1 indicates a set point hold temperature of 1100 °C and the first scan). Symbols indicate data, while solid curves indicate 7th order polynomial fits to the data sets (restricted to the 1.4–2.6 μm range). The maximum of these polynomials were numerically determined and are labeled, along with the corresponding Wein’s displacement law-determined blackbody temperatures.

Spectral intensity data (solid curves) collected at (two-color pyrometer) set point soak temperatures of 1100–1500 °C. The left plot displays first scan results (e.g., 1100-1), while the right plot displays second scan results (e.g., 1100-2). Dashed curves indicate Planck’s law distributions for temperatures determined based on Wein’s displacement law (labeled corresponding to the set point temperatures of corresponding spectral intensity data). Corresponding data and blackbody curves have the same marker symbols; these symbols do not represent individual data points.

Using corrected first scan spectral intensity evaluation temperatures of 1069.8, 1210.4, 1330.7, 1424.6, and 1506.5 °C, the percentages of the blackbody distribution (based on integrated areas of Planck’s law) within the measured 1–6 μm range were 85.45%, 87.65%, 88.69%, 89.04%, and 89.05%, respectively. Thus, this spectral range represents the vast majority of emitted radiation at these temperatures.
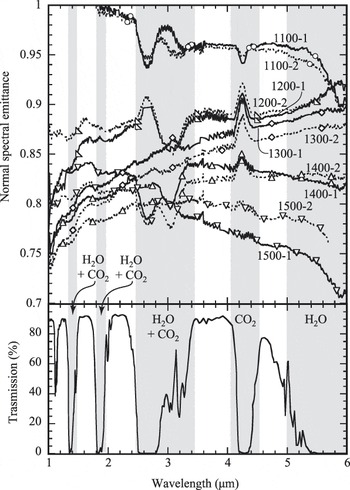
Spectral emittances were calculated by the ratio of measured spectral intensities to Planck blackbody spectral intensities generated via insertion of Wein’s displacement law-determined temperatures (Fig. 5). Distortions in the spectral emittance data are apparent in regions in which CO2 and H2O absorption (cold gas) and emission (hot gas) occur (see atmospheric transmission data18 in the lower part of the figure). This is most apparent in the 2.48–3.45 and 4.05–4.55 μm ranges. Clearly, the methods used at atmosphere conditioning were inadequate to fully remove CO2 and H2O from the optical path. Spectral emissivity data for the 1100 °C soak at wave lengths below 1.8 μm were in excess of unity, which of course is not possible. This can be attributed to the relatively small signal for this temperature and wave length range, increasing the uncertainty in determining the Wein’s displacement law blackbody temperature.
Normal spectral emittances calculated from the ratio of measured normal spectral intensities to blackbody spectral intensities generated from Planck’s law. Plotted below is the spectral transmittance through 1 km of sea-level atmosphere,18 in which spectral bands of absorption are due to H2O and/or CO2 gases, as labeled in the figure. Based on this, spectral bands of 1.00–1.32, 1.48–1.80, 1.97–2.48, 3.45–4.05, and 4.55–5.00 μm are interpreted as free from interference from H2O and CO2 gases; the remaining spectral bands are gray shaded. Spectral emittances of 1100-1 and 1100-2 specimens exceeded unity at wave lengths below 1.8 μm, reaching values of ∼1.16 at 1.0 μm. These data were truncated to facilitate a more magnified view of the remaining data.

An increasing spectral emittance with increasing wave length is expected for the for the 1–6 μm range for a dielectric coating (see Sec. I). Ignoring spectral ranges in which there was CO2/H2O interference, an upward trend (Fig. 5) in spectral emittance occurred for 1200-1, 1200-2, 1300-1, 1300-2, and 1400-2. For 1400-1 and 1500-2, there was a reversal to a slight decreasing trend at wave lengths above 4 μm. The 1100-1, 1100-2, and 1500-1 specimens showed a decreasing trend through larger portions of the measured spectrum. The trend in spectral emissivity with wave length is sensitive to the selected blackbody temperature used in Planck’s law: as can be visualized using Fig. 4, adoption, e.g., of a lower blackbody temperature, moves λmax to longer wave lengths, increasing the spectral emittance overall (because the Planck distribution is of lower intensity). This occurs to a greater extent for wave lengths shorter than λmax (the rightward shift in the Planck distribution brings it closer to the experimental spectral intensity data for wave lengths less than λmax). This would potentially force a downward trend in spectral emittance with increasing wave length in the 1–6 μm range. Thus, the cases in which downward trends in spectral emittance with increasing wave length are observed may have resulted from inaccuracies in the identification of λmax.
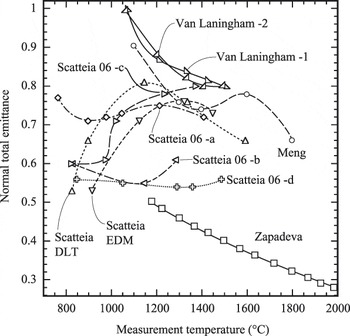
Spectral emittances were averaged over the measured 1–6 μm range, omitting the regions of the spectrum in which H2O and CO2 emission/absorption affected the spectra (see caption to Fig. 5) to determine total emittances. These are plotted in Fig. 6, along with literature data. Total emittances, measured in this work to be in the range of 0.80–1.00, imply that these materials, which naturally oxidize in service as UHTCs, will efficiently dispose of thermal energy by radiation. The decrease in total emittance with increasing temperature is consistent with dielectrics, implying that the oxide coatings dominated the emissive behaviors of the ribbons. On the scale shown, there was little difference between the total emittances calculated from first and second scan spectral intensity data.
Averaged emittances of first and second scan ribbons as a function of Wein’s displacement law-determined soak temperatures (Van Laningham −1, Van Laningham −2). Averaged emittances were calculated from portions of the 1–6 μm spectrum, which should not have been effected by H2O and CO2 atmospheric absorption/emission (spectral regions in Fig. 4 that are not gray shaded: 1.00–1.32, 1.48–1.80, 1.97–2.48, 3.45–4.05, and 4.55–5.00 μm). These data are plotted along with results from the literature: MengReference Meng, Chen, Hu and Wang14: ZrB2–20 vol% SiC–15 vol% C, ZapadaeviaReference Zapadaeva, Nikolaeva, Ordan’yan and Petrov15: ZrB2–10 wt% LaB6, Scatteia et al.Reference Scatteia, Alfano, Monteverde, Sans and Balat-Pichelin12: ZrB2–15 vol% SiC [electrical discharge machining (EDM) indicates a rougher surface, diamond-loaded tooled (DLT) indicates a smoother surface]. Scatteia 06-a: Sintered ZrB2–SiC 200 MPa air, Scatteia 06-b: Sintered ZrB2–SiC 10−3 MPa air, Scatteia 06-c: plasma-sprayed ZrB2–SiC 200 MPa air, Scatteia 06-d: plasma-sprayed ZrB2–SiC 10−3 MPa air.Reference Scatteia, Cooosentino, Cantoni, Balat-Pichelin, Beche and Sans13

The Zapadaeva et al.Reference Zapadaeva, Nikolaeva, Ordan’yan and Petrov15 data in Fig. 6 display substantially lower emittances than the others shown. These measurements were taken at a single wave length, 0.65 μm, which is in the visible spectrum. Comparisons with total infrared spectral emittances are tenuous. The Scatteia et al.Reference Scatteia, Alfano, Monteverde, Sans and Balat-Pichelin12 radiation measurements were performed on unoxidized specimens in weak vacuum (10 Pa), after which the authors showed that surface oxidation had occurred in situ. The increase in emittance between ∼825–1150 °C was likely from increased extent of surface oxidation with increasing evaluation temperature. Smoother-surfaced specimens displayed lower emittances (as expected) until ∼1300 °C, at which point the oxide layer dominated the radiative behavior. The decreasing emittance with temperatures increasing above 1300 °C is typical of the behavior of a dielectric, implying that the oxide layers dominated the radiant behavior. In the other Scatteia et al. study,Reference Scatteia, Cooosentino, Cantoni, Balat-Pichelin, Beche and Sans13 the authors argued that sintered unoxidized ZrB2–SiC exposed to 200 Pa air had a higher total emittance than sintered unoxidized ZrB2–SiC exposed to 10−3 Pa air because of the higher emittance oxide coating which formed when exposed to the higher oxygen partial pressure. It was argued that the plasma-sprayed coatings of unoxidized ZrB2–SiC exposed to 200 MPa air showed lower total emittances than sintered samples because the latter had higher a surface roughness. As the surfaces oxidized to greater extents with increasing soak temperatures, this effect was attenuated. For the plasma-sprayed ZrB2–SiC exposed to air at 10−3 Pa, the resulting unoxidized surface showed little variation in total emissivity with temperature. The Meng et al.Reference Meng, Chen, Hu and Wang14 data for preoxidized specimens show a high total emittance at 1100 °C, decreasing (inconsistently) with increasing temperature, as expected. These data are comparatively close to the results obtained herein. The graphite content in their specimens may have contributed to the comparatively higher measured total emittances.
IV. CONCLUSIONS
The spectral emittances of fully dense preoxidized ZrB2–30 mol% SiC–6 mol% B4C were measured over 1–6 μm at set point temperatures of 1100–1500 °C in 100 °C increments, using two consecutive scans. Specimen temperatures were determined by Wein’s displacement law. Near-surface specimen microstructures appeared largely unaltered from exposure to soak temperatures of ∼1100–1500 °C in flowing argon. Averaged spectral emittances in spectral regions not affected by CO2 and H2O absorption showed total emittances decreasing from 1.0 at 1100 °C to 0.8 at 1500 °C. These results were compared to other total emittance studies of ZrB2–SiC-based materials.
ACKNOWLEDGMENTS
This project was funded by the Air Force Office of Scientific Research, Contract FA9550-08-1-0408. The authors would like to express their appreciation for the helpful suggestions and support of their contract monitor, Dr. Ali Sayir.