There are some neurodevelopmental disorders that affect children and often continue into adolescence and adulthood. ADHD is one of the most prevalent of these, with prevalence that ranges from 5.9 to 7.2% (Dalsgaard et al., Reference Dalsgaard, Thorsteinsson, Trabjerg, Schullehner, Plana-Ripoll, Brikell, Wimberley, Thygesen, Madsen, Timmerman, Schendel, McGrath, Bo Mortensen and Pedersen2019; Polanczyk et al., Reference Polanczyk, Salum, Sugaya, Caye and Rohde2015; Thomas et al., Reference Thomas, Sanders, Doust, Beller and Glasziou2015). Moreover, this disorder is more common in boys than girls and affects all areas of a person’s development, with particular impact in family, social and academic or work contexts (Bruchmüller et al., Reference Bruchmüller, Margraf and Schneider2012; Rodríguez et al., Reference Rodríguez, González-Castro, García, Núñez and Álvarez2014). In this sense, in order to facilitate the diagnostic process of this disorder, different manuals and guides have defined the symptoms of ADHD. As an example, ADHD appears in the new International Statistical Classification of Diseases and Related Health Problems (CIE–11) from the World Health Organization (WHO), 2018, as part of Neurodevelopmental Disorders. In this guide, in line with other diagnostic manuals such as the DSM–5 (American Psychiatric Association [APA], 2013), ADHD is characterized by persistent attentional problems, difficulty in controlling impulses, and hyperactivity, leading to three presentations of ADHD (depending on the predominance of one symptom or other): The combined presentation, the predominantly inattentive presentation, and the predominantly impulsive-hyperactive presentation (WHO, 2018). Additionally, DSM–5 also states as an important criterion, that there must be a clear evidence that the symptoms interfere with, or reduce the quality of social, school, or work functioning.
A recent study by Balbuena Rivera (Reference Balbuena Rivera2016) indicated that the diagnosis of this disorder had great repercussions in the social/family and school environment. In this regard, there are many international studies (Barnard-Brak & Brak, Reference Barnard-Brak and Brak2011; Currie et al., Reference Currie, Stabile and Jones2013; Frazier et al., Reference Frazier, Youngstrom, Glutting and Watkins2007; Langberg & Becker, Reference Langberg and Becker2012) showing how people with ADHD usually present higher rates of academic and school failure compared to those without the disorder. In fact, when working with children and adolescents with ADHD, it is common to observe high rates of academic failure, repetition of school years, and great incidence of learning difficulties (Frazier et al., Reference Frazier, Youngstrom, Glutting and Watkins2007). In this way, several studies along these lines have raised the hypothesis that learning difficulties together with ADHD symptoms act as additional obstacles for students to overcome their difficulties, and therefore increase the likelihood of school drop-out (Fried et al., Reference Fried, Petty, Faraone, Hyder, Day and Biederman2016; Ingrum, Reference Ingrum2006).
Regarding the etiological models about ADHD, they refer to diverse factors which may be genetic, neurochemical, neuroanatomical, or psychological and socio-cultural. About psychological and socio-cultural factors, various authors have advocated for a holistic view of the disorder, in contrast to the view that is mainly focused on biological factors. This more holistic view considers elements that play a role in the social environment that surrounds and underlies the diagnosis, such as the capacity for self-control, learning styles, the characteristics of the subject’s upbringing, or their temperament (e.g., Nilsson-Sjöberg, Reference Nilsson-Sjöberg2018; Pérez-Álvarez Reference Pérez-Álvarez2017, Reference Pérez-Álvarez2018). Other models, like the Dual Model (Sonuga-Barke, Reference Sonuga-Barke2003), which resulted from the development of the Delay Aversion Model (Sonuga-Barke et al., Reference Sonuga-Barke, Taylor, Sembi and Smith1992), stated the existence of two types of deficit in ADHD (Rodríguez et al., Reference Rodríguez, Areces, García, Cueli and González-Castro2018): A deficit at the cognitive level (executive functions) and a deficit at the motivational level (difficulties in delaying gratifying or potentially reinforcing results and in maintaining attention over long periods of time).
However, despite the presence of various etiological models about the causes of ADHD, all of them coincide in pointing out that its symptoms are often seen, in turn, associated with difficulties at an academic, family, behavioral and social level (Puddu et al., Reference Puddu, Rothhammer, Carrasco, Aboitiz and Rothhammer2017). In this sense, it is important to highlight that symptomatology of ADHD are worse when ADHD is combined with other disorders, such as anxiety or depression (González-Castro et al., Reference González-Castro, Rodríguez, Cueli, García and Álvarez-García2015; Nadeau et al., Reference Nadeau, Jacob, Keene, Alderman, Hacker, Cavitt, Alvaro and Storch2015), behavioral or conduct disorders (Bussing et al., Reference Bussing, Mason, Bell, Porter and Garvan2010; Caci et al., Reference Caci, Doepfner, Asherson, Donfrancesco, Faraone, Hervas and Fitzgerald2014; García et al., Reference García, González-Castro, Areces, Cueli and Rodríguez2014). As a result, the presence of comorbid disorders that come associated with ADHD commonly lead to a functional impairment which has a negative impact on the level of life satisfaction, the perception of quality of life, and both psychological and social well-being in people who suffer this disorder (Hernández Martínez et al., Reference Hernández Martínez, Pastor, Pastor, Boix and Sans2017; Peasgood et al., Reference Peasgood, Bhardwaj, Biggs, Brazier, Coghill, Cooper, Daley, De Silvas, Harpin, Hodgkins, Nadkarnis, Setyawan and Sonuga-Bark2016).
Quality of life perception refers to a person’s self-assessment of their position in life (Danckaerts et al., Reference Danckaerts, Sonuga-Barke, Banaschewki, Buitelaar, Döpfner, Hollis, Santosh, Rothenberger, Sergeant, Steinhausen, Taylor, Zuddas and Coghill2010). This assessment can be done by considering a person’s external conditions, such as their income level or their home. Or it can be defined in a more subjective way, commonly called life satisfaction. This second component refers to internal judgments about one’s life in relation to satisfaction in general and in specific domains, such as family environment, school, or friends (Alfaro Inzunza et al., Reference Alfaro Inzunza, Guzmán Piña, García Gómez, Sirlopú Díaz, Oyanedel Sepúlveda and Gaudlitz Ruiz2015; Huebner, Reference Huebner2004; Seligson et al., Reference Seligson, Huebner and Valois2003).
To date, there are few studies on quality of life or life satisfaction in childhood and adolescence compared to adulthood, and research on the relationship between life satisfaction and ADHD is very limited, especially at younger ages (Barfield & Driessnack, Reference Barfield and Diessnack2018; Nadeau et al., Reference Nadeau, Jacob, Keene, Alderman, Hacker, Cavitt, Alvaro and Storch2015; Ogg et al., Reference Ogg, Bateman, Dedrick and Suldo2016). However, in clinical and educational contexts it is common for families to refer to the discomfort caused by ADHD symptoms both in the person who suffers from the disorder and in the other members of the family (Peasgood et al., Reference Peasgood, Bhardwaj, Biggs, Brazier, Coghill, Cooper, Daley, De Silvas, Harpin, Hodgkins, Nadkarnis, Setyawan and Sonuga-Bark2016), and some correlations have been found between life satisfaction and the estimation of symptoms of hyperactivity, impulsivity and inattention by parents and teachers (Danckaerts et al., Reference Danckaerts, Sonuga-Barke, Banaschewki, Buitelaar, Döpfner, Hollis, Santosh, Rothenberger, Sergeant, Steinhausen, Taylor, Zuddas and Coghill2010). Within this context, children and adolescents with ADHD tend to assess their life satisfaction more negatively than those who do not have the disorder (Danckaerts et al., Reference Danckaerts, Sonuga-Barke, Banaschewki, Buitelaar, Döpfner, Hollis, Santosh, Rothenberger, Sergeant, Steinhausen, Taylor, Zuddas and Coghill2010). These differences are reflected in components such as their view of the state of their lives, their physical well-being, self-esteem and school performance (Hernández Martínez et al., Reference Hernández Martínez, Pastor, Pastor, Boix and Sans2017).
Thus, it seems important to analyze the life satisfaction of children and adolescents with ADHD as a part of the assessment/diagnosis process. In other words, including in this process a life satisfaction measure that takes into account perceptions from both the children’s perspectives, to understand their personal needs (Barfield, Reference Barfield2018; Barfield & Driessnack, Reference Barfield and Diessnack2018), and from the adults’ perspectives (i.e., primarily parents), since they are involved in the context of children's lives and they are key in the diagnostic processes for ADHD (Ogg et al., Reference Ogg, Bateman, Dedrick and Suldo2016). Also, given the subjective and individual nature of the perception of life satisfaction, and the introspective effort involved in its analysis, authors such as Hernández Martínez et al. (Reference Hernández Martínez, Pastor, Pastor, Boix and Sans2017) have pointed out the need to obtain information from different sources. As Hennig et al. (Reference Hennig, Koglin, Schmidt, Petermann and Brähler2017, p. 1) indicated, “to improve treatment, it is crucial to understand the mechanisms that link the symptoms of ADHD with the reduction of satisfaction with life" and know the variables that influence this situation. Thus, the important role of those who share time and spaces with children and adolescents, mainly parents, in obtaining a clearer picture of these mechanisms and the related variables.
In relation to the perception of children and their parents, children and adolescents tend to rate life satisfaction as more positive than their families or teachers, probably because they tend to show positive biases in this sense to maintain their self-image (Miranda-Casas et al., Reference Miranda-Casas, Presentación-Herrero, Colomer-Diago and Roselló-Miranda2011). Moreover, parents rate children’s and adolescent’s future academic/work prospects more negatively. The study by Caci et al. (Reference Caci, Doepfner, Asherson, Donfrancesco, Faraone, Hervas and Fitzgerald2014) noted that 69% of parents of children with ADHD believed that their children could have achieved better results at school if they had not suffered from the disorder. School is the area that seems to be most related to the worst perception of life satisfaction in people with ADHD (Barfield, Reference Barfield2018; Nadeau et al., Reference Nadeau, Jacob, Keene, Alderman, Hacker, Cavitt, Alvaro and Storch2015) and in fact usually provokes feelings of frustration in these children and adolescents (Caci et al., Reference Caci, Doepfner, Asherson, Donfrancesco, Faraone, Hervas and Fitzgerald2014).
Regarding the type of ADHD, it seems that life satisfaction worsens as symptoms related to inattention and hyperactivity/impulsivity increase, affecting all domains of an individual´s life (Danckaerts et al., Reference Danckaerts, Sonuga-Barke, Banaschewki, Buitelaar, Döpfner, Hollis, Santosh, Rothenberger, Sergeant, Steinhausen, Taylor, Zuddas and Coghill2010; Miranda-Casas et al., Reference Miranda-Casas, Presentación-Herrero, Colomer-Diago and Roselló-Miranda2011). Nevertheless, other studies such as Gudjonsson et al. (Reference Gudjonsson, Sigurdsson, Smari and Young2009) and Ogg et al. (Reference Ogg, Bateman, Dedrick and Suldo2016), with similar samples, or Shi et al. (Reference Shi, Liu, Sun and Wang2018), with adult samples, found that only inattention symptoms affect ADHD people´ life satisfaction. Likewise, when ADHD is associated with behavioral disorders, life satisfaction is perceived as more negative by children/adolescents and parents, since behavioral problems increase the risk of rejection by peers, worse academic achievement, and may also harm self-esteem (Bussing et al., Reference Bussing, Mason, Bell, Porter and Garvan2010).
Other variables that could have a significant effect on life satisfaction are age, gender or pharmacological support status. Age because, as we grow older, life becomes more complex and fuller of obligations, which have shown a negative relationship with life satisfaction (Hennig et al., Reference Hennig, Koglin, Schmidt, Petermann and Brähler2017). Regarding gender, previous studies such as Oerbeck et al. (Reference Oerbeck, Overgaard, Pripp, Aase, Reichborn-Kjennerud and Zeiner2019) found that women with more aggravated symptomatology of ADHD showed worse levels of satisfaction with life. Lastly, the pharmacological support status. Although studies such as Barfield (Reference Barfield2018) did not find differences in children’s life satisfaction with school between medicated and non-medicated children, it is interesting to continue investigating this question, since it would be useful to know the impact of medication, not only on behavior but also on the perception of life satisfaction of children and parents, and in order to analyze the real benefits of the use of common pharmacological support for this disorder.
Instead of pharmacological support, one of the main alternatives recommended for ADHD is behavioral treatment (Caye et al., Reference Caye, Swanson, Coghill and Rohde2019). In general, it is considered a first-line treatment for very small children or children with light to moderate ADHD, or as a standard complementary treatment along with medication in more severe cases at any ages (Wolraich et al., Reference Wolraich, Hagan, Allan, Chan, Davison, Earls, Evans, Flinn, Froehlich, Frost, Holbrook, Lehmann, Lessin, Okechukwu, Pierce, Winner and Zurhellen2019). However, although behavioral treatment is the most commonly-used psychological treatment in children and adolescents (Caye et al., Reference Caye, Swanson, Coghill and Rohde2019; Danielson et al., Reference Danielson, Bitsko, Ghandour, Holbrook, Kogan and Blumberg2018), only around 31% of families of children with ADHD have received this kind of treatment compared to 91% who have received pharmacological support at least once during the progression of the disorder (Danielson et al., Reference Danielson, Bitsko, Ghandour, Holbrook, Kogan and Blumberg2018).
Summarizing, the main objective of this study is to examine perceived life satisfaction (general and different life aspects) in a sample of children and adolescents with ADHD, based on parents’ information and self-reports. As secondary objectives, firstly, we aim to establish comparisons between the information provided by the different informants (parents and children/adolescents) in relation to perceived life satisfaction and to establish the aspects of life that are most related to their evaluations. Secondly, we intend to analyze the influence of ADHD presentation and comorbid CD symptoms, age, gender, and pharmacological support status on parents’ and children’s/adolescents’ perceptions of life satisfaction of the children, and to provide an estimation of the value of these variables in predicting a composite score of child/adolescent general life satisfaction.
The principal starting hypotheses are that parents will have a worse perception of life satisfaction than their children; that the lowest scored area in all cases will be school, that comorbidity with CD will reduce perceived life satisfaction, and the older the children are, the lower the life satisfaction. On the other hand, gender and pharmacological support status are not expected to influence parents’ or children’s/adolescents’ perceptions of life satisfaction.
Method
Participants
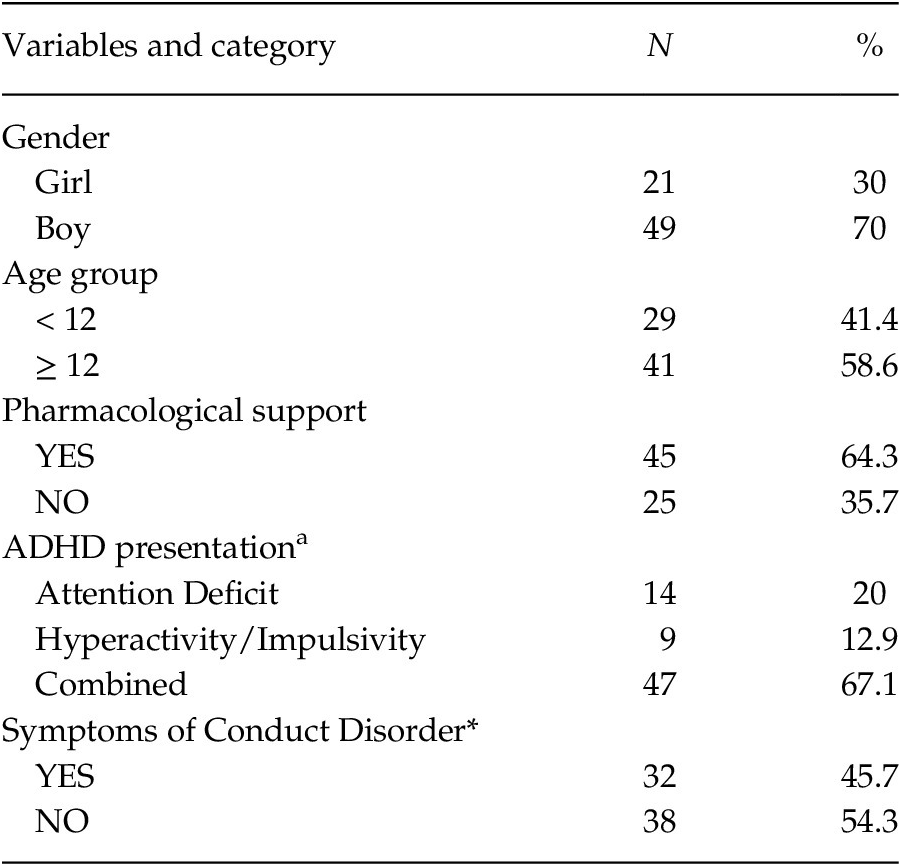
An incidental sample of 70 children and adolescents with formal diagnoses of ADHD and their parents participated in the study (30% girls). The children’s ages ranged from 7 to 16 years old (M = 12.21, SD = 2.85) and mean IQ was 103.20 (SD = 14.02). Most of the students were receiving pharmacological support (psychostimulants) at the time of the evaluation (64.3%) and presented the combined presentation of the disorder (ADHD-C = 67.1%). About 45% of them also showed symptoms of Conduct Disorder (CD). Two groups of students were established, based on age, for further analyses: Under 12 years old and 12 and over. We chose this age as the criterion to split the sample because in Spain it commonly means the transition to secondary school, where students have new behavioral and cognitive challenges and demands. It is also an especially sensitive stage for emotional and social development, as well as for building attitudes towards learning (e.g., Hill et al., Reference Hill, Mammarella, Devine, Caviola, Passolunghi and Szűcs2016). The socioeconomic level of the participants’ families was between medium and low and the families’ educational attainment was mainly low (basic qualifications). The participants attended schools located in urban and semi-urban zones from a region in the north-west of Spain. Table 1 provides a detailed description of the sample.
Characteristics of the Sample of Children/Adolescents (N = 70)

Note. a Over percentile 90 in the scales from EDAH.
Inclusion and Exclusion Criteria
The participating children and adolescents attended different private and state primary and secondary schools in northern Spain, although they were all recruited from different neuropsychology hospital units from where they were receiving treatment and where they had had their ADHD diagnosed. Once the researchers informed clinical centers about the objectives and the requirements of this study, those that were interested indicated their agreement to collaborate.
The ADHD sample was identified by mental-health professionals (typically one or more psychiatrists-neurologists) using these criteria: (a) Clinical diagnosis of ADHD according to the Diagnostic and Statistical Manual of Mental Disorders–5 (APA, 2013); (b) symptoms duration of more than 1 year; (c) the problem began before the age of 7; and, (d) the children had no associated disorders that could explain ADHD symptoms better (participants who presented a cognitive deficit, Asperger’s syndrome, Guilles de LaTourette syndrome, or extensive anxiety or depressive disorders were excluded from the study), and (e) participants with extreme IQ scores (lower than 70 or greater than 130) according to the Wechsler Scale (WISC–IV; Wechsler, Reference Wechsler2005), were excluded. As part of their diagnosis, students were identified as showing one of the three ADHD presentations – inattention, hyperactivity/impulsiveness, or the combined presentation.
The clinical diagnosis was confirmed by a trained psychology researcher using ADHD clinical diagnosis interview. Participants with any subtype of ADHD (hyperactive-impulsive, inattentive, combined hyperactive-inattentive) were eligible. The children with ADHD were either medication naïve or using psychostimulant medication.
Measures
First, the Multidimensional Scale of Life Satisfaction for Students (BMSLSS; Seligson et al., Reference Seligson, Huebner and Valois2003) was administered to the children and adolescents in order to collect their level of perceived satisfaction with their life in general and in five domains (family, friends, school, oneself –self-concept–, and community and living place). It consists of five items, each assessing the degree of satisfaction with each domain, on a Likert Scale from 1 (horrible) to 7 (wonderful): “I would describe my family life as…”. The items are presented in a positive format, so that the higher the score, the greater the perceived satisfaction. Previous studies with Spanish samples have reported reliability coefficients between .75 and .85 for the scale (Giménez, Reference Giménez2010). Reliability in the present sample was .75.
Second, the Multidimensional Scale of Life Satisfaction for Parents, adapted from the BMSLSS for parents (Miranda-Casas et al., Reference Miranda-Casas, Presentación-Herrero, Colomer-Diago and Roselló-Miranda2011) was used. This form has the same structure as the scale for children, comprising 5 Likert-type items, with responses from 1 (horrible) to 7 (wonderful): “I think that my child perceives family life as…”. Previous studies in Spain have reported a reliability coefficient of .85 for the whole scale (Miranda-Casas et al., Reference Miranda-Casas, Presentación-Herrero, Colomer-Diago and Roselló-Miranda2011). Reliability in the present sample was .65. To provide a deeper analysis of children’s and adolescents’ situations, we included seven additional items (completed by parents) related to the degree of interference of the disorder in different spheres of life, and the severity and persistence of the problem. The first item refers to the severity of the problem and ranges from 1 (no difficulties) to 4 (severe difficulties). The second item is about the persistence of difficulties, from 1 (less than one month) to 4 (more than one year). The next 4 items assess the degree of interference or discomfort these difficulties cause in the child/adolescent, in terms of interference in home life, friendships, school learning, and leisure time and activities (i.e., “how much do the difficulties showed by the child/adolescent interfere in the following contexts?”; from 1 = not at all, to 4 = absolutely). The last item evaluates the extent to which these difficulties are considered a burden for the family, following the same scale as the last four items.
Third, the EDAH Scale (Evaluation of Deficit of Attention and Hyperactivity) (Farré & Narbona, Reference Farré and Narbona1997) was administered to families. It has 20 items that assess the frequency with which children and adolescents show behaviors related to attention deficit, hyperactivity/impulsivity, and CD (from 0 = never, to 4 = always). The scale provides an estimate of the possible presence of ADHD and its 3 presentations according to DSM–5 (APA, 2013). The reliability of the scale, as reported in previous studies in Spanish samples, is high (α = .85) (Sánchez et al., Reference Sánchez, Ramos, Díaz and Simón2010). This scale was used to verify the prior clinical diagnosis of ADHD, examine the type of presentation of the disorder and establish the presence of associated CD symptoms. Only those participants who scored in or above the 90th percentile in any of the attentional sub-scales of the test were included in the study. The same cut-off point was used to establish the presence or absence of CD symptoms in the sample.
Lastly, the Wechsler Scale (WISC–IV; Wechsler, Reference Wechsler2005) was administered. This scale evaluates the intellectual abilities of children and adolescents (6–16 years, 11 months), and offers a total IQ (intellectual quotient) value. It is made up of 15 tests grouped in four indices: Verbal Comprehension, Perceptual Reasoning, Working Memory and Processing Speed. This scale was individually administered to each participant. Those whose IQ values were below 85 or over 115 (+/– one SD) were excluded from further data analysis (a total of 25 students were excluded, resulting in the final sample of 70).
Procedure
The study had the approval of the pertinent Ethics Committee. After providing informed consent, participants completed two self-report measures (EDAH and BMSLSS) and the Wechsler Scale, while families completed the adaptation of the BMSLSS for parents. The evaluations were conducted in two laboratory sessions (1 hour each). A member of the research group contacted the participants and supervised the assessment process. Participants provided written informed consent after receiving a comprehensive description of the study protocol and assurances of anonymity. In the case of participants over 16 years old, the consent of both the parents and the adolescent were requested. Both students and families scored in all the scales, therefore there was no missing data in the present dataset.
Data Analyses
Initially, in order to obtain a general profile on life satisfaction, we calculated the descriptive statistics (Mean, Typical Deviation, Skewness and Kurtosis) of the total score and five components on the life satisfaction scales for parents and children/adolescents (Table 2). Kline's criterion (Reference Kline2011) was used, according to which the maximum scores accepted for skewness and kurtosis range between 3 and 10 in order to perform parametric analyses. The additional 7 items completed by families (severity, persistence and interference), were analyzed by means of frequency analysis. We also performed Pearson correlations to determine the association between the study variables and the agreement between parents’ and children’s/adolescents’ reports. Next, we used MANCOVAs to analyze differences in the five areas of life satisfaction (reported by families and by children/adolescents) as a function of age group, gender, pharmacological support status, ADHD presentation, and the presence of CD symptoms (Table 3), taking IQ as a covariate. Bonferroni´s formula was used to correct Type I error. Lastly, to determine the contribution of the variables that were statistically significant in this step in predicting general life satisfaction, we created a composite score for this variable based on both parents’ and children’s/adolescents’ reports [TOT SAT = parent total satisfaction + student total satisfaction)/2]. The composite score was created to capture a general picture of the family environment (e.g., Ogg et al., Reference Ogg, Bateman, Dedrick and Suldo2016), beyond the separate perceptions of the children/adolescents and/or parents. Once previous conditions for conducting these analyses had been reviewed (correlation between variables, skewness and kurtosis), a hierarchical linear regression was carried out, including the covariates age, gender, IQ, and previous mental disorders/learning difficulties in the first block, and Conduct Disorder symptoms in the second block, as this was the variable that led to notable differences in previous studies (Table 4).
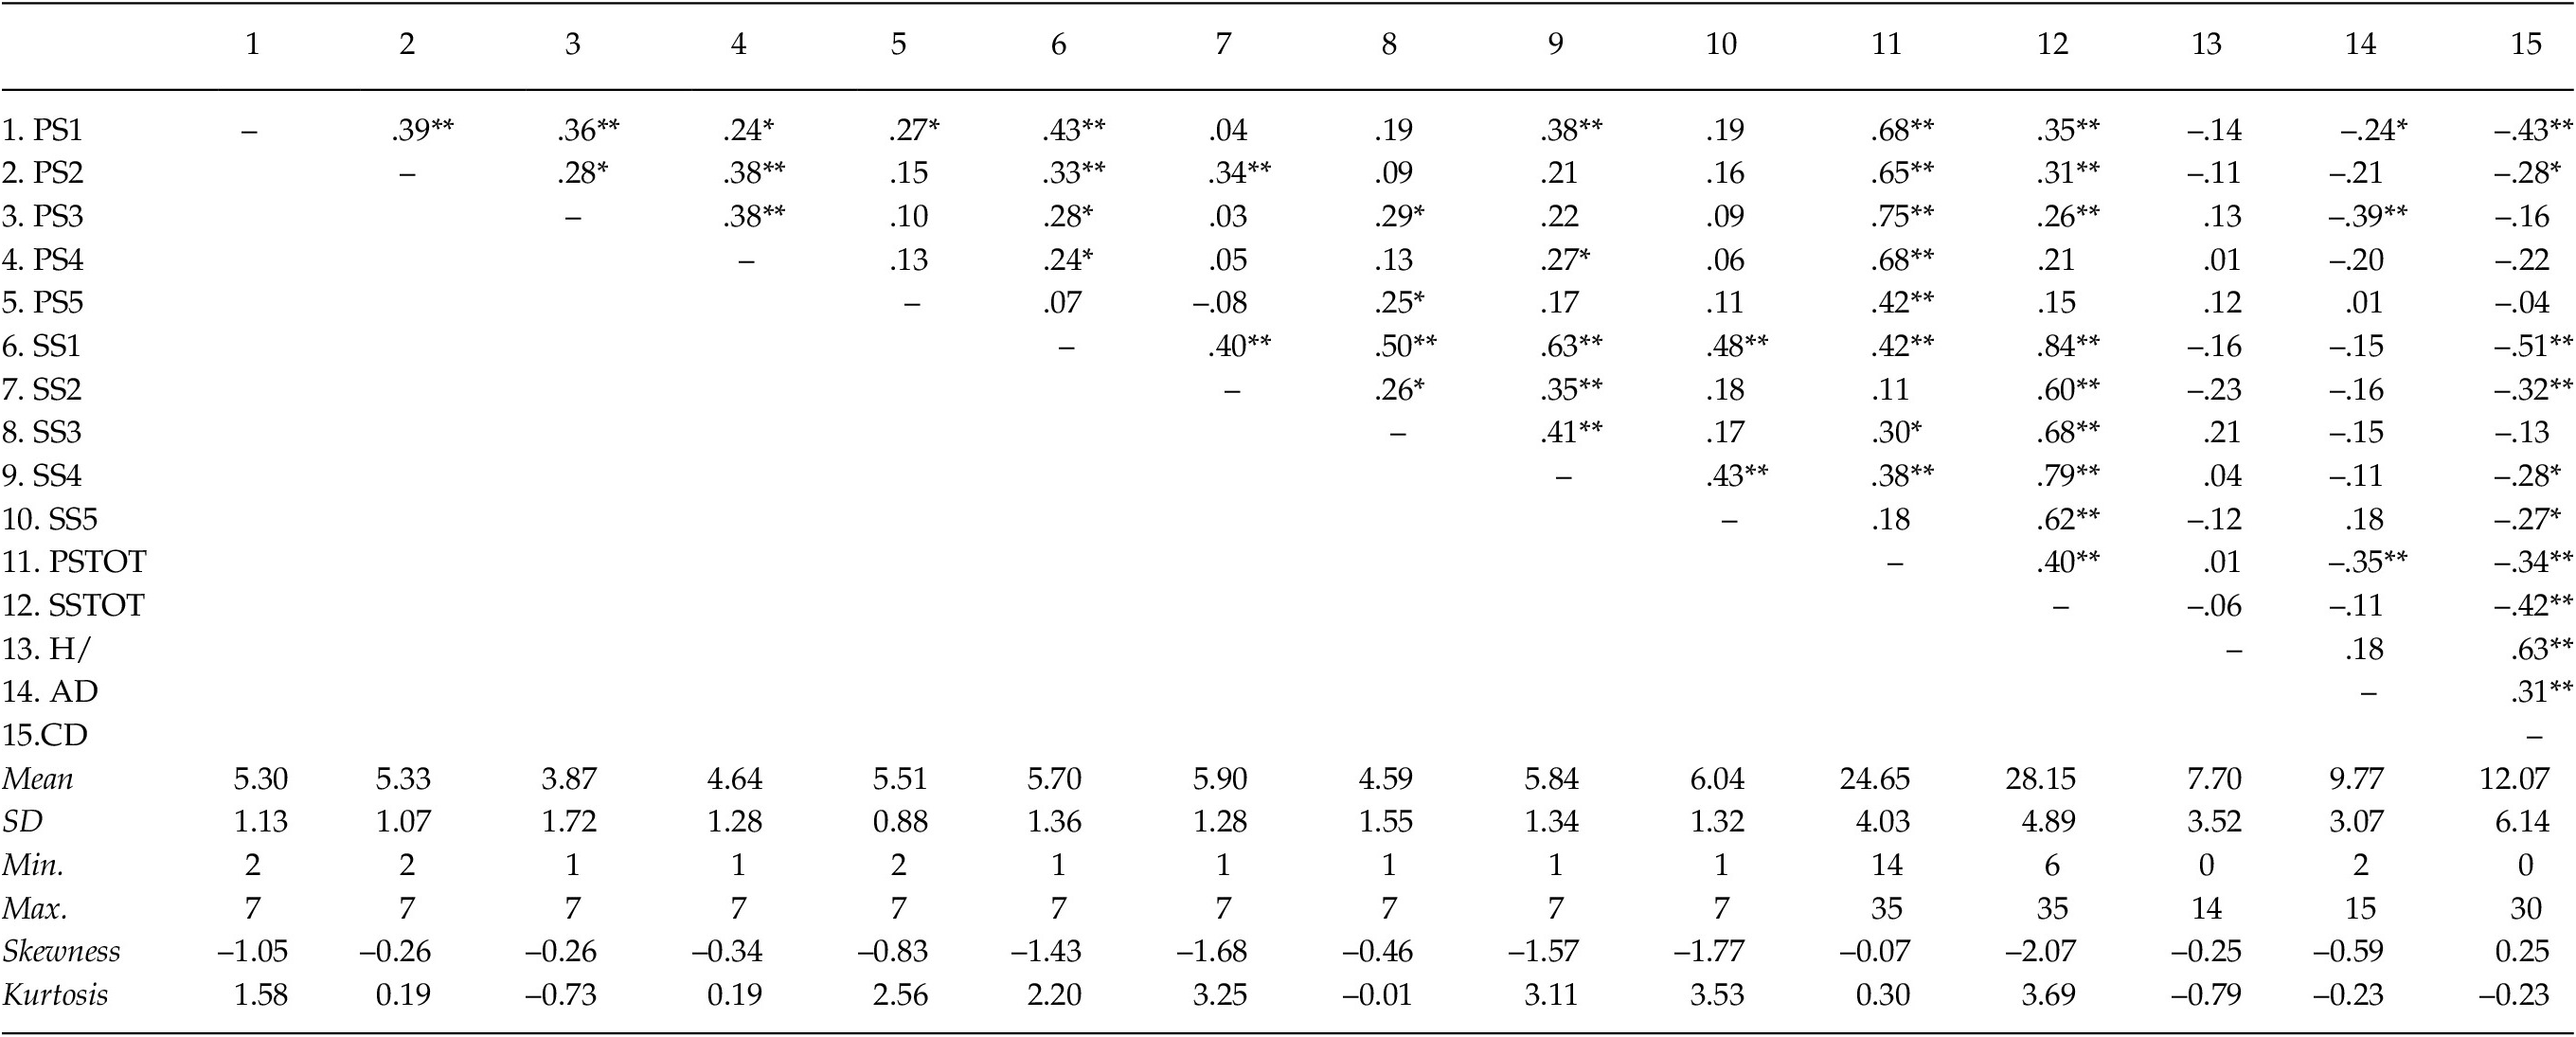
Pearson’s Bivariate Correlations of the Variables Studied

Note. PS1 = Parent-reported satisfaction of the student’s life- Item 1(family); PS2 = Parent-reported satisfaction of the student’s life- Item 2(friends); PS3 = Parent-reported satisfaction of the student’s life- Item 3(school); PS4 = Parent-reported satisfaction of the student’s life- Item 4 (self); PS5 = Parent-reported satisfaction of the student’s life- Item 5 (community and place of living); SS1 = Student satisfaction scale Item 1(family); SS2 = Student satisfaction scale- Item 2(friends); SS3 = Student satisfaction scale- Item 3(school); SS4 = Student satisfaction scale- Item 4 (self); SS5 = Student satisfaction scale- Item 5 (community and place of living); PSTOT = Parent-reported satisfaction of the student’s life- Total score; SSTOT = Student satisfaction scale- Total score; H/I = hyperactivity/impulsivity symptoms from EDAH; AD = attention deficit symptoms from EDAH; CD = Conduct Disorder symptoms from EDAH.
**p < .01 (2-tailed). *p < .05 (2-tailed).
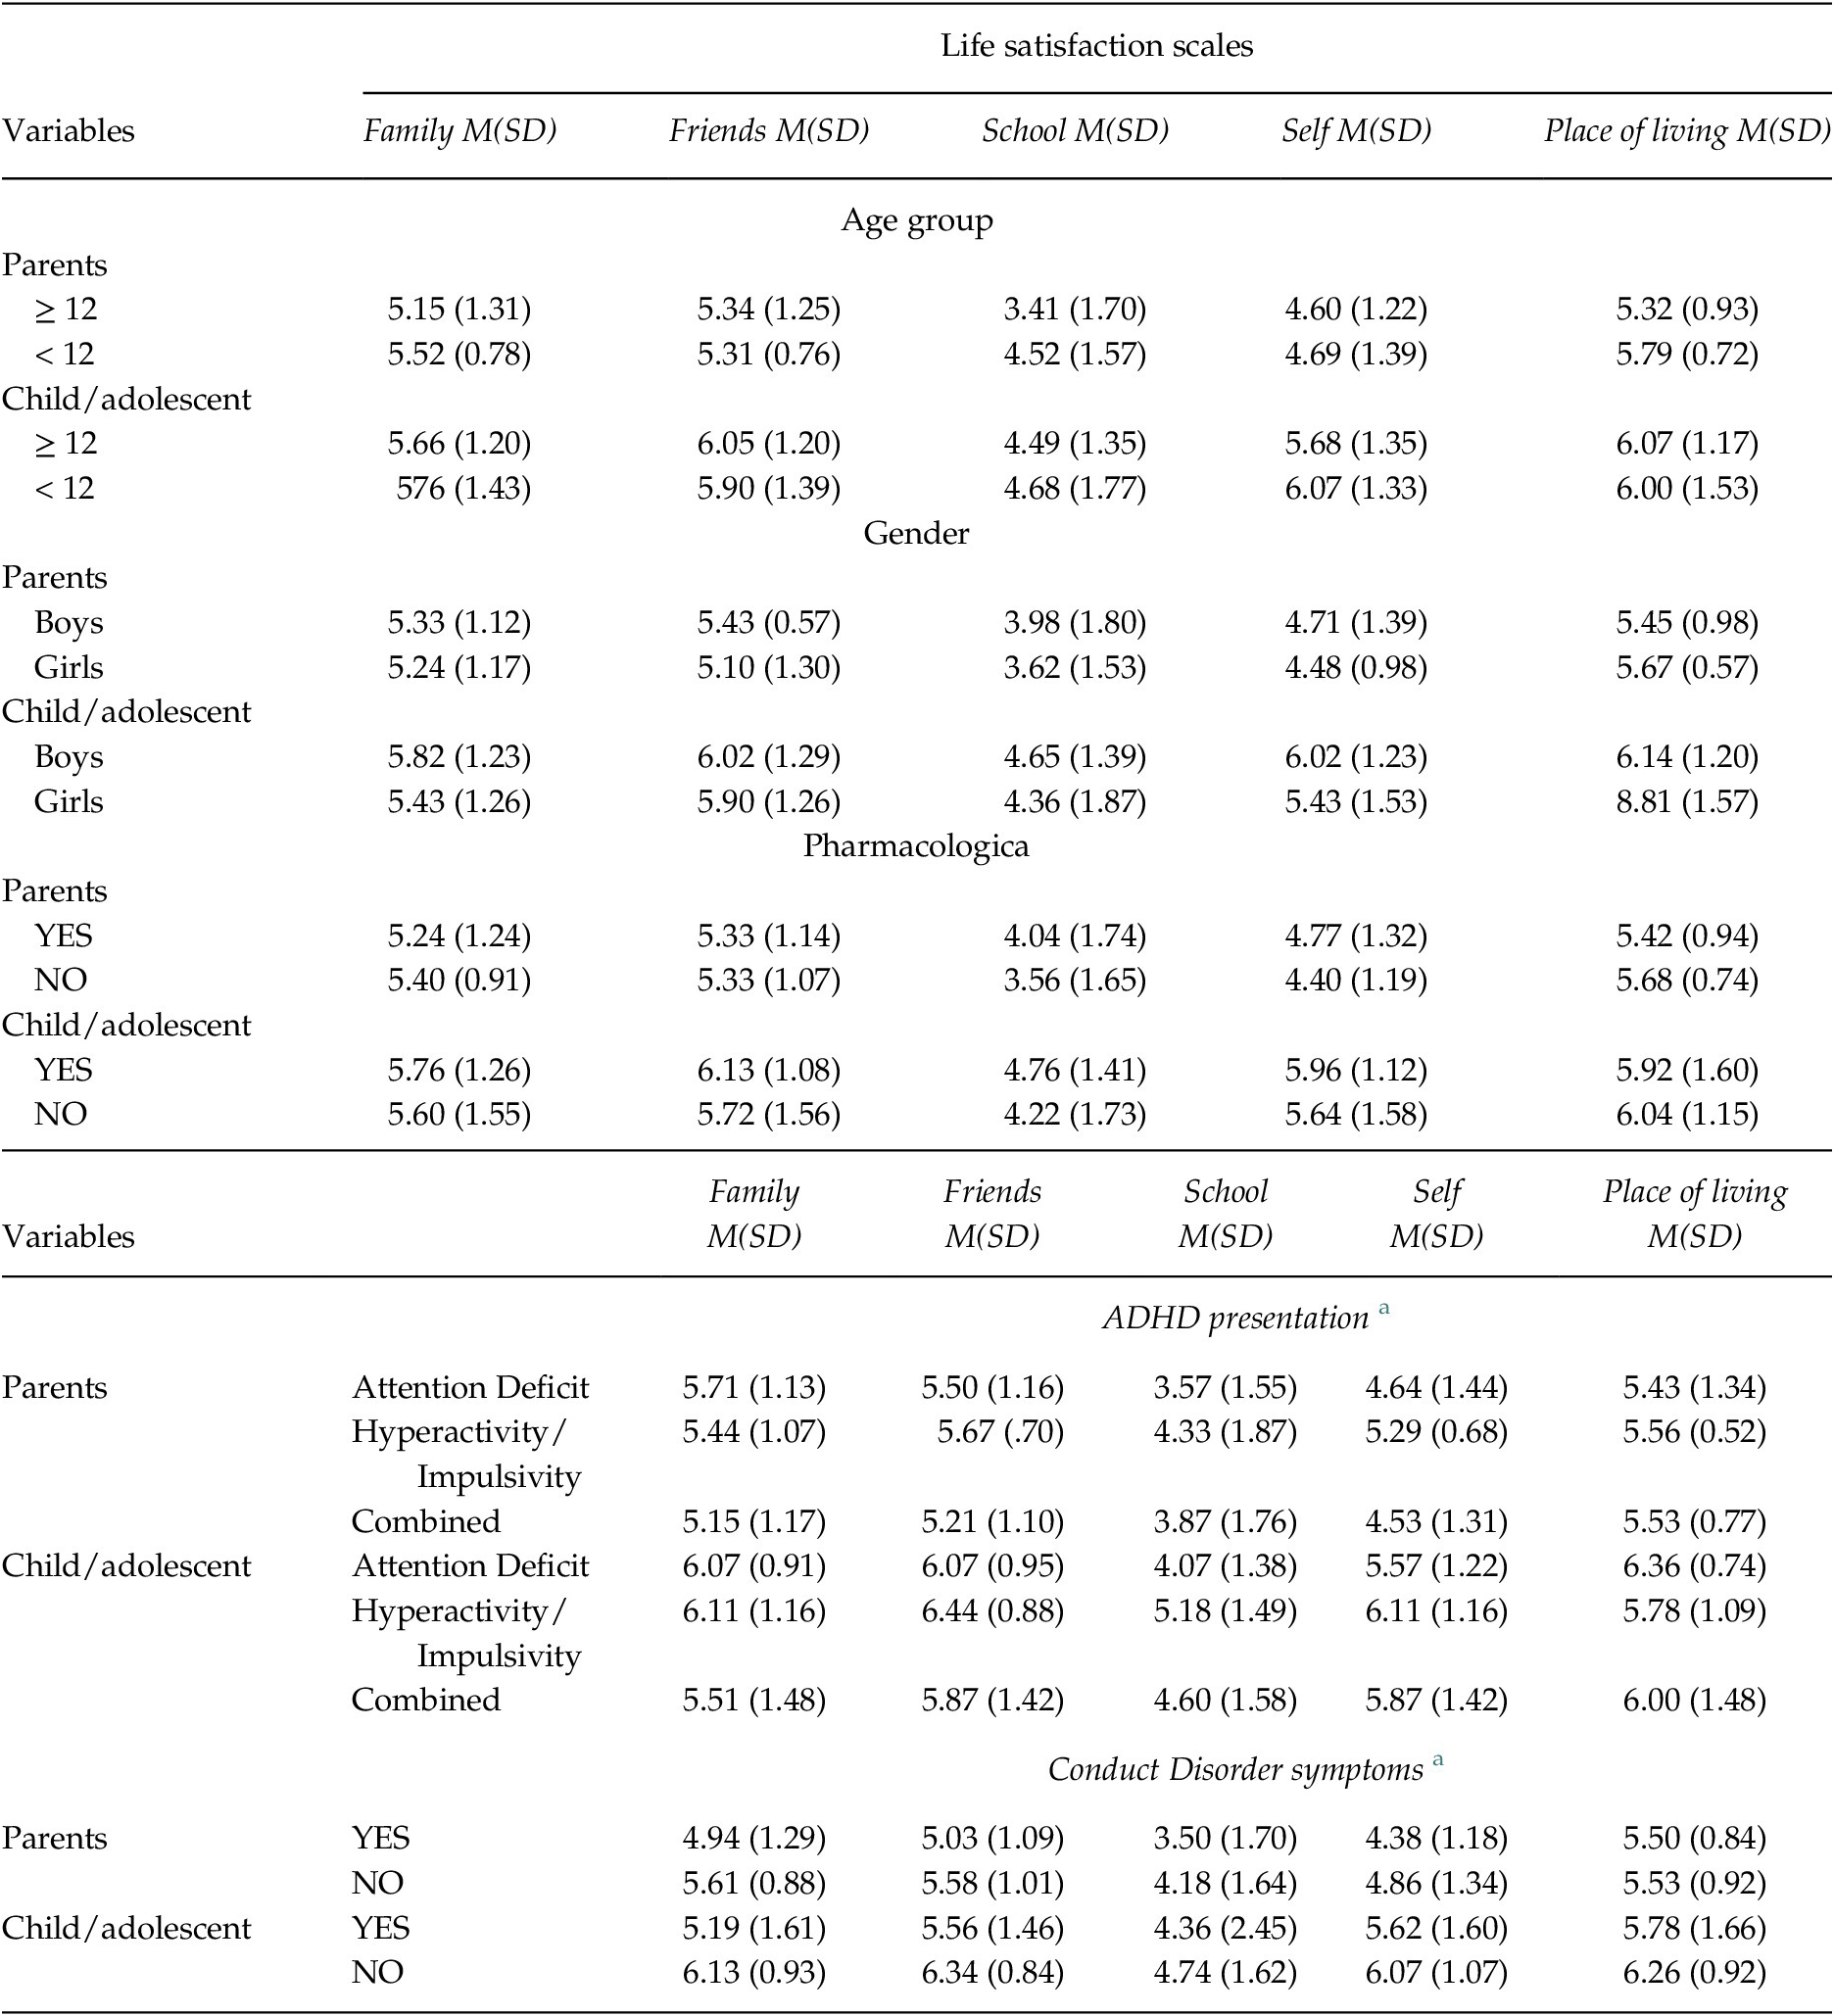
Descriptive Statistics of Perceived life Satisfaction (Five Components) according to Age Group, Gender, Pharmacological Support Status, ADHD Presentation and Presence of CD Symptoms

Note. Age group = ≥12 group (n = 41), < 12 group (n = 29); Boy (n = 49), Girl (n = 21); Pharmacological support = YES (n = 45), NO (n = 25); ADHD presentation = Attention Deficit (n = 14), Hyperactivity/Impulsivity (n = 9), Combined (n = 47); Conduct Disorder symptoms = YES (n = 32), NO (n = 38).
a Over percentile 90 in the scales from EDAH.
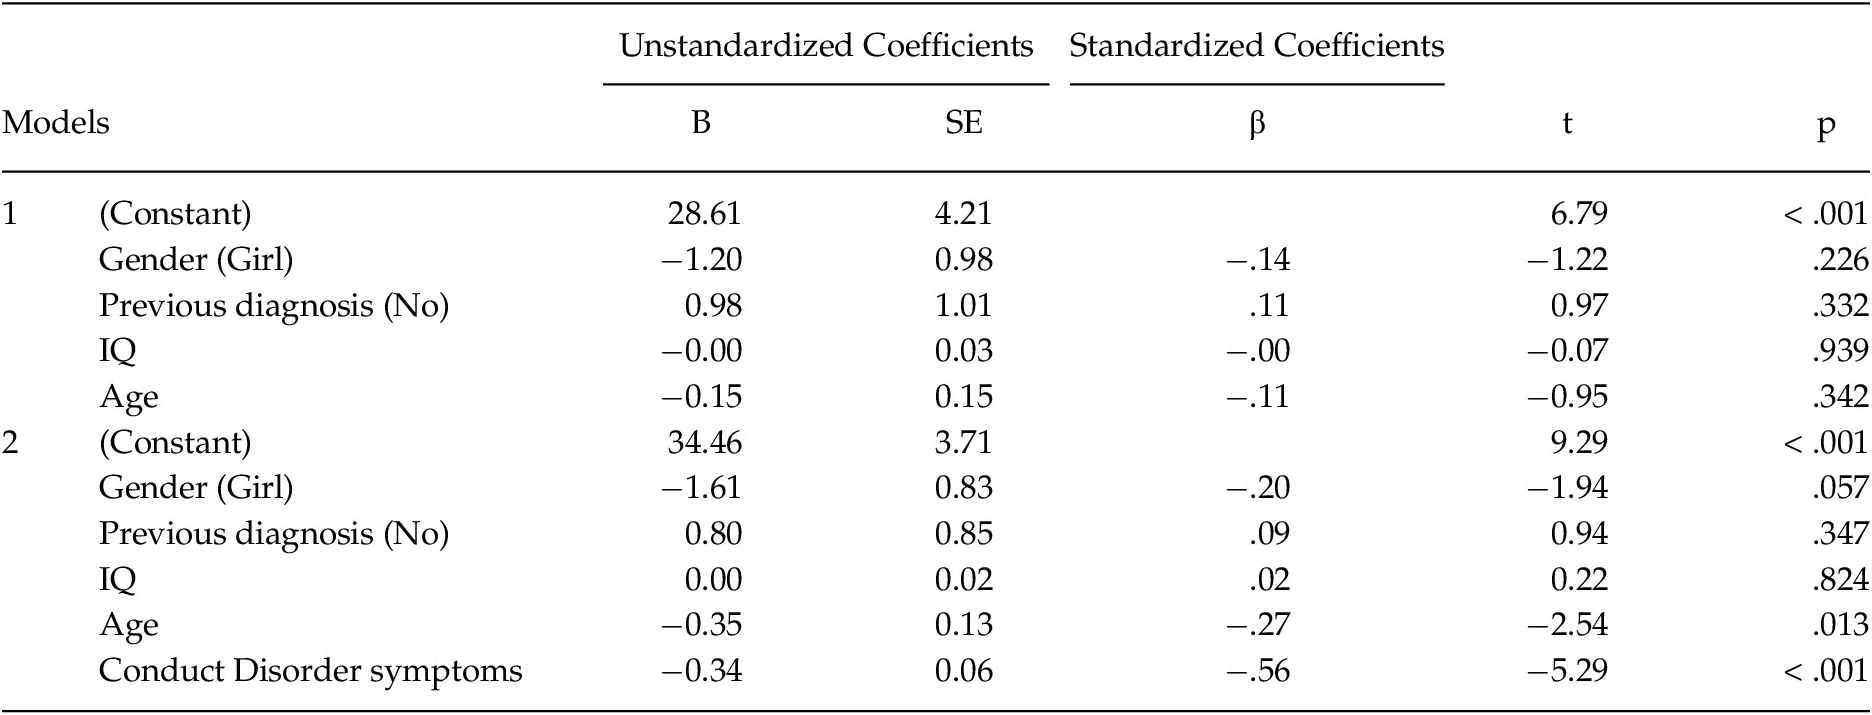
Results from Hierarchical Regression Analyses

Note. First block = age, gender, previous diagnosis, and IQ; Second block = Conduct Disorder symptoms from EDAH.
Data were analyzed using the IBM SPSS Statistics for Windows, Version 24.0 We used a p value < .05 as the criterion for statistical significance. An indicator of effect size was included: Cohen's (Reference Cohen1988) delta, according to which the effect is small when ηp2 = .01 (d = 0.20), medium when ηp2 = .059 (d = 0.50), and large when ηp2 = .138 (d = 0.80).
Results
Descriptive Analyses of the Studied Variables
Table 2 shows descriptive statistics for the variables and the correlations between them. Some statistically significant -and positive- correlations were found between parent and student reports of life satisfaction (.40 for the total satisfaction score). The highest correlations were found in Items 1 (family) and 2 (friends), while no statistically significant correlation was found in the case of Item 5 (place of living/community). Moreover, all the items statistically significantly correlated with the total score for satisfaction, from both parent and self-reports (correlations over .42 in all cases). Regarding attention deficit and hyperactivity/impulsivity symptoms, and CD (EDAH scale), no statistically significant correlations were found between hyperactivity/impulsivity and life satisfaction (evaluated by both parents and children/adolescents). Attention deficit symptoms were however significantly correlated to students’ total satisfaction score and Items 1 (family) and 3 (friends), with a negative relationship. Lastly, CD symptoms were statistically significantly correlated (also negatively) to both self-reports and parent reports of students’ satisfaction (total scores and most of the items).
Table 2 also shows that, in general, both students and parents reported medium to high levels of life satisfaction in the student (item maximum score is 7). However, scores were lower in Item 3 (School) in both cases. The highest levels of satisfaction reported were related to Item 5 (community) according to both informants. Generally, parent scores of student satisfaction were lower than the those reported by students, with a mean difference of almost 4 points in the general measure of life satisfaction.
Description of the Difficulties (Severity, Persistence, and Interference) according to Parent Reports
Families were asked about the degree to which ADHD was a difficulty in the children’s/adolescents’ daily lives in terms of emotional discomfort, concentration, behavior or ability to relate with others (in general). Almost a third (31.6%) indicated their children had some difficulties in these areas, 60% reported clear difficulties, and 8.4% reported severe difficulties. In terms of how long these difficulties had persisted, 2.9% indicated that they had been present for less than 6 months, 4.2% between 6 and 12 months, and 92.9% for more than one year.
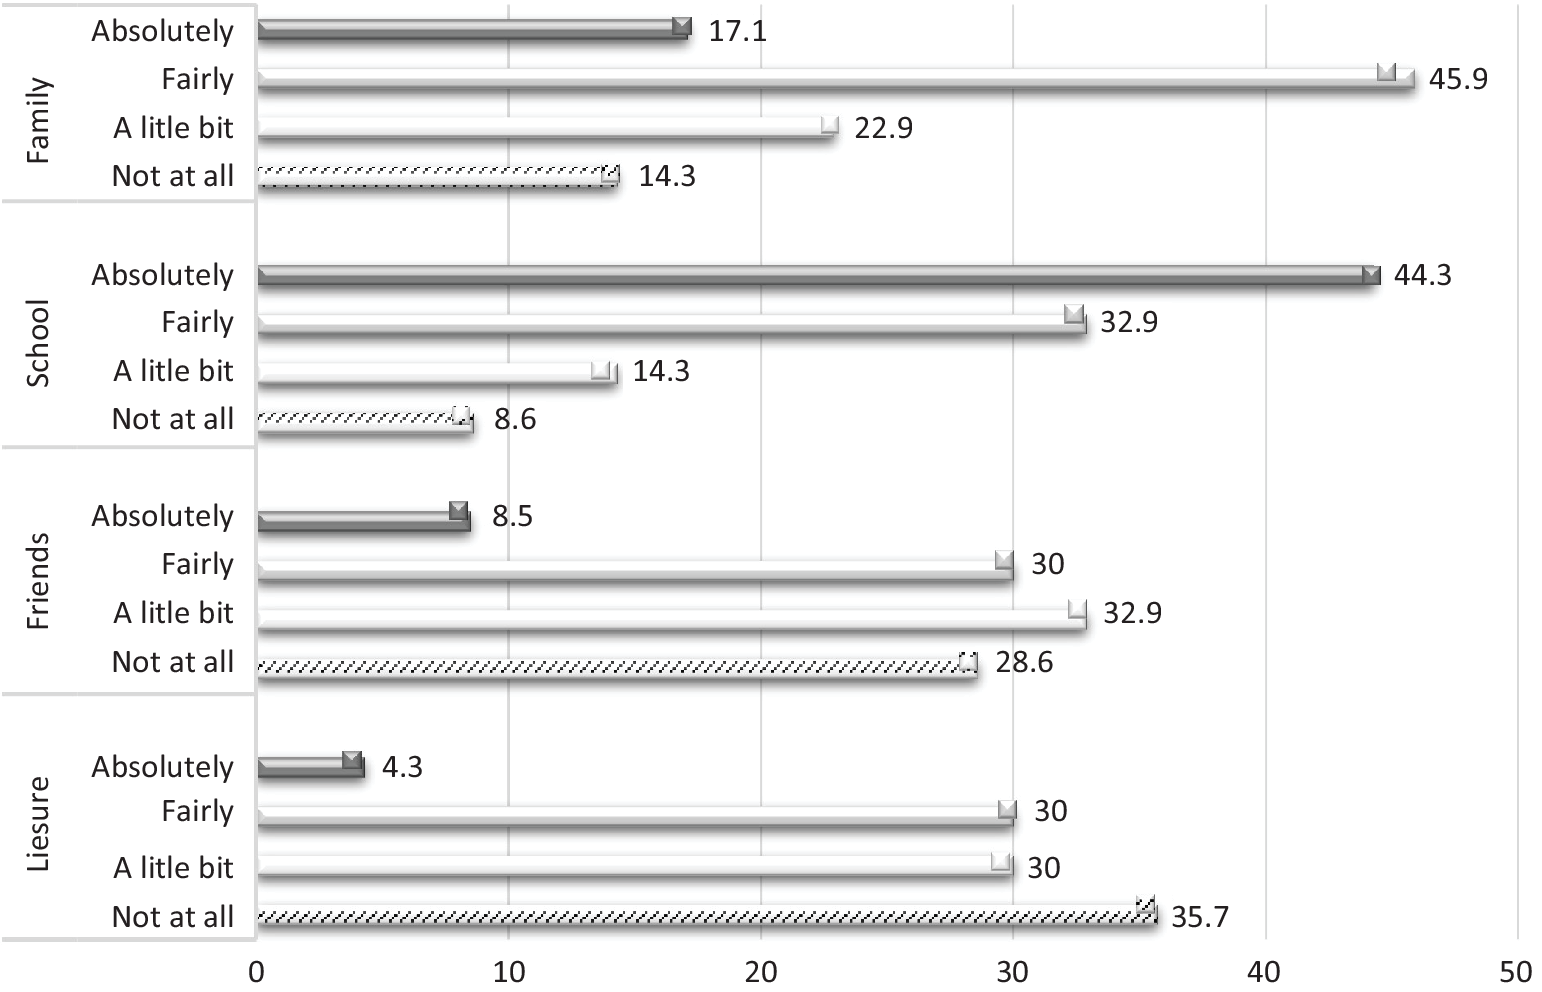
Considering the degree of interference of the difficulties associated with ADHD in family life, school, friends, and leisure time separately, Figure 1 shows that family and school were the most negatively affected contexts.
Degree of Interference or Discomfort ADHD Difficulties Cause in the Child/adolescent (Parents´ Report).
Note. Based on percentages.

Lastly, regarding the extent to which parents believe these difficulties were a burden on their family life, 8.6% of families did not see these difficulties as a burden, 22.9% said they were rarely a burden, while 41.4% and 27.9% of families responded that, for them, the difficulties were quite often a burden or an absolute burden, respectively.
Differences in Life Satisfaction according to Child/Adolescent Variables (Parent and Children Reports
Table 3 shows means, standard deviations and between group differences in the five components of life satisfaction (parents’ and children’s reports) according to the variables studied, taking IQ as a covariate.
In terms of parent reports, there were only statistically significant differences in the case age group, Wilks´ Lambda = 0.81; F(5, 63) = 2.94; p = .019; ηp2 = .19, with students over 12 years old exhibiting lower levels of life satisfaction, with a large effect size. The effect of IQ was not statistically significant (p = .80). Considering each life satisfaction component separately, univariate statistics indicated that there were statistically significant differences concerning School (p = .014; ηp2 = .09) and Place of Living (p = .027; ηp2 = .07). No statistically significant differences were found according to gender, pharmacological support status, or ADHD presentation. The covariate IQ did not generate statistically significant differences in any of the comparisons.
Concerning children’s/adolescents’ reports, statistically significant differences were only found in the case of CD symptoms, Wilks´ Lambda = 0.83; F(5, 63) = 2.59; p = .034; ηp2 = .17. Means indicated that students showing symptoms of CD reported significantly lower levels of life satisfaction than those without CD symptoms, with a large effect size. The effect of IQ was not statistically significant (p = .224). Considering each component of life satisfaction separately, statistically significant differences between children/adolescents with and without CD symptoms were found in the contexts of Family (p = .003; ηp2 = .12) and Friends (p = .013; ηp2 = .09). No statistically significant differences were found as a function of gender, age group, ADHD presentation, or pharmacological support. As in the case of the parent’s reports, the covariate IQ did not generate any significant effects in the different comparisons.
Prediction of General Student Life Satisfaction
We conducted a hierarchical linear regression, including the covariates age, gender, IQ, and previous mental disorders/learning difficulties in the first block, and Conduct Disorder symptoms in the second block (Table 4). A composite score of general life satisfaction (variable TOT SAT, M = 26.41; SD = 3.74), made up with the scores from parents and children/adolescents, was used as a dependent variable.
Two models were obtained (Table 4). In the first, Gender-Girl, Previous diagnosis-No, IQ, and age were specified, while the remaining variables (Gender-Boy, Previous diagnosis-Yes) were excluded. This model only explained 5.4% of the dependent variable, a percentage that was not statistically significant, F(4, 65) = 0.92; p = .458. Only the constant was statistically significant in the regression equation. In the second model, Conduct Disorder Symptoms entered as a new variable, while the previous variables remained. This model was statistically significant, F(5,64) = 6.64; p < .001, explaining 34.5% percentage of the variance of the life satisfaction score. As Table 4 shows, Age and Conduct Disorder symptoms become statistically significant predictors at this point, both showing a negative sign. An increase in either age or the presence of CD symptoms predicted a statistically significant reduction in life satisfaction.
Discussion
This study analyses the perception of life satisfaction in children and adolescents with ADHD, according to their own and their families’ perceptions. The results indicated that, firstly, parents reported a lower level of satisfaction than the students in every domain. This agrees with previous research such as Miranda-Casas et al. (Reference Miranda-Casas, Presentación-Herrero, Colomer-Diago and Roselló-Miranda2011), Nadeau et al., (Reference Nadeau, Jacob, Keene, Alderman, Hacker, Cavitt, Alvaro and Storch2015) and Danckaert et al. (Reference Danckaerts, Sonuga-Barke, Banaschewki, Buitelaar, Döpfner, Hollis, Santosh, Rothenberger, Sergeant, Steinhausen, Taylor, Zuddas and Coghill2010), and could be related to the fact the evaluation of children/adolescents may be influenced by the use of illusory positive biases that they use as a protection mechanism against damaged self-esteem (Ma et al., Reference Ma, Lai and Lo2016). Further research must look more deeply into the mechanisms that might explain these differences, as well as trying to establish whether children overestimate their life satisfaction or, whether it is the adults who underestimate this component, by assessing children’s behavior and competence based on their own expectations (Caci et al., Reference Caci, Doepfner, Asherson, Donfrancesco, Faraone, Hervas and Fitzgerald2014).
Besides these differences, we found moderate levels of life satisfaction according to the reports from both children/adolescents and parents. We also found statistically significant and positive correlations between the two groups of informants, indicating moderate levels of agreement between them. At the same time, results indicated that all the components evaluated (family, school, friends, self-esteem, community and living place) were related to the general satisfaction level, as suggested by Alfaro Inzunza et al. (Reference Alfaro Inzunza, Guzmán Piña, García Gómez, Sirlopú Díaz, Oyanedel Sepúlveda and Gaudlitz Ruiz2015).
If we look at the different spheres of life satisfaction evaluated, both parents and children exhibited the lowest perceived satisfaction with school life compared to other domains. In contrast, the greatest life satisfaction was in the community domain, perhaps because the sample is made up of children/adolescents and they do not have much responsibility or contact with this domain. The fact that school is presented as the domain with the worst life satisfaction perception in both informants is in line with previous research (e.g., Barfield, Reference Barfield2018; Nadeau et al., Reference Nadeau, Jacob, Keene, Alderman, Hacker, Cavitt, Alvaro and Storch2015). This may be explained because, compared to other areas of life, the school environment is perceived as authoritative, with a lot of rules, requiring a high level of engagement and dedication (Chavarría & Barra, Reference Chavarría and Barra2014) from the child/adolescent, along with effective emotional regulation mechanisms. Likewise, children and adolescents with ADHD also tend to have poor performance and have difficulties in adaptive functioning (Zuluaga & Vasco, Reference Zuluaga and Vasco2009), which can contribute to an even more negative assessment of the school environment.
In terms of the effects of ADHD presentation and comorbid CD symptoms, the results shown that there was association in the case of attention deficit. Years before, authors such as Danckaerts et al. (Reference Danckaerts, Sonuga-Barke, Banaschewki, Buitelaar, Döpfner, Hollis, Santosh, Rothenberger, Sergeant, Steinhausen, Taylor, Zuddas and Coghill2010) and Miranda-Casas et al. (Reference Miranda-Casas, Presentación-Herrero, Colomer-Diago and Roselló-Miranda2011) found a negative correlation between life satisfaction and the estimation of symptoms of hyperactivity/impulsivity and inattention by parents and teachers. But in this study, only association with attention deficit was found. This is interesting since perhaps today's society is more permissive about hyperactivity than other characteristics such as making mistakes and slowness, more marked symptoms when attention deficit predominates in ADHD symptoms. Nevertheless, previous studies such as Gudjonsson et al. (Reference Gudjonsson, Sigurdsson, Smari and Young2009) and Ogg et al. (Reference Ogg, Bateman, Dedrick and Suldo2016), with similar samples, or Shi et al. (Reference Shi, Liu, Sun and Wang2018), with adult samples, found the same results as in our study. The greater impact of attention deficit, more so than hyperactivity and impulsivity, could also be explained because this type of symptomatology aggravates feelings of frustration on a daily basis, although it has also been hypothesized that this could be related to the association between attention deficit and other types of symptomatology, such as depression or anxiety (Sciberras et al., Reference Sciberras, Efron, Patel, Mulraney, Lee, Mihalopoulos, Engel, Rapee, Anderson, Nicholson, Schembri and Hiscock2019).
The results indicated that the presence of CD symptoms was related to perceptions of lower life satisfaction. Findings from MANCOVAs and hierarchical regression analyses suggest that the presence of CD symptoms aggravates the situation in ADHD, which affects perceptions of life satisfaction. In fact, when this variable was entered in the regression model, the amount of explained variance of the composite score of life satisfaction increased by 28%. This consistent since, as Bussing et al., (Reference Bussing, Mason, Bell, Porter and Garvan2010) stated, when ADHD is associated with behavior problems, there is an increased risk of peer rejection, low academic performance, and low self-esteem. This would explain how this pattern leads to decreased life satisfaction in children and adolescents. In this same line, Miranda et al., (Reference Miranda-Casas, Presentación-Herrero, Colomer-Diago and Roselló-Miranda2011) found that behavioral problems have a negative relationship with satisfaction, being high self-esteem a possible protective factor.
Another important finding was that there was no statistically significant contribution from the covariate IQ in any of the comparisons made or in the regression analyses, indicating that this variable did not have any effect on life satisfaction assessed by the information provided by parents or children/adolescents.
With regard to the covariate previous diagnosis (existence of other previously diagnosed comorbid learning difficulties or problems), specified in the regression analyses in the first block, this variable was not a statistically significant predictor for the composite score of life satisfaction in the regression analyses. This adds support to the unique contribution of CD symptoms, over other disorders, as an important variable to consider when life satisfaction is assessed in ADHD samples.
Another variable that demonstrated a significant effect predicting life satisfaction was age. In our study, age had a negative impact on the perception of life satisfaction, as both parents and children/adolescents report higher life satisfaction scores in the group of participants under 12 years old. Although these differences were only statistically significant in the ANOVA conducted with parents, this variable showed its statistically significant effect predicting the composite score of life satisfaction, explaining an additional 7% of the variance in our study. This could be explained by the fact that as children grow up, social difficulties are considered to have more impact on the perception of life satisfaction of people with ADHD, a pattern also observed by Hennig et al. (Reference Hennig, Koglin, Schmidt, Petermann and Brähler2017). At the same time, it is important to note that some characteristics of the disorder tend to become attenuated with age (e.g., motor activity), while other characteristics, such as inattention or cognitive impulsivity, tend to persist or even become worse over time. Lastly, the demands of school, family, and social life increase with age. All these aspects could contribute to explaining this apparent reduction in perceived life satisfaction. In fact, the most affected domains of life quality may be different at different times in development. Increased age is related to worse satisfaction with the academic context and with the community (greater responsibility, demands of a more active role). In adults, this pattern would be more related to dropping out of studies, a higher unemployment rate, greater problems in interpersonal relationships, and higher divorce rates, among others (Hennig et al., Reference Hennig, Koglin, Schmidt, Petermann and Brähler2017).
As for gender or pharmacological support status, these variables did not have a significant effect on the perception of life satisfaction in our study. Firstly, we saw no gender-related differences, as in studies such as Huebner et al. (Reference Huebner, Drane and Valois2000), with people without ADHD. Although ADHD is normally more frequently diagnosed in men than in women, the results do not indicate that they perceive different effects of the disorder in their satisfaction with life. Previous studies such as Oerbeck et al. (Reference Oerbeck, Overgaard, Pripp, Aase, Reichborn-Kjennerud and Zeiner2019) found that women with more aggravated symptomatology showed worse levels of satisfaction with life. However, the sample in that study were adults, so it is possible that the results vary depending on the age of the participants.
Secondly, about pharmacological support status, we found no differences in the life satisfaction between children/adolescents taking medication and those who were not. These results are consistent with previous studies such as Barfield (Reference Barfield2018), where no differences in children’s life satisfaction with school were seen between medicated and non-medicated children. However, this is a variable that is worth continuing to study, since the kind of medication, the dose, or whether the child or adolescent receives treatment for other health conditions can affect the perception of the quality of life, or not affect it at all, which would have important implications for ADHD treatment.
Overall, our findings stress the importance of considering different informants when life satisfaction is assessed and suggest the role of age and CD symptoms as possible variables influencing the perception of life satisfaction in ADHD, according to parents and children/adolescents. Thus, when making psycho-pedagogical evaluations and intervention proposals, it is important to take into account life satisfaction of children and adolescents, according to their own perception, in order to identify possible areas of dissatisfaction and help them develop strategies to increase well-being, protecting their self-esteem, especially as they get older (Hennig et al., Reference Hennig, Koglin, Schmidt, Petermann and Brähler2017). Likewise, family perceptions of a child/adolescent´s life satisfaction can be a key element of intervention at a clinical and educational level. This acknowledgement of different unsatisfactory components of life could lead to build a support system in the face of the difficulties generated by the disorder, protecting children, adolescents and families from a poor perception of life satisfaction (Miranda et al., Reference Miranda-Casas, Presentación-Herrero, Colomer-Diago and Roselló-Miranda2011), specially for children/adolescents with CD, by creating a comprehensive and validating environment that helps promote positive self-esteem, favors academic performance (Hernández Martínez et al., Reference Hernández Martínez, Pastor, Pastor, Boix and Sans2017) and minimizes frustration (Caci et al., Reference Caci, Doepfner, Asherson, Donfrancesco, Faraone, Hervas and Fitzgerald2014).
Certain limitations of the present study must be acknowledged. Firstly, the small sample size must be considered, which affects the generalization of the results. Secondly, the study was cross-sectional, so the effect of time on the progression of the symptoms of ADHD could not be examined. Thirdly, the study did not include a comparison control group. In future studies, it would be interesting to compare the results with a control group, without a diagnosis of ADHD, to determine whether there are differences in the perception of life satisfaction between the two groups, as previous studies have stated (Danckaerts et al., Reference Danckaerts, Sonuga-Barke, Banaschewki, Buitelaar, Döpfner, Hollis, Santosh, Rothenberger, Sergeant, Steinhausen, Taylor, Zuddas and Coghill2010; Hernández Martínez et al., Reference Hernández Martínez, Pastor, Pastor, Boix and Sans2017).
Both, findings and constraints of the present study, call for further research on this topic. Future lines of research could analyze additional variables, such as family and personal support networks, or components such as student self-esteem could help us to better understand the current level of life satisfaction perceived by families and children/adolescents. The control of possible comorbidities, mainly the existence of learning difficulties should also be considered (Caci et al., Reference Caci, Doepfner, Asherson, Donfrancesco, Faraone, Hervas and Fitzgerald2014; González-Castro et al., Reference González-Castro, Rodríguez, Cueli, Cabeza and Álvarez2014; Hernández Martínez et al., Reference Hernández Martínez, Pastor, Pastor, Boix and Sans2017). Likewise, it would be interesting to combine the results with the study of variables that can mitigate negative life satisfaction in the case of children and adolescents with ADHD. For example, it seems that a strong sense of coherence, the ability to adapt, the ability to set goals according to their limits and develop strategies to achieve those goals, as well as a strong self-concept improve the symptoms of ADHD and the perception of life satisfaction (Mercader et al., Reference Mercader, Colomer and Berenguer2014), although how this relationship occurs, the direction in which it occurs, and the type of mediation that occurs between symptomatology and mitigating factors is still a topic for study.
Age seems to be an important variable in terms of life satisfaction results, so perhaps longitudinal studies could offer more complete information on the relationships between variables, as well as the importance of developmental factors, and whether there are differences between children/adolescents with and without ADHD.