INTRODUCTION
Many human activities have detrimental effects on biodiversity, and demonstrating biodiversity's economic value can help fight the many pressures faced by biodiversity (Pearce Reference Pearce2001). The economic value of biodiversity goes beyond marketable use values such as timber production or wildlife viewing, including non-use values such as existence value and bequest value (Pearce & Moran Reference Pearce and Moran1994; Tisdell & Nantha Reference Tisdell and Nantha2007; summarized in Remoundou et al. Reference Remoundou, Koundouri, Kontogianni, Nunes and Slourtos2009). Most studies have valued specific elements of biodiversity such as a species (for example otters Lutra lutra, White et al. Reference White, Gregory, Lindley and Richards1997; wild geese, MacMillan et al. Reference MacMillan, Hanley and Daw2004), particular ecosystems (for example coral reefs, Spash Reference Spash2002; Icelandic wilderness, Lienhoop & MacMillan Reference Lienhoop and MacMillan2007) or specific areas (for example Hanley et al. Reference Hanley, MacMillan, Wright, Bullock, Simpson, Parsisson and Crabtree1998; Jacobs Reference Jacobs2004; Christie et al. Reference Christie, Hanley, Warren, Murphy, Wright and Hyde2006). Landscape, in the aesthetic sense, is less often valued (for example Hanley & Craig Reference Hanley and Craig1991; Lapka & Cudlinova Reference Lapka and Cudlinova2004; Hanley et al. Reference Hanley, Colombo, Mason and Johns2007; Swanwick et al. Reference Swanwick, Hanley and Termansen2007), while landscape and biodiversity as linked entities are rarely valued. A landscape is essentially an extent or collection of habitats, and the link between habitat and biodiversity is one that is subject to much ecological study (see Guissan & Zimmermann Reference Guisan and Zimmermann2000; Moilanen et al. Reference Moilanen, Franco, Early, Fox and Thomas2005; Groning et al. Reference Groning, Krause and Hochkirch2007; Michel et al. Reference Michel, Burel, Legendre and Butet2007).
Given the political reality of limited space and financial resources for conserving biodiversity, survey-based stated preference methods such as contingent valuation (Mitchell & Carson Reference Mitchell and Carson1989; Bateman et al. Reference Bateman, Carson, Hanley, Day, Hanemann, Hett, Jones-Lee, Loomes, Mourato, Ozdemiroglu, Pearce, Sugden and Swanson2002; Champ et al. Reference Champ, Boyle and Brown2003; Alberini & Kahn Reference Alberini and Kahn2006) are helpful tools to inform decision-making when choices have to be made between different policy alternatives for a given physical area (Christie et al. Reference Christie, Hanley, Warren, Murphy, Wright and Hyde2006). In order to achieve this, survey respondents must be presented with alternative policy scenarios to choose between. Moreover, given that not all these scenarios will necessarily be welfare-enhancing, respondents should also be given an opportunity to express negative values for any of the scenarios (Atkinson et al. Reference Atkinson, Day, Mourato and Palmer2004; Lienhoop & MacMillan Reference Lienhoop and MacMillan2007; Hanley et al. Reference Hanley, Colombo, Kristrom and Watson2009).
Contingent valuation estimates, as the name indicates, are dependent on the scenarios and information presented in the survey. The role of information is particularly important when the method is applied in situations where respondents have little prior knowledge or experience of the good they are being asked to value, which is likely to be the case with biodiversity conservation or wildlife protection (Boyle & Bishop Reference Boyle and Bishop1987; Munro & Hanley Reference Munro, Hanley, Bateman and Willis1999). The provision of valid and accurate information increases stated values, particularly for non-use values (Munro & Hanley Reference Munro, Hanley, Bateman and Willis1999), increases the dispersion of willingness to pay (Tisdell & Wilson Reference Tisdell and Wilson2006), lowers the dispersion of respondents' knowledge (Tisdell & Wilson Reference Tisdell and Wilson2006), lowers the number of protest bids (Kenyon & Edwards-Jones Reference Kenyon and Edwards-Jones1998) and influences respondent preferences (Spash Reference Spash2000; Tisdell & Nantha Reference Tisdell and Nantha2007). The influence of the method of information provision on preferences has been addressed (for example see Christie et al. Reference Christie, Hanley, Warren, Murphy, Wright and Hyde2006), but the influence of the nature of the information provided has received little attention, although the level of information has little effect on mean WTP while time to think and an opportunity to deliberate can influence WTP (MacMillan et al. Reference MacMillan, Hanley and Lienhoop2006).
In this study, we use a contingent valuation survey to uncover visitor values (as expressed in voluntary contributions) for a number of complex changes feasibly occurring in the landscape and rare and threatened wildlife in the North Pennines area of outstanding natural beauty (AONB) in the North of England (UK) (Appendix 1, see supplementary material at Journals.cambridge.org/ENC). The landscape and wildlife assemblages used are linked to potential policy scenarios, such that real outcomes can be compared in terms of socioeconomic values. The policy scenarios include grouse moor-specific subsidies, decline in grouse shooting, nature reserve management and re-wilding. We also investigated whether landscape quality or biodiversity (assuming that these are separable) was more important in determining overall contributions for a range of scenarios. Furthermore, we allowed the expression of negative values for any of the scenarios presented and investigated the influence of the provision of land use information on preferences. This paper contributes to a deeper understanding of preferences for the management of upland areas such as the North Pennines using real policy scenarios. Specifically, we explore preferences between complex and interlinked goods such as landscape and biodiversity assemblages, estimate the amount that could feasibly be captured through voluntary contribution mechanisms to achieve the most preferred assemblages and highlight the importance of accounting for the possibility of welfare-decreasing changes when dealing with these types of goods.
METHODS
Study site
The North Pennines AONB covers approximately 2000 km2 and contains three National Nature Reserves, including England's largest, five Special Areas for Conservation (SACs) under the Europena Union (EU) habitats directive and a Special Protection Area (SPA) designated under the EU birds directive. It is mostly owned by private landlords and is managed for extensive agriculture and red grouse (Lagopus lagopus scoticus) shooting. The area consists of open upland containing mosaics of blanket bog, heather moorland, rough grasslands and small patches of woodland. The area is known for its wildlife (in particular breeding waders, arctic/alpine plants and moorland invertebrates) and geological interest, and attracts approximately 27 000 visitors per year (Alston Tourist Information, personal communication 2005). As privately owned commercial land, it is subject to the same EU agricultural regulations as any farmland in the UK. Recent European Common Agricultural Policy (CAP) reforms have left landowners uncertain as to the future direction of management and revenues, and local policy makers unsure as to how to maximize the environmental and conservation value of the area.
One of the major land uses within the North Pennines is management for red grouse shooting, which involves rotational burning of heather to maintain a mixed stand, and control of predators such as foxes, crows, rats and mustelids (Hudson & Newborn Reference Hudson and Newborn1995). Management for red grouse shooting might be expected to be somewhat controversial amongst the general public, because it is associated in the press with illegal raptor persecution (as well as the routine legal control of generalist grouse predators). Moreover, our survey was undertaken at a time when hunting sports were under a perceived threat owing to the recent ban on fox hunting. The management associated with shooting is however responsible for maintaining heather moorland (Robertson et al. Reference Robertson, Park and Barton2001) with associated conservation benefits, including increased numbers of some ground nesting birds (Tharme et al. Reference Tharme, Green, Baines, Bainbridge and O'Brien2001) and increased arthropod diversity associated with decreased grazing levels found on grouse moors (Thompson et al. Reference Thompson, MacDonald, Marsden and Galbraith1995).
Survey design and implementation
Stated preference survey techniques can estimate use and non-use values of goods, unlike revealed preference valuation techniques which measure use values only. We used a contingent valuation approach (Mitchell & Carson Reference Mitchell and Carson1989; Bateman et al. Reference Bateman, Carson, Hanley, Day, Hanemann, Hett, Jones-Lee, Loomes, Mourato, Ozdemiroglu, Pearce, Sugden and Swanson2002; Champ et al. Reference Champ, Boyle and Brown2003; Alberini & Kahn Reference Alberini and Kahn2006), which typically involves asking individuals what they would be willing to pay for a specified outcome or policy, contingent upon the situation constructed in the survey to allow this transaction to be made.
Our target population were visitors to the North Pennines, namely users of the area; we aimed to elicit information on which elements of the North Pennines they valued. It would have been interesting to also sample non-visitors (either local residents or from the UK population in general) but resource constraints limited our survey to one of these groups, and visitors were a particularly relevant group owing to their substantial contribution to the economy of the region.
Respondents were presented with five scenarios, one of which corresponded to the current situation. In order to ground the valuations on real policy options, the survey scenarios were based on changes resulting from potential policies (such as back-to-nature subsidies or a decline in red grouse shooting resulting from enforcement of Natural England's burning guidelines; Tucker Reference Tucker2003). This meant that respondents were not simply asked their preferences for single dimensional changes, such as ‘would you like to see an increase in the extent of heather moorland’, but instead were asked to value the complex multidimensional changes resulting from potential future policy scenarios. Specifically, they were firstly asked to identify their preferred scenario for independent landscape-only changes, then to choose the scenario they most preferred when only biodiversity changes were depicted, and finally to identify their preferred overall outcome where both landscape and biodiversity changes occurred simultaneously. This allowed the relative importance of landscape and biodiversity elements in preference formation to be assessed.
Five scenarios were presented to respondents (Appendix 2, see supplementary material at Journals.cambridge.org/ENC). The combined landscape and associated biodiversity outcomes corresponded to (A) the status quo, (B) a policy of grouse moor specific subsidies, (C) decline in grouse shooting, (D) nature reserve management (possibly achieved via back to nature type subsidies) and (E) re-wilding. Respondents were not given this information about the policies and management options behind the scenarios, so their choices were purely based on their preferences for these five landscape and biodiversity outcomes (with the exception of some respondents, who were given some additional information on land uses as described below). Landscape changes in the scenarios were based on percentage changes from the status quo in the proportions of blanket bog, heather moorland, woodland and rough grassland. Each scenario outcome involved an increase in the relative proportions of one of these landscape elements. The biodiversity outcomes were based on changes from the status quo on the number of Biodiversity Action Plan (BAP) species of broad taxonomic groups present, because existing data allowed us to quantify the link between habitat changes at the landscape level and the presence of BAP species (Black Reference Black2009). The North Pennines supports 20 of the 391 BAP species in the UK. The presence of BAP species is a good proxy for biodiversity value because they are defined as globally threatened or declining in the UK, and are species for which action can potentially slow, halt or reverse the rate of decline. The BAP species were divided into three groups that appeared logical and meaningful to respondents, namely birds and mammals, insects and spiders, and plants.
All respondents were presented with brief descriptions of the various landscape and biodiversity elements of interest within the North Pennines, and the threats they faced. We also conducted a split-sample experiment where half of the respondents were presented with additional descriptions of the land uses within the North Pennines and how these related to the landscape elements (Appendix 3, see supplementary material at Journals.cambridge.org/ENC). The questionnaires were otherwise identical. This allowed determination of the effect of provision of information about the links between land use and landscape on preferences for these landscapes and associated biodiversity.
After being asked to identify their preferred scenario, respondents were then asked for their willingness to pay (WTP) to achieve each one of the five joint landscape/biodiversity scenarios, including the one they identified as preferring the most. That is, they were asked five WTP questions in sequence, one for each scenario. The payment vehicle was a donation to a trust fund, whose sole purpose was maintaining the landscape and biodiversity of the North Pennines, so as to produce the outcomes implied in the various scenarios described.
Voluntary contribution mechanisms, such as the one used in this study, are commonly criticized for not being incentive compatible and not being demand-revealing, resulting in free-riding and warm glow effects (Champ & Bishop, Reference Champ and Bishop2001: Berrens et al. Reference Berrens, Jenkins-Smith, Bohara and Silva2002; Poe et al. Reference Poe, Clark, Rondeau and Schulze2002). They remain important, however, as they are widely used in real-life situations and are often the only credible institutional arrangement to finance public goods (see MacMillan et al. Reference MacMillan, Smart and Thorburn1999, Reference MacMillan, Hanley and Lienhoop2006). Moreover, incentive incompatibility is not necessarily as large a problem as many fear, with free-riding occurring far less than predicted by economic theory (Murphy et al. Reference Murphy, Stevens and Weatherhead2005), and compulsory payment mechanisms such as taxes and prices can be equally problematic if they lack credibility and are met with disbelief and/or protest from respondents. This is precisely the case with the North Pennines case study; imposing general or local taxes to fund local management options lacks credibility, as most of the land is under private ownership and our target population is restricted to visitors that come from all over the UK. Issuing price-like mechanisms, such as car park charges, would be unworkable and ineffective in a wide open area with a large number of access points and multiple sizeable private estates. Despite their shortcomings, voluntary contributions are the only realistic option for raising funds for local conservation amongst users in this area. The values thus estimated may not correspond to the true maximum WTP held towards the changes in question (even after addressing hypothetical bias) due to free-riding. They constitute instead a lower bound of what can actually be raised within the institutional setting that is realistically available.
As suggested in Murphy et al. (Reference Murphy, Stevens and Weatherhead2005), donations may exacerbate the problem of hypothetical bias because of the tendency to exaggerate the hypothetical amount stated whilst free-riding on the actual contributions. We therefore made use of a cheap talk script (Cummings & Taylor Reference Cummings and Taylor1999; Poe et al. Reference Poe, Clark, Rondeau and Schulze2002; Lusk Reference Lusk2003; Murphy et al. Reference Murphy, Stevens and Weatherhead2005) to try and reduce this potentially enhanced bias. The hypothetical bias problem and the overstatement of values in hypothetical contexts were explicitly described to respondents and they were instructed to answer as if they were actually donating the money. Respondents were also reminded of their budget constraint and other things they might want to spend their money on.
A contingent valuation approach was chosen in preference to a choice experiment for two reasons. Firstly, we were interested in the evaluation of the outcomes of very specific policy scenarios that can feasibly occur in the future in the North Pennines, such as grouse moor-specific subsidies, re-wilding, nature reserve management and decline in grouse shooting. Each of these scenarios was comprised of a specific combination of landscape and wildlife assemblages that each contained several changes (such as changes in rough grassland area, changes in heather cover, and changes in key birds and mammals). A choice experiment design would have resulted in experimentally mixing landscape and biodiversity attributes that in reality do not occur simultaneously, leading to a large number of infeasible and policy irrelevant combinations. A contingent valuation design focusing solely on the scenarios and assemblages that are actually feasible avoids this problem. Secondly, we were not concerned about the micro trade-offs between the various attributes within the landscape and biodiversity assemblages. That is, our interest was not in finding out how people trade-off rough grassland versus heather cover, or important plants versus blanket bog cover, or heather cover versus insects and spiders for example, but to uncover how a multidimensional landscape outcome as a whole fares against a multidimensional biodiversity outcome. A choice experiment approach would however have been possible using a different and less complex conceptualization of the landscape and biodiversity attributes than the one used here.
Finally, in an attempt to identify any underlying negative values, those respondents that stated a zero WTP for any of the five outcomes were asked what, if anything, they would be willing to donate to a trust fund whose aims were to prevent that outcome. Although it is possible to conceive of many instances where the changes of interest can be welfare-improving for some people but welfare-decreasing for others (examples include preferences for electricity pylons in Atkinson et al. Reference Atkinson, Day, Mourato and Palmer2004; for wolf management programmes in Broberg & Brännlund Reference Broberg and Brännlund2008; for woodland landscapes in Hanley et al. Reference Hanley, Colombo, Kristrom and Watson2009), it is not standard practice to estimate negative values in non-market valuation studies. Hanley et al. (Reference Hanley, Colombo, Kristrom and Watson2009, p. 2) pointed out that using valuation approaches which preclude negative WTP may provide biased estimates of welfare changes ‘in circumstances where a significant fraction of the sample actually dislikes the proposed change’.
One way of including negative WTP for a proposed project is to estimate the willingness to accept (WTA) compensation for those not in favour if the project goes ahead (Lienhoop & MacMillan Reference Lienhoop and MacMillan2007). However recovering WTA values is highly problematic; accepted property rights may not make WTA appropriate, WTA scenarios may not be credible and WTA often tends to be much higher than corresponding WTP estimates (Clinch & Murphy Reference Clinch and Murphy2001). Hanley et al. (Reference Hanley, Colombo, Kristrom and Watson2009) used as a proxy for WTA, the WTP for a ‘symmetrically opposite’ change (that is they compared WTP for increase in forest cover with WTP for a symmetrical decrease in forest cover, as a proxy for WTA to prevent the increase in forest cover). This approach has the advantage of avoiding combining measures of compensating surplus and equivalent surplus. Clinch and Murphy (Reference Clinch and Murphy2001) suggested using WTP to avoid or prevent a proposed change from going ahead (a Hicksian equivalent surplus welfare measure) as a proxy for WTA to endure the change (a Hicksian compensating variation welfare measure). Although this implies combining compensating and equivalent surplus measures of the same change, the use of this proxy is appropriate in this case, when the good being valued is substitutable and when WTP is unlikely to be a large proportion of income. In our case, WTP values were found to be very small and hence income effects are insignificant, and the landscape changes involved are relatively small and reversible. Following this approach, two WTP measures were used in our study: WTP for securing particular landscape/biodiversity scenarios for those who like them (compensating surplus) and WTP to prevent the same scenarios (equivalent surplus) for those who dislike them (as the WTA proxy).
Finally, the survey also included sections on general preferences and attitudes to the North Pennines, British wildlife and more general conservation issues, and standard demographic information such as age and household income. Furthermore, there was an optional quiz at the end to allow estimation of respondents' general knowledge of conservation, biodiversity and landscape issues.
The questionnaire survey was distributed face-to-face and then self-completed by respondents in their own time. This gave respondents an opportunity to consider their responses. Respondents were selected randomly in a number of locations within the North Pennines, including a nature reserve car park, a village square, a hostel, and a picnic/parking spot close to walking paths and points of interest. The diversity of survey locations maximized the range of visitor motivations covered. Most respondents were in a party of two or more, and in these cases it was explained that only one person should undertake the questionnaire and only one copy was provided. Although we cannot be certain that this instruction was followed, we are confident that the face-to-face introduction to the project and the questionnaire piqued respondents' interest and maximized the likelihood of questionnaires being completed according to instructions. Respondents completed the questionnaire and posted the completed survey back to the researcher. The survey was administered between 14 August and 30 September 2006.
Analysis
The statistical analysis was performed in Stata version 8 and in R 2.3.0. A multinomial logit model was used to explain respondents' choice of their most preferred joint landscape/biodiversity scenario (McFadden Reference McFadden and Zarembka1974; Hosmer & Lemeshow Reference Hosmer and Lemeshow2000). Heckman selection models were then used to investigate which variables explain WTP for each of the joint landscape/biodiversity outcomes (Heckman Reference Heckman1979; Briggs Reference Briggs2004). In the context of our study, the Heckman models estimate both the determinants of the probability of paying something for a particular scenario and also the determinants of the stated WTP (Huang et al. Reference Huang, Raunikar and Misra1991). We note however that other more sophisticated models exist to jointly model positive and negative WTP amounts, as exemplified in Hanley et al. (Reference Hanley, Colombo, Kristrom and Watson2009).
RESULTS
The 500 distributed questionnaires resulted in 404 returned responses (a response rate of 81%). Three hundred and seventy six respondents completed all sections of the questionnaire, and out of these 252 completed the optional quiz.
Only ten respondents were not British. The mean age category was 50–54 years old, with >64 year olds being the single most common category. The mean income category was GB£ 20 000–29 000 (GB£ 1 = US $1.88 in August 2006 when the survey began). Over half of respondents were members of an environmental or conservation organization. To check to some extent the representativeness of our sample, we compared the demographics of our respondents to the profile of visitors to Alston, a market town within the North Pennines, profiled in Alston in 2005. An almost identical proportion of sample and Alston visitors were from the UK, and the sex ratio was also very similar (Male:Female = 3:2). However, visitors to Alston had a wider age range and a higher mean income than our survey respondents. Our visitor sample is unlikely to be representative of the UK population in their attitudes, with over half being members of environmental organizations, as opposed to 31% of rural and 12% of urban respondents in a random survey of Scottish residents (Schofield Reference Schofield2005).
The level of knowledge of respondents varied, although it was generally good, with an average score of 77.8%. Interestingly, this is a higher score than the postgraduate biology students who carried out the knowledge quiz during the pilot stages of survey development, suggesting that our sample is very knowledgeable about environmental issues. The only significant variable in an ordinary least squares regression model to explain quiz score was membership of an environmental organization (coefficient 10.51 [±1.53], n = 252, p < 0.001, explaining 17% of variance in quiz score).
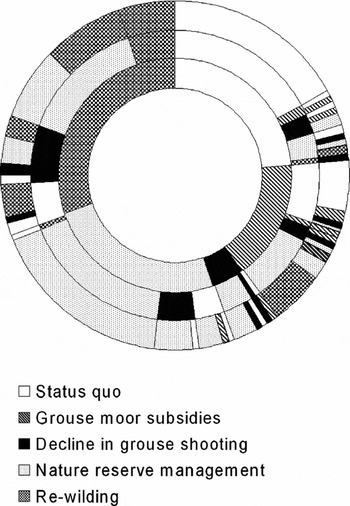
Forty two per cent of respondents preferred the same outcome for both landscape and biodiversity, before being told that the two were linked (Fig. 1). Of those that did not, 40% chose the outcome which they preferred from the landscape choice as the combined outcome (after being told how the two were linked) and 39% chose the biodiversity outcome. The remaining 21% appear to be making some form of compromise by changing their joint landscape/biodiversity outcome.
Preferences for landscape, biodiversity and the combined outcome. The inner circle represents landscape preferences, the middle circle shows the biodiversity outcomes preferred by those with each landscape preference, and the outer circle shows the preferred combined outcomes for each set of landscape and biodiversity preferences. For example most of those choosing the status quo for landscape also chose it for wildlife and for the combined outcome.

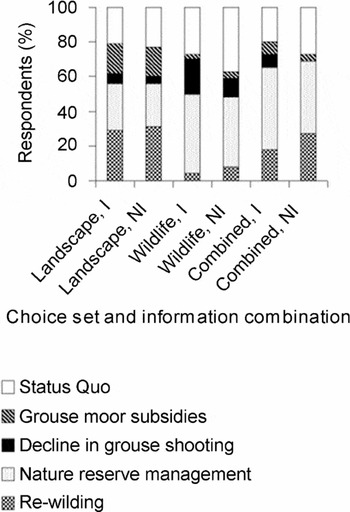
All landscape outcomes, except for an increase in the proportion of grassland cover which corresponds to a decline in the extent of grouse shooting (outcome C), were preferred by a similar proportion of respondents, with an increase in woodland cover (outcome E re-wilding) being marginally the most often preferred (Figs 1 and 2). The wildlife change associated with nature reserve management (increased number of rare and threatened birds and mammals) was the most often preferred wildlife outcome overall and especially for those with additional land use information, who were also more likely to choose the wildlife change associated with a decline in the extent of grouse shooting (and increased numbers of rare and threatened invertebrates) than those without this information (Fig. 2). Those with additional information were more likely to choose the overall outcome associated with a decline in grouse shooting.
Comparison of preferences of respondents for landscape, wildlife, and combined outcomes, for the sub-sample with the additional land use information (I) and for the subsample without this additional information (NI).

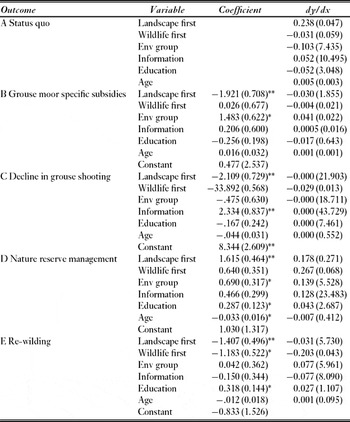
The results of the multinomial logit model show that those who were members of an environmental organization were more likely to choose the combined outcomes associated with grouse moor specific subsidies (outcome B) and nature reserve management (outcome D), which include an increase in the relative extent of heather moorland cover and increased numbers of rare and threatened invertebrates, and of blanket bog and rare and threatened birds and mammals, respectively. Those who thought that the main attraction of the North Pennines was its landscape were more likely to prefer outcome D, an increase in blanket bog and associated rare and threatened birds and mammals (achieved through nature reserve management) (Table 1). Those that considered wildlife to be the main attraction of the North Pennines were less likely to choose outcome E (re-wilding). Socioeconomic factors such as age and education also influenced some of the choices (Table 1). Finally, provision of extra information is found to affect only (in a negative way) the choice of outcome C (decline in grouse moor shooting).
Multinomial logit model of the respondent's choice of combined landscape/biodiversity outcome. Landscape first is a dummy variable indicating that landscape is the respondent's first ranked attraction of the North Pennines, and wildlife first is a dummy variable indicating that wildlife is the respondent's first ranked attraction of the North Pennines. Env group is a variable indicating membership of an environmental group. Outcome A is the base outcome. A negative coefficient indicates that an increase in that explanatory variable (or a change from 0 to 1 if it is a dummy variable) leads to the outcome being less likely than the base outcome. Dy/dx indicates the change in the probability of choosing that outcome for an incremental increase from the mean value of explanatory variables, and for a change from 0 to 1 for dummy variables (SE in brackets). 376 observations, pseudo R squared 0.16. *p < 0.1, *p < 0.05, **p < 0.01, ***p < 0.001.

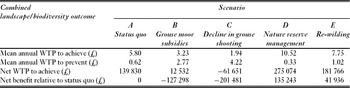
Mean WTP for the various combined landscape/biodiversity scenarios varied between around GB£ 2 (for outcome C) to GB£ 11 (for outcome D), after removing four protest and seven strategic bids and two outliers believed to be invalid. Strategic bids were defined as bids where respondents did not believe they would really pay the amount stated (that is those whose reason for paying was ‘I want to show how much I value the environment and/or wildlife in general, even though I would not actually pay this amount’ or ‘I want to show how strong my preference is for this (these) particular scenario(s), even though I would not actually pay these amounts’). Protest bids were defined as those where respondents stated a zero WTP because they disliked some contextual element of the questionnaire (such as the payment vehicle) and not because they don't value the changes presented. The WTP values for each combined outcome were compared using analysis of variance and found to be significantly different (F = 21.22, df = 4, p < 0.001). That is, respondents were willing to pay a different amount to achieve each of the outcomes. On aggregating WTP to the number of annual visitors to the North Pennines, an increase in blanket bog with associated increase in the numbers of rare and threatened birds and mammals (resulting from nature reserve style management, outcome D) and in woodland cover with associated increase in numbers of rare and threatened birds, mammals and plants (resulting from re-wilding, outcome E) were both found to constitute a net benefit compared with the status quo (Table 2). Outcome C (an increase in grassland) not only constitutes a net cost, but receives a negative benefit (the WTP to prevent this outcome is greater than WTP to achieve it).
Mean willingness to pay (WTP) to achieve, and to prevent, each combined landscape/biodiversity outcome, and net benefits of each combined outcome (aggregate visitors' WTP to achieve minus aggregate visitors' WTP to prevent). The net WTP for outcome A can be seen as a baseline, above which any change from the status quo represents a benefit and below which any change from the status quo represents a cost. The bottom row is the net WTP to achieve that outcome minus the net WTP to achieve outcome A, or, how much better than the status quo that outcome is.

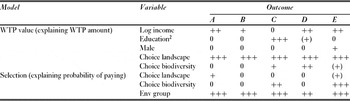
In the Heckman model results, the most important explanatory variable for whether an individual is willing to pay anything for the combined scenarios (WTP principle, bottom half of Table 3) was membership of an environmental organization, while the most important factors in explaining WTP were choice of preferred landscape and income (top half of Table 3). If the combined scenario being valued corresponded to the previously identified most preferred biodiversity option, respondents were only willing to pay more in three cases, for scenarios C, D and E. Both D and E involved some increase in rare and threatened birds and mammals. Not only was landscape more often a significant explanatory variable than biodiversity choice, the coefficient was larger for landscape choice when both were significant. As expected from economic theory, income is a positive and significant explanatory variable for all except one WTP model, the one corresponding to a decline in the extent of grouse shooting (C). There were more zero answers for this outcome than for any of the others, and this was also the least preferred outcome (Fig. 2); it may well be that there were not enough positive WTP results to detect an effect of income in this case. Moreover, income appears to have no influence on whether an individual was willing to pay or not, only on the amount stated. Finally, provision of extra information had no significant effect on stated values and was not included in the final model specification.
Summary of results from Heckman selection models of willingness to pay (WTP) for each combined outcome. The first part of the model estimates coefficients for the WTP value of respondents, whilst the lower selection model estimates coefficients for the expectation of being willing to pay anything at all. Landscape choice is a dummy variable indicating that the landscape scenario was the preferred choice. Biodiversity choice is a dummy variable indicating that the biodiversity scenario was the preferred choice. All coefficients are positive; +++ = p < 0.001, ++ = p < 0.01, + = p < 0.05, (+) = p < 0.1, 0 = non-significant (p ≥ 0.1).

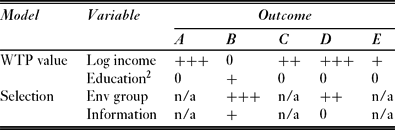
The models corresponding to the WTP to prevent an outcome were intended to represent the negative welfare change possibly associated with the scenarios presented (Table 4), and showed similar trends as for WTP to achieve outcomes: higher income led to higher WTP and members of environmental organizations were more likely to pay something to prevent an outcome. Landscape and biodiversity preferences could not be included in these models because, as expected, no respondent chose to pay to prevent an outcome which they had preferred. Provision of extra information had a very minor effect on these values, only for grouse moor specific subsidies (B).
Summary of results from Heckman selection models of WTP to avoid each combined outcome. The first part of the model estimates coefficients for the WTP value of respondents, whilst the lower, selection, model estimates coefficients for the expectation of being willing to pay something at all. There is no significant selection for WTP to prevent outcomes A, C or E, in which case the model equates to an OLS. All coefficients are positive, and +++ represents p < 0.001, ++ p < 0.01, + p < 0.05, (+) p < 0.1. 0 represents non-significant coefficients (p ≥ 0.1).

DISCUSSION
Although contingent valuation is a widely used method within environmental economics and wildlife conservation, it has rarely been used to assess the relative importance given by respondents to the landscape and wildlife elements of a natural area. We could not identify any studies that demonstrated the extent to which respondents had separable preferences for landscape and wildlife. Here, both are important in shaping overall preferences, and further work would be required to deduce the precise extent to which they are separable. Some respondents chose the overall outcome maintaining their landscape preference whilst others chose to maintain their biodiversity preferences, suggesting that they are separable to some degree and that these two elements are of differing importance to different respondents. To determine how these components combine into overall preferences for environmental areas would be an interesting topic for futher study. Given the ever-increasing human population and resulting competing land use demands, knowledge of which of these is likely to be more welfare-enhancing can aid in funding acquisition and development of acceptable conservation policies. This case study demonstrates that members of the public often have conflicting preferences, but are willing and able to make their own compromises given the necessary information and an opportunity to do so. It also demonstrates that individuals are willing to pay differing amounts for their choices, via voluntary contributions, with landscape choice exerting a somewhat larger influence on WTP for the combined landscape/biodiversity assemblage than the biodiversity choice.
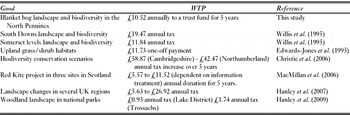
The ‘cute and cuddly effect’ reported in previous literature (Loomis & White Reference Loomis and White1996; White et al. Reference White, Bennet and Hayes2001) seems to be present in our study, with increases in rare and threatened birds and mammals being the most preferred biodiversity outcome. The associated landscape (blanket bog) was the second favourite landscape outcome and the combination of these was the most often preferred combined outcome and attained the highest WTP. Notably, even this outcome has a relatively low WTP when compared with some published results for similar goods on a similar scale (Table 5). Despite the differences in good being valued and in methodology adopted in previous similar studies (Table 5), it is reassuring that our results are towards the lower end of these estimates, particularly given our use of a voluntary contribution mechanism that may exacerbate overstatement of stated values (as discussed previously). Without conducting an experiment with real payments, it is impossible to judge whether our cheap talk script was instrumental in achieving this result. The continual reference to the ‘North Pennines’ made during the questionnaire in an attempt to clarify the limited geographical scale of the changes being valued may have helped. The values we estimated in our study were lower bounds to maximum WTP and represent solely what could be collected via a feasible voluntary contribution mechanism.
Previous WTP estimates for similar goods in UK (in GB£). The geographical scale is similar except for Christie et al. (Reference Christie, Hanley, Warren, Murphy, Wright and Hyde2006), and the last two examples (Hanley et al. Reference Hanley, Colombo, Kristrom and Watson2009), which are for the UK as a whole.

The outcomes associated with nature reserve style management (which could be achieved with back to nature subsidies) and re-wilding (outcomes D and E) are the only scenarios which would constitute a net benefit (to visitors in terms of socioeconomic valuations only; no other costs of landscape change are considered here) compared with the present situation (Table 2). Both blanket bog and woodland can be maintained or encouraged by very low intensity management and minimal disturbance, such as that expected in a nature reserve. Subsidies which reward moor management similar to that expected in a nature reserve to compensate for decreased grouse bags (number of birds shot) might result in an increase in blanket bog as represented in outcome D. Both blanket bog and (to a lesser extent) woodland can be, and presently are, maintained on red grouse estates, but only where management is sensitive to the low disturbance requirements of these habitats. A true re-wilding attempt may have unexpected and unpredictable consequences (inherent in the definition of re-wilding) not captured in scenario E, which may alter the relative benefit of this scenario, especially since respondents were not given information about any uncertainties involved.
Landscape seems to be somewhat more important to respondents than biodiversity in choosing their contribution amount, even though there were no differences in the proportions of landscape and of biodiversity choices matching the combined landscape/biodiversity choices. Fewer respondents were willing to pay to prevent than to achieve an outcome. However, including the option for negative valuations leads to qualitatively similar patterns as for the positive valuations (that is, the scenario with the lowest ‘WTP to prevent’, outcome D, is also the one with the highest ‘WTP to achieve’, whilst the scenario with the highest ‘WTP to prevent’, outcome C, is also the one with the lowest ‘WTP to achieve’), but with more extreme differences visible between the net benefits of those options which constitute a benefit and those which constitute a cost (Table 2). This broadly supports Leinhooop and MacMillans (Reference Lienhoop and MacMillan2007) assertion that ‘it is. . .feasible to include estimates of both WTP and WTA’. However, our research goes further, eliciting WTP to prevent an outcome as an alternative to the more problematic elicitation of a willingness to accept compensation amount (which tends to be much higher than corresponding WTP'; Whynes & Sach Reference Whynes and Sach2007; Sun et al. Reference Sun, van Kooten and Voss2009). Ours is one of only a few studies (for example Hanley et al. Reference Hanley, Colombo, Kristrom and Watson2009) that have estimated simultaneously positive and negative values for a change.
Although there is a small significant impact of the provision of information on the choice of the most preferred combined landscape/biodiversity outcomes, the effect of information on WTP is mostly non-existent. Our visitor sample was shown to be very knowledgeable about the British countryside and related issues, so perhaps the provision of this information would have had a larger effect on a less knowledgeable sample. Crucially, as this was a self-completion survey, it was not possible to assess the extent to which respondents read and reflected upon the extra information provided.
Socioeconomic factors were shown to be significant in preference and value formation, as demonstrated previously by Pilgrim et al. (Reference Pilgrim, Smith and Pretty2007), and discussed on a historical scale by Schama (Reference Schama1996). Income was very important, as expected from consumer theory (Estrin & Laidler Reference Estrin and Laidler1995).
Research such as ours is required to determine what the public values in the British countryside given the current state of transition and uncertainty as to its future. This state of transition is evident in recent reforms of the European CAP, changes in the importance of environmental issues within the UK (Kumar Reference Kumar2003), changes in laws affecting countryside sports and recreation (such as hunting laws and the Countryside and Rights of Way Act 2000) and the impending threat of climate change. These results suggest that in upland areas, such as the North Pennines, low intensity management that encourages habitats such as blanket bog and woodlands and maintains a mix of habitats would be most valued by visitors. However there is no single solution; no one outcome will satisfy everyone, nor provide for all rare and threatened species.
To the best of our knowledge, our study is the first to estimate visitor values for combined landscape and wildlife changes in the North Pennines in relation to real policy scenarios. This has important practical relevance to policy makers and land managers in the North Pennines and any other upland area which may have similar attributes. The study is also amongst a handful that have explored the competing influence of landscape and biodiversity in public preferences and to have explicitly estimated negative values. An increase in the proportion of blanket bog with corresponding changes in rare and threatened biodiversity (which might result from back to nature subsidies or nature reserve management) was shown to be the most frequently preferred and highest valued outcome, and landscape was shown to have a moderately larger impact on WTP than biodiversity elements, even though both are important for preference determination. Provision of specific elements of management information had only a small influence on the preferences of this knowledgeable sample. Finally, we demonstrate the importance of including the option for negative valuations, as not all landscape/biodiversity assemblages were seen as desirable by all people. Valuation studies such as this are not only important for informing conservation policy, but can also be useful when the good in question is a complex good, because they can successfully elicit relative valuations for alternative outcomes in situations with high cognitive demands on respondents, provided the scenarios are carefully constructed and reflect the available institutional funding mechanisms.
ACKNOWLEDGEMENTS
We are grateful to the Economic and Social Research Council (ESRC) for financial support and to the Game and Wildlife Conservation Trust for additional help with field work costs. We also thank the hundreds of respondents (including those who completed pilot versions of the survey) who gladly volunteered their time to complete our survey questionnaire. We acknowledge the contribution of colleagues at Silwood Park for all their help and advice during early pilot stages of the research. We also thank three anonymous reviewers for their insightful comments which improved the manuscript.