Listening to and processing spoken language can be effortful for children. Young listeners must perceive and make sense of highly complex and variable speech input using an immature language processing system. Moreover, children must regularly process language in less-than-ideal acoustic environments, such as classrooms, where they are exposed to poor signal-to-noise ratios (SNRs) and high reverberance (Crandell & Smaldino, Reference Crandell and Smaldino2000; Mealings, Buchholz, Demuth, & Dillon, Reference Mealings, Buchholz, Demuth and Dillon2015; Nelson & Soli, Reference Nelson and Soli2000). Such conditions can slow speech processing (Mealings, Demuth, Buchholz, & Dillon, Reference Mealings, Demuth, Buchholz and Dillon2015) and increase the listening effort required (Howard, Munro, & Plack, Reference Howard, Munro and Plack2010). This can have serious consequences for children. Slow language processing may cause children to miss incoming spoken content as they are still processing what was said previously (Mealings, Demuth, et al., Reference Mealings, Demuth, Buchholz and Dillon2015) and may thus result in children struggling to “keep up” during lessons. Due to the finite pool of cognitive resources available, effortful speech processing can draw resources away from other tasks, such as memory processes and consolidation of information (Howard et al., Reference Howard, Munro and Plack2010). In such circumstances, children’s academic performance is likely to suffer (Crandell & Smaldino, Reference Crandell and Smaldino2000; Nelson & Soli, Reference Nelson and Soli2000). These findings raise the question of how to facilitate more rapid and less effortful speech processing for children.
One way in which children’s speech processing may be made more efficient is by providing concurrent auditory and visual speech cues. The auditory percept of spoken language is often accompanied by a visual percept, for example, movements of the speaker’s face as they produce speech sounds. Listeners may use these movements as additional cues as they decode the speech signal. Studies of adult speech perception and processing have found facilitatory effects of audio-visual presentation (AV; i.e., presentation of concurrent auditory and visual speech cues) over auditory-only presentation (AO; presentation of auditory speech cues alone). Such facilitation is known as an “AV benefit” (see Campbell, Reference Campbell2008; Vatikiotis-Bateson & Kuratate, Reference Vatikiotis-Bateson and Kuratate2012, for reviews).
Adult listeners have repeatedly shown AV benefits for both their accuracy and speed of speech processing when listening in noisy conditions. Specifically, both the proportion of words or phonemes that listeners correctly detect, and the speed with which listeners can identify phonemes, increase when visual cues are present (e.g., Fort, Spinelli, Savariaux, & Kandel, Reference Fort, Spinelli, Savariaux and Kandel2010; Jesse & Janse, Reference Jesse and Janse2012; Ross, Saint-Amour, Leavitt, Javitt, & Foxe, Reference Ross, Saint-Amour, Leavitt, Javitt and Foxe2007; Sumby & Pollack, Reference Sumby and Pollack1954). Whether adult listening in noise shows a similar AV benefit for processing effort is less clear. While Picou, Ricketts, and Hornsby (Reference Picou, Ricketts and Hornsby2011) found no difference in the effort involved in processing AV and AO speech in noise when accuracy was kept constant across modalities, Gosselin and Gagné (Reference Gosselin and Gagné2011) found that processing AV speech was in fact more effortful than AO in this context. In partial contrast, Fraser, Gagné, Alepins, and Dubois (Reference Fraser, Gagné, Alepins and Dubois2010) found that the impact of visual cues was dependent on the amount of noise present: when noise was maintained at a constant SNR across modalities, listening in the AV modality was less effortful than AO, but when the level of noise in the two conditions was manipulated to produce equivalent task performance, the AV condition was more effortful. In addition, not all adults benefit from AV presentation to the same extent. Variability in the magnitude of AV benefits has been attributed to a range of listener characteristics. For example, greater working memory capacity, verbal processing speed and lip-reading ability all correlate with a greater reduction in processing effort when visual cues are available for adults listening in noise (Picou et al., Reference Picou, Ricketts and Hornsby2011; Picou, Ricketts, & Hornsby, Reference Picou, Ricketts and Hornsby2013).
Most research on AV benefits of any type has focused on listening in noisy conditions rather than in quiet. There is mixed evidence as to whether AV benefits occur in quiet conditions at all. Early findings suggested that AV benefits were inversely proportional to the amount of noise present (Sumby & Pollack, Reference Sumby and Pollack1954). In contrast, more recent accounts have suggested that AV benefits are greatest at intermediate SNRs (Ross et al., Reference Ross, Saint-Amour, Leavitt, Javitt and Foxe2007, Reference Ross, Molholm, Blanco, Gomez-Ramirez, Saint-Amour and Foxe2011) or remain consistent in magnitude across SNRs (Remez, Reference Remez, Vatikiotis-Bateson, Bailly and Perrier2005). AV benefits in quiet listening conditions tend to be minimal, if present at all, as there is less need to rely on cues other than the auditory signal (e.g., Ross et al., Reference Ross, Saint-Amour, Leavitt, Javitt and Foxe2007, Reference Ross, Molholm, Blanco, Gomez-Ramirez, Saint-Amour and Foxe2011; Sumby & Pollack, Reference Sumby and Pollack1954). However, some studies have found an AV accuracy benefit among adults in quiet listening conditions when the task was particularly difficult (Davis & Kim, Reference Davis and Kim2004), or the speech input complex (Reisberg, McLean, & Goldfield, Reference Reisberg, McLean, Goldfield, Dodd and Campbell1987). This suggests that rather than depending on the presence versus absence of noise, AV benefits may instead depend on task difficulty, which is increased in noisy conditions. The lack of AV benefit in quiet, particularly in studies investigating perception accuracy, may also be due to ceiling performance in the AO modality, which leaves no room for improvement with the addition of visual cues.
In sum, the addition of visual speech cues to the auditory signal is generally beneficial for adults listening in noise, improving their processing accuracy and speed. These cues may also potentially reduce their processing effort in noise, and may confer some degree of benefit in quiet. However, primary school children may not benefit from AV presentation in the same way. It is known that, like adults, children do benefit from visual speech cues to some extent: beginning in infancy, children show an AV benefit for accuracy when listening in noise (Fort, Spinelli, Savariaux, & Kandel, Reference Fort, Spinelli, Savariaux and Kandel2012; Knowland, Evans, Snell, & Rosen, Reference Knowland, Evans, Snell and Rosen2016; Lalonde & Holt, Reference Lalonde and Holt2015, Reference Lalonde and Holt2016; Lalonde & Werner, Reference Lalonde and Werner2019; Ross et al., Reference Ross, Molholm, Blanco, Gomez-Ramirez, Saint-Amour and Foxe2011), when listening to vocoded speech (Maidment, Kang, Stewart, & Amitay, Reference Maidment, Kang, Stewart and Amitay2015), and when listening to words/nonwords where the initial consonant has been excised from the auditory track (Jerger, Damian, Tye-Murray, & Abdi, Reference Jerger, Damian, Tye-Murray and Abdi2014). Furthermore, visual cues may enhance children’s phonological processing, as evidenced by greater phonological priming effects in AV compared to AO modality (Jerger, Damian, Tye-Murray, & Abdi, Reference Jerger, Damian, Tye-Murray and Abdi2017). However, no study has yet determined whether children show any AV benefit for speech processing speed or effort. Fort et al. (Reference Fort, Spinelli, Savariaux and Kandel2012) did attempt to examine the effect of AV presentation on 5- to 10-year-olds’ processing speed in noise using a phoneme monitoring task with word and nonword stimuli, but they were unable to analyze these data due to excessive variability in children’s reaction times (RTs). On a more perceptual level, Jerger, Damian, Karl, and Abdi (Reference Jerger, Damian, Karl and Abdi2018) found some evidence for AV benefits for speech detection speed using the nonsense syllable “buh”; however, it is unclear whether such AV benefits might generalize to higher, linguistic levels of processing (i.e., speech processing speed). In addition, no study has investigated whether AV benefits for speed and/or effort among children might be found in quiet conditions as well as noise, or whether variability between children in their magnitude of AV benefit for speed and/or effort may be attributable to various participant characteristics, as is the case for adults.
Children’s language processing abilities during the primary school years are not yet adultlike, with the cognitive functions that support language processing, such as executive control and working memory, still immature until late adolescence (e.g., Luciana, Conklin, Hooper, & Yarger, Reference Luciana, Conklin, Hooper and Yarger2005). Therefore, one might expect these children to benefit from visual cues more than adults do: they have more to gain from utilizing all available sources of information. However, it may also be that children are not as proficient as adults at integrating multimodal input (e.g., Lalonde & Holt, Reference Lalonde and Holt2016; McGurk & MacDonald, Reference McGurk and MacDonald1976), and are therefore less likely to benefit from the addition of visual cues. A gradual increase in AV benefit for accuracy has been observed from 5 years of age to adulthood (Fort et al., Reference Fort, Spinelli, Savariaux and Kandel2012; Maidment et al., Reference Maidment, Kang, Stewart and Amitay2015; Ross et al., Reference Ross, Molholm, Blanco, Gomez-Ramirez, Saint-Amour and Foxe2011). A range of factors could account for this development, including changes in children’s phonological skills associated with the onset of literacy development, and the possibility that increases in children’s processing resources with age may facilitate multimodal integration (Jerger, Damian, Spence, Tye-Murray, & Abdi, Reference Jerger, Damian, Spence, Tye-Murray and Abdi2009). However, this picture is complicated by a U-shaped developmental trajectory for the influence of visual cues on phonological processing, with AV presentation found to increase phonological priming in 4-year-olds and 10- to 14-year-olds, but not 5- to 9-year-olds (Jerger et al., Reference Jerger, Damian, Spence, Tye-Murray and Abdi2009). These studies suggest that primary school children may not benefit from visual cues to the same extent as adult listeners, and that integrating auditory and visual information may even increase processing effort. Children are also highly variable in their language skills, their AV integration capacity (e.g., Erdener & Burnham, Reference Erdener and Burnham2013), and their AV benefits for accuracy (e.g., Ross et al., Reference Ross, Molholm, Blanco, Gomez-Ramirez, Saint-Amour and Foxe2011), so we would expect them to exhibit individual variation in their degree of AV benefit for speed and/or effort, as well.
Given the lack of knowledge regarding the AV benefits for speed and effort displayed by primary school children, we proposed four research questions. First, will 7- to 11-year-old children show faster speech processing in AV than AO modality? Second, will these children show less effortful speech processing in AV than AO? Third, if AV presentation is found to enhance processing speed and reduce effort, will this occur in both noise and quiet, or in noise only? Fourth, will between-participant variability in AV benefit relate to certain participant characteristics, such as age, gender, working memory capacity, and/or how difficult participants find the task? It is important to answer these questions due to the practical implications for facilitating children’s speech processing, particularly in classroom situations as outlined above. However, there were also theoretical and clinical motivations: theoretically, if we do observe AV benefits in both quiet and noisy listening conditions, we can contribute to the body of evidence suggesting that AV benefits are not limited to speech in noise and degraded speech, but instead occur when processing is difficult, regardless of the cause of the difficulty. Clinically, by extending our knowledge of the AV benefits experienced by typically developing children, we will be better equipped to examine AV benefits among special populations of children, such as those with hearing impairment or learning difficulties, for whom visual speech cues may be particularly beneficial.
Our hypotheses were as follows. First, we expected that children would process speech faster in the AV than the AO modality, as 7- to 11-year-old children have previously shown AV benefits for accuracy in phoneme monitoring (Fort et al., Reference Fort, Spinelli, Savariaux and Kandel2012), and such accuracy benefits co-occur with speed benefits in adults (Fort et al., Reference Fort, Spinelli, Savariaux and Kandel2010). Second, due to the mixed results found for adults (Fraser et al., Reference Fraser, Gagné, Alepins and Dubois2010; Gosselin & Gagné, Reference Gosselin and Gagné2011; Picou et al., Reference Picou, Ricketts and Hornsby2011), it was an open question whether AV presentation would reduce or increase processing effort relative to AO, or have no effect. AV presentation might reduce processing effort for children as additional supporting speech cues are available, or it might increase processing effort as children need to perform the extra step of integrating auditory and visual modalities. Third, we expected any AV benefits for speed and/or effort to occur in both quiet and noise, as our methods were chosen to avoid ceiling performance in the AO modality, which may have contributed to the lack of AV benefit found in quiet in previous adult studies (e.g., Fort et al., Reference Fort, Spinelli, Savariaux and Kandel2010). However, we expected that AV benefits in noise would be greater than those in quiet, due to the increased difficulty of speech processing in noise, meaning that children would have more to gain from the visual cues in this condition. We also expected that processing would be slower and more effortful overall in noise than in quiet, regardless of modality, in agreement with previous findings from both adults and children (e.g., Hsu, Vanpoucke, & van Wieringen, Reference Hsu, Vanpoucke and van Wieringen2017; McGarrigle, Gustafson, Hornsby, & Bess, Reference McGarrigle, Gustafson, Hornsby and Bess2019; Winn, Edwards, & Litovsky, Reference Winn, Edwards and Litovsky2015; Zekveld, Heslenfeld, Johnsrude, Versfeld, & Kramer, Reference Zekveld, Heslenfeld, Johnsrude, Versfeld and Kramer2014; though see Hicks & Tharpe, Reference Hicks and Tharpe2002; McGarrigle, Dawes, Stewart, Kuchinsky, & Munro, Reference McGarrigle, Dawes, Stewart, Kuchinsky and Munro2017). Fourth, we hypothesized that one or more of the following four participant characteristics might predict the magnitude of AV benefits for processing speed and/or effort: age, gender, working memory capacity, and how difficult the task was for the participant (as indexed by phoneme isolation ability). Specifically, older children might show the greatest AV benefits due to their increased experience and capacity for AV integration (Fort et al., Reference Fort, Spinelli, Savariaux and Kandel2012; Maidment et al., Reference Maidment, Kang, Stewart and Amitay2015); girls might show greater AV benefits than boys as adult females tend to perform better than males at speech-reading (i.e., using visual information, including lip movements, facial expressions and gestures, to understand speech; Strelnikov et al., Reference Strelnikov, Rouger, Laglayre, Fraysse, Deguine and Barone2009), which is beneficial for AV speech perception (Picou et al., Reference Picou, Ricketts and Hornsby2011); greater working memory capacity might result in greater AV benefit by facilitating AV integration, as found for adults (Picou et al., Reference Picou, Ricketts and Hornsby2011); and children who find the task more difficult may show greater AV benefit than those who find it easier, as AV benefits may be greater when the task is more challenging (e.g., when listening conditions are more adverse; Sumby & Pollack, Reference Sumby and Pollack1954).
To test these hypotheses, we conducted a phoneme monitoring task using concurrent pupillometry. Phoneme monitoring involves listening to spoken stimuli and making a button-press response when a prespecified phoneme is heard, providing accuracy and RT metrics (Connine & Titone, Reference Connine and Titone1996; Cutler & Norris, Reference Cutler, Norris, Garrett, Cooper and Walker1979). Phoneme monitoring RT has previously been used as an index of speech processing speed among adults, adolescents, and children, including in studies of AV benefit (e.g., Fort et al., Reference Fort, Spinelli, Savariaux and Kandel2010, Reference Fort, Spinelli, Savariaux and Kandel2012). Pupillometry involves recording participants’ pupil dilation as they perform a task, which correlates with the amount of cognitive effort expended: greater pupil dilation reflects increased effort (Beatty & Lucero-Wagoner, Reference Beatty, Lucero-Wagoner, Cacioppo, Tassinary and Berntson2000; Engelhardt, Ferreira, & Patsenko, Reference Engelhardt, Ferreira and Patsenko2010; Kahneman & Beatty, Reference Kahneman and Beatty1966). We chose to use pupillometry as it allows us to measure effort without affecting the difficulty of the task. We avoided a dual-task approach, as used in previous studies of AV benefits for effort (Fraser et al., Reference Fraser, Gagné, Alepins and Dubois2010; Gosselin & Gagneé, Reference Gosselin and Gagné2011; Picou et al., Reference Picou, Ricketts and Hornsby2011), due to concerns regarding children’s ability to delegate attention across two tasks (Choi, Lotto, Lewis, Hoover, & Stelmachowicz, Reference Choi, Lotto, Lewis, Hoover and Stelmachowicz2008). In addition, we considered that performing phoneme monitoring in a dual-task context would be too challenging, especially for children. A range of pupillometry metrics have been used in language processing research (Schmidtke, Reference Schmidtke2018). We here analyze peak dilation (the maximum event-related pupil dilation [ERPD] during the trial), as analyzing mean pupil dilation across the trial is susceptible to variation in trial length. Finally, we performed a separate exploratory analysis to examine potential sources of individual variability.
In models of listening effort, such as the framework for understanding effortful listening (FUEL; Pichora-Fuller et al., Reference Pichora-Fuller, Kramer, Eckert, Edwards, Hornsby, Humes and Wingfield2016), processing speed is often conflated with or used as a proxy for processing effort, such that higher speed corresponds to lower effort. While it may be the case that processing speed and effort are underlyingly linked, we chose to treat them as separate constructs in this study for two reasons. First, in psycholinguistic literature processing speed is commonly regarded as a unique construct separate from effort (e.g., Hurtado, Marchman, & Fernald, Reference Hurtado, Marchman and Fernald2008; Leonard et al., Reference Leonard, Ellis Weismer, Miller, Francis, Tomblin and Kail2007; Peter et al., Reference Peter, Durrant, Jessop, Bidgood, Pine and Rowland2019), and dissociations between processing speed and effort have been found (Ayasse, Lash, & Wingfield, Reference Ayasse, Lash and Wingfield2017). Second, by treating processing speed and effort separately, we allow for potential effects of motivation on children’s speech processing to be observed. Motivation is a key feature of the FUEL, which proposes that the amount of effort expended on listening is primarily determined by a combination of the listener’s available cognitive capacity and their level of arousal or motivation. Motivational arousal itself may be affected by a wide variety of factors, such as how demanding the listening task is, the listener’s evaluation of the current demands on their cognitive capacity, and/or the listener’s perception of the importance of success on the listening task. If children are highly motivated to rapidly understand what is being said, they may thus exert greater cognitive effort in order to process faster, resulting in greater effort, but faster, rather than slower, responses. Conversely, when motivation is low, children may conserve their cognitive energy and therefore process speech more slowly.
The phoneme monitoring task used in the present study had a 2 x 2 design: Modality (AV vs. AO) was manipulated within subjects and Listening condition (quiet vs. noise) was manipulated between subjects. Manipulating Listening condition between subjects was necessary due to the length of the task: had participants been required to complete the task in both listening conditions, fatigue would likely have severely affected the quality of the data, and children may not have been able to complete the task at all. Given our hypotheses above, we expected to find effects of both Modality and Listening condition and an interaction between the two on each dependent variable (phoneme monitoring RT and peak pupil dilation).
Methods
Participants
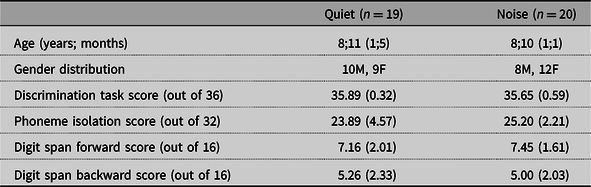
Thirty-nine children aged 7 to 11 years participated in the study (M age = 8 years, 10 months, SD = 1 year, 3 months; 18M, 21F). One further participant was excluded from all analyses for failing to follow instructions. Nineteen participants were randomly assigned to the quiet listening condition and 20 to the noise condition (see rows 1 and 2 of Table 1 for characteristics of the two groups). All were monolingual native speakers of English, with native English-speaking parents. No participant had any hearing, language, or cognitive impairment, or any vision impairment that was not corrected by glasses, according to a parental questionnaire. Parental written informed consent was obtained. All procedures were approved by the Macquarie University Faculty of Human Sciences Human Research Ethics Sub-Committee.
Participant characteristics and performance on discrimination, phoneme isolation and digit span tasks (means shown with standard deviations in parentheses)

Stimuli
The stimuli used in the phoneme monitoring task were designed to promote high monitoring accuracy. This was so a minimal number of trials would be excluded from the RT and pupillometry analyses due to errors (though high accuracy was also expected to mask any potential AV benefit for accuracy due to ceiling effects). Four target phonemes were chosen: /b, p, ɡ, k/. Only plosives were used, as manner of articulation can affect phoneme monitoring RTs (Treiman, Salasoo, Slowiaczek, & Pisoni, Reference Treiman, Salasoo, Slowiaczek, Pisoni and Pisoni1982). An even distribution of bilabial and velar phonemes was chosen to avoid any potential confound in the RT analysis: for bilabial phonemes, a salient visual cue (lip closure) is available before the auditory cue (release burst), meaning faster responses in the AV modality for bilabial phonemes could be due to relatively earlier cue availability, rather than any change in processing speed. However, this is not the case for velar phonemes, as the visual cue is not salient. Should the same apparent AV benefit be found across both places of articulation (PoAs) in the RT analysis, this would demonstrate that the benefit was due to a difference in processing speed, while an apparent benefit for bilabial, but not velar phonemes would implicate the relative timing of visual and auditory cues.
Twelve target words were chosen for each phoneme. The target phoneme always occurred as a singleton in word-initial position, to control for singleton versus cluster and word position effects on RT (Sasisekaran & Weber-Fox, Reference Sasisekaran and Weber-Fox2012; Treiman et al., Reference Treiman, Salasoo, Slowiaczek, Pisoni and Pisoni1982). All /k/ target words orthographically began with “c,” to avoid unnecessary variability due to orthographic effects on phoneme monitoring (Dijkstra, Roelofs, & Fieuws, Reference Dijkstra, Roelofs and Fieuws1995). Half of all target words were monosyllabic, and half were disyllabic. To ensure all were familiar to children, word frequencies were checked in the CBBC section of the SUBTLEX-UK database (Van Heuven, Mandera, Keuleers, & Brysbaert, Reference Van Heuven, Mandera, Keuleers and Brysbaert2014). Frequencies in this section are derived from subtitles from television programmes on the CBBC channel, aimed at 6- to 12-year-old children, and are thus appropriate for the age range of participants in the study. Words with a Zipf frequency lower than 3.00 are considered to be “low frequency” words (Van Heuven et al., Reference Van Heuven, Mandera, Keuleers and Brysbaert2014), so all chosen target words had a Zipf frequency higher than this. Each target word was embedded in a sentence of 9–12 syllables that did not contain any other occurrences of the target phoneme (Appendix A), based on those used by Holt, Demuth, and Yuen (Reference Holt, Demuth and Yuen2016). The target phoneme always occurred in the fifth or sixth syllable, to control for sentence-position effects on RT (Sasisekaran & Weber-Fox, Reference Sasisekaran and Weber-Fox2012), and was always preceded by a monosyllabic function word, to control for effects of preceding word length and frequency (Cutler & Norris, Reference Cutler, Norris, Garrett, Cooper and Walker1979). The speaker produced each sentence with the target word prosodically focused to control for prosodic effects on RT (Cutler & Norris, Reference Cutler, Norris, Garrett, Cooper and Walker1979; Holt et al., Reference Holt, Demuth and Yuen2016). A further eight sentences were constructed following the same constraints but containing /t, d/ as target phonemes, to be used as practice trials. Sixteen catch sentences were also created, which contained no instances of /b, p, ɡ, k/ but otherwise followed the constraints of the test sentences. As the position of the target phoneme was consistent across the test sentences, the catch sentences were intended to prevent participants from responding at the same position in each sentence without paying attention. Finally, an instruction sentence was created for each target phoneme block. These sentences informed participants which phoneme they were to monitor in the next block and were of the form “Listen for the [phoneme], as in [example] and [example].” Example words included the target phoneme as a word-initial singleton (as in the target words) and did not form a real word if it was exchanged for one of the other target phonemes in the task. This prevented any confusion.
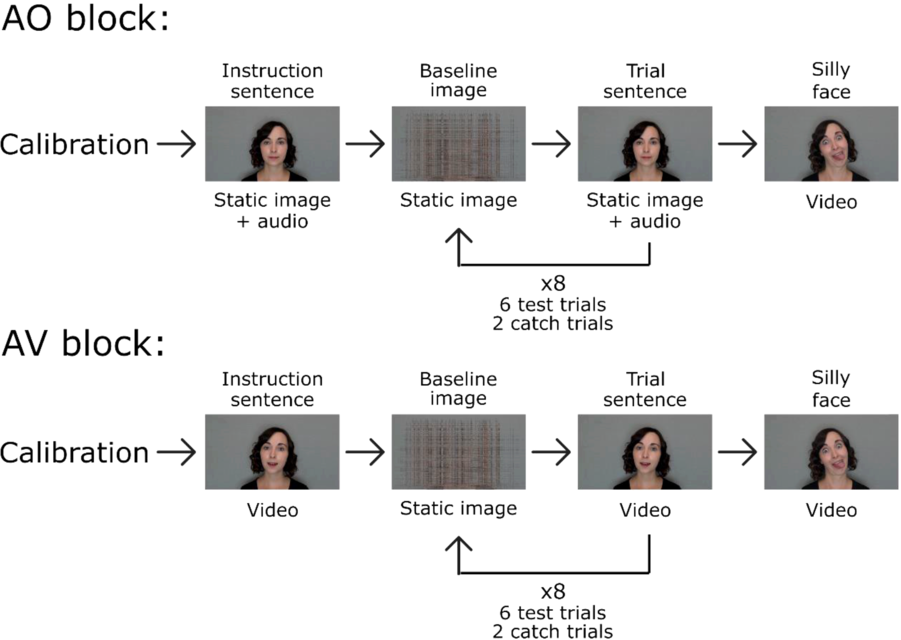
All sentences were spoken by a female monolingual native speaker of Australian English and were recorded using a Sony HXR-NX30P digital HD video camera (1080i/576i video resolution) with a Sony ECM-XMI electret condenser microphone (48 kHz sampling rate) attached via an XLR cable. The speaker wore a black t-shirt and was shown in front of a solid gray background (Figure 1). Her whole face and shoulders were visible and centered, and she began and ended each video with her mouth closed. As changes in luminance affect the magnitude of pupil dilation, lighting was kept constant throughout each video. The speaker’s head movements were kept minimal, as changes in the ratio of pixels in the (lighter) skin tone versus the (darker) background color may also affect luminance and thus pupil dilation. The speaker was not instructed to remain completely static, however, so that natural cues to prosodic focus through head movement would remain present in the stimuli. Participants’ eye movements may also influence pupil size, so the speaker’s face was consistently positioned in the center of the screen, with nothing present to attract participants’ eyes to other screen regions.
Schematic diagram of auditory-only and audio-visual block structure.

Video recordings were segmented so that each sentence was preceded and followed by 2000 ms of silence. The audio track was then extracted from each video and the mean intensity of each sentence normalized in Praat (Boersma & Weenink, Reference Boersma and Weenink2018). A second version of each audio track was created with overlaid pink noise at a –2 dB SNR using Praat Vocal Toolkit (Corretge, Reference Corretge2012), for use in the noise condition. This SNR was chosen as it was shown via pilot testing to be easy enough to prevent high rates of errors in phoneme monitoring, which would have resulted in data loss for the RT and pupil dilation analyses. To create the AV stimuli, the edited audio tracks were recombined with the video tracks. For the AO stimuli, the edited audio tracks were matched with a static image of the speaker’s face (a frame taken from the video recording in which the speaker looked at the camera with her mouth closed and had a smiling expression). Individual participants received a single version of each sentence (either AV or AO), but across participants each sentence was presented in both modalities.
Procedure
The testing session included the phoneme monitoring task and four additional tasks, completed in the order below, and took place in a quiet, windowless but well-lit room, so that constant luminance was maintained. The session lasted approximately 1 hr, and participants received financial reimbursement and a small treat. All computer-based tasks were presented using E-Prime 3 (Psychology Software Tools, Pittsburgh, PA) on an ASUS X550J laptop computer. Audio was presented via a Genelec 8020C external speaker centered behind the laptop on a raised platform, to prevent the sound from being muffled by the laptop screen. Speech was maintained at a constant volume of 60 dB SPL across participants. Responses were collected with a Cedrus RB-840 response pad for all computer-based tasks except the digit span task, which used a mouse.
Discrimination task
The discrimination task, adapted from Holt et al. (Reference Holt, Demuth and Yuen2016), ensured that all participants could successfully discriminate the phonemes used in the phoneme monitoring task. For each trial of this two-alternative forced choice task, participants were presented with a pair of images on the computer screen that formed a minimal pair differing in initial phoneme (e.g., bear/pear, goat/coat). They then heard the name of one of those images embedded in the carrier sentence “I said the word [target] again.” Sentences were presented in AO modality and at the same volume as the sentences in the phoneme monitoring task. Participants were instructed to select which of the two images matched the sentence.
Six image pairs were created to exhaustively test all combinations of the target phonemes /b, p, k, ɡ/. Each pair was presented six times: three times with each target word (36 trials total). A score of at least four out of six correct responses was taken to reflect successful discrimination of a given phoneme pair. Participants who were unable to successfully discriminate any phoneme pair were to be excluded from the data set; however all participants successfully discriminated all phoneme pairs, with a mean overall score of 35.77 out of 36 (see Table 1 for details).
Simple reaction time (SRT) task
Participants completed a SRT task to train them in making rapid button-press responses. This aimed to combat difficulties such as those experienced by Fort et al. (Reference Fort, Spinelli, Savariaux and Kandel2012), who found that children, especially those in the lower years of primary school, were highly variable in their RTs, preventing successful analysis of phoneme monitoring data. In the SRT task, a white fixation cross was presented repeatedly on a black screen (50 presentations total). The interval between presentations randomly varied in duration between 1000 and 3500 ms. Participants were instructed to make a button-press response with their dominant hand as quickly as possible each time the cross appeared on the screen. This rapid button-press in response to a stimulus was the same type of response as required in the phoneme monitoring task.
Phoneme monitoring task
Participants then completed the phoneme monitoring task. Pupil dilation data were collected using a Tobii X2-60 portable eye-tracker with a sampling frequency of 60 Hz. Participants were seated approximately 60 cm from the eye tracker. They were instructed to listen to the sentences while watching the screen and to make a button-press with their dominant hand as quickly as possible when they heard the target phoneme, but to avoid pressing the button when the target phoneme was not present. Participants were instructed to focus on the sounds they heard, rather than the spelling of the words. The task began with a block of practice trials, followed by eight test blocks. Half the participants received the four AV blocks followed by the four AO blocks, while the others received the reverse. Practice trials were always presented in whichever modality the participant received first. Participants were required to monitor for a single phoneme in each block. The order of presentation of phonemes within each modality was randomized for each participant.
The structure of each block was as follows (Figure 1). The eye-tracker was calibrated using a 9-point calibration. Then participants heard the relevant instruction sentence, telling them which phoneme to monitor for that block. Instruction sentences were presented in the same modality as the rest of the block and were always presented in quiet, even for participants who completed the task in noise. Then eight trials (six test trials and two catch trials) were presented in random order. For the analysis of pupil dilation it was necessary to measure baseline pupil dilation before each trial, in a context where participants were not presented with any stimulus but the luminance of the screen was equal to the luminance of the upcoming trial (cf. Tamási, McKean, Gafos, Fritzsche, & Höhle, Reference Tamási, McKean, Gafos, Fritzsche and Höhle2017). For this purpose we created “baseline images,” which were presented on screen for 2000 ms before each trial. These images consisted of an image of the speaker with the pixels scrambled so that the image was unrecognizable (see Figure 1). For AO stimuli, the source image used to create the scrambled baseline image was the static image that accompanied the audio during the trial. For AV stimuli, the source image was the first frame of the trial video. The baseline image was presented in silence for participants in the quiet condition and in noise for the noise condition. Regardless of modality, each block ended with a short video of the speaker making a silly face, to maintain participants’ attention.
Phoneme isolation task
The ability to isolate phonemes within words is a necessary skill for performing phoneme monitoring, and difficulty in isolating individual phonemes may increase the difficulty of the phoneme monitoring task. Participants therefore completed the phoneme isolation subtest of the Comprehensive Test of Phonological Processing–2nd edition (Wagner, Torgesen, Rashotte, & Pearson, Reference Wagner, Torgesen, Rashotte and Pearson2013), for the purposes of both participant exclusion and the analysis of individual variability. The first seven items of this subtest require participants to isolate word-initial singleton phonemes, which is the same phonological awareness skill that was required to complete the phoneme monitoring task. Difficulty increases after these seven items (e.g., isolation of coda consonants and isolation of phonemes in consonant clusters). Therefore, a participant scoring at least seven demonstrated sufficient phoneme isolation skill to complete the phoneme monitoring task and could provide valid responses. We planned to exclude any participant scoring less than seven, however every participant reached this threshold. For the purposes of the individual variability analysis, participants who scored lower on phoneme isolation were assumed to have found the phoneme monitoring task more difficult than those who scored higher.
Digit span task
A forward and backward visual digit span task was included to measure participants’ working memory capacity, for use in the individual variability analysis. A visual task was chosen to facilitate future comparison of this study’s results to those of children with hearing loss, for whom an auditory digit span task would not be appropriate. Strings of numbers ranging from two to nine digits in length were created using digits one to nine (no digit occurred more than once in each string). Participants were presented with two strings at each length in increasing order, with numbers appearing one-by-one on the computer screen, and were asked to input the string of numbers that they saw by clicking on an onscreen keypad. This procedure was completed twice: once with participants instructed to input numbers in the order they saw them (forward span) and once in reversed order (backward span). Forward and backward spans were scored separately as they may differentially tax subcomponents of working memory (e.g., Gathercole & Pickering, Reference Gathercole and Pickering2000; Reynolds, Reference Reynolds1997). One point was allocated for each string of numbers correctly recalled, for a score out of 16.
Analysis and results
Data were analysed in three parts: (a) behavioral responses (i.e., phoneme monitoring accuracy and RT), (b) pupillary responses, and (c) individual variability in both behavioral and pupillary responses. All statistical analyses were carried out in R (R Core Team, 2018).
Behavioral responses
Participants were highly accurate in the phoneme monitoring task: mean accuracy (i.e., correct detection of the target phoneme) per participant was 97% (SD = 7%), and 17 of the 39 participants were 100% accurate across all conditions (see Table 2 for details). Therefore, accuracy was considered to be at or near ceiling, as expected, and no further analysis was conducted. On average, participants pressed the response button on 3 out of the 16 catch trials (quiet group: M = 3.00, SD = 2.21; noise group: M = 3.55, SD = 2.54). This low number indicates that participants were attending to the task and made button presses based on perception, rather than anticipation, of the target phoneme (which would have resulted in a higher proportion of button presses on catch trials).
Phoneme monitoring accuracy across listening conditions and places of articulation (percent correct, total number of correct trials in parentheses)

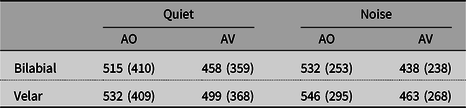
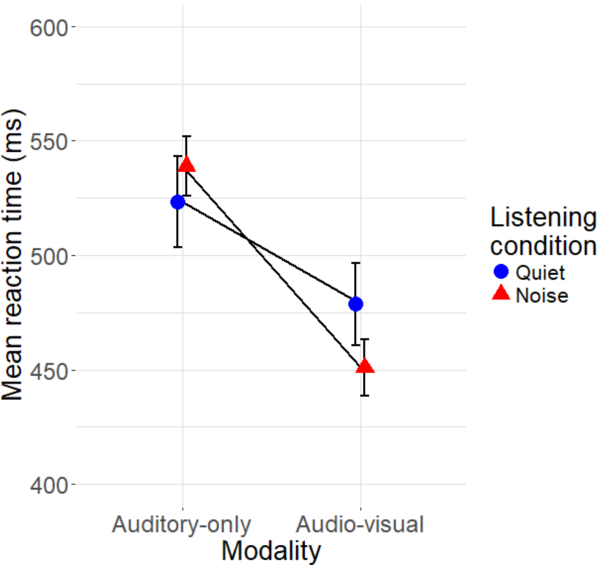
For the RT analysis, inaccurate trials (n = 58) and trials with unfeasibly short RTs (i.e., less than 100 ms [Holt et al., Reference Holt, Demuth and Yuen2016]; n = 43) were removed from the data set. A further five trials were discarded as they had extreme long RTs, greater than 3000 ms. The untransformed RT of the remaining 1,766 trials was then used as the dependent variable in a generalized linear mixed-effects model with family “inverse Gaussian” and identity link function (Lo & Andrews, Reference Lo and Andrews2015) using the lme4 package (Bates, Mächler, Bolker, & Walker, Reference Bates, Mächler, Bolker and Walker2015). The fixed factors were Modality (AV vs. AO), Listening condition (quiet vs. noise) and PoA (bilabial vs. velar; see mean RTs for each condition in Table 3). All contrasts were deviation coded (Modality: AO = 1, AV = –1; Listening condition: quiet = 1, noise = –1; PoA: bilabial = 1, velar = –1). A maximal random effects structure was used (Barr, Levy, Scheepers, & Tily, Reference Barr, Levy, Scheepers and Tily2013), with random intercepts for Participant and Item and random slopes for Modality and PoA by Participant and Modality and Listening condition by Item. As the model did not initially converge, the nAGQ argument was set to zero, meaning that a less exact form of parameter estimation than the default was used to enable faster computation, resulting in increased likelihood of model convergence. The model syntax was glmer(RT ~ Modality * ListeningCondition * PoA + (1 + Modality + PoA | Participant) + (1 + Modality + ListeningCondition | Item), data = RTData, family = inverse.gaussian(link = “identity”), nAGQ = 0). After model fitting, outliers were removed (data points for which the standardized residuals were greater than 2.5 SD from the mean; Baayen & Milin, Reference Baayen and Milin2010), then the model was refit and tested for statistical significance. In total, 49 outliers were removed and 1,717 trials were retained (8.3% of trials were rejected overall; see Appendix B for a by-participant breakdown of the number of included trials). The model showed a significant effect of Modality (β = –34.31, SE = 6.74, p < .001), indicating that participants responded 34 ms faster to AV than AO stimuli on average (Figure 2). No other effects or interactions of the fixed factors were found (all p ≥ .05).
Phoneme monitoring reaction time (ms) across listening conditions and places of articulation (standard deviations in parentheses)

Mean phoneme monitoring reaction times in auditory-only and audio-visual modalities across quiet and noisy listening conditions. Error bars represent one standard error of the mean.

Pupillary responses
Two analyses were performed on the pupil dilation data: the first used a baseline value that was calculated per trial (i.e., each trial had a unique baseline value), while the second used a baseline value calculated per participant (i.e., each participant had a single baseline value used across all their trials). This was motivated by findings from Wagner, Toffanin and Başkent (Reference Wagner, Toffanin and Başkent2016), who compared lexical access in natural and degraded speech, analogous to the quiet and noisy listening conditions in our study. Wagner et al. (Reference Wagner, Toffanin and Başkent2016) found that when a per-trial baseline was used for pupil dilation analysis, greater pupil dilation was elicited in natural than degraded speech, implying that lexical access was more effortful in the supposedly “easier” listening condition. When a per-participant baseline period was used, this effect was reversed: pupil dilation (and thus effort) was greater when speech was degraded, as would be expected given the existing literature (Hsu et al., Reference Hsu, Vanpoucke and van Wieringen2017; McGarrigle et al., Reference McGarrigle, Gustafson, Hornsby and Bess2019; Winn et al., Reference Winn, Edwards and Litovsky2015; Zekveld et al., Reference Zekveld, Heslenfeld, Johnsrude, Versfeld and Kramer2014). This difference in results can be attributed to the sustained effort associated with completing the task with degraded speech. Pupil dilation remains increased throughout the task in adverse conditions and does not return to original levels between trials. This causes baseline values calculated per trial to reflect already increased pupil dilation, so the baseline-corrected pupil values in this condition appear smaller than they really are. In contrast, the lesser amount of effort required to complete the task in optimal conditions allows pupil dilation to return to original levels between trials, giving an accurate reflection of effort using the per-trial baseline period. While a per-trial baseline period might be preferred as it can control for subtle differences in the luminance of the stimuli (Tamási et al., Reference Tamási, McKean, Gafos, Fritzsche and Höhle2017), we considered it possible that we would find a similar pattern of results to Wagner et al. (Reference Wagner, Toffanin and Başkent2016) when using a per-trial baseline period and so analyzed our data using both potential baseline periods. In both analyses, the time window for analysis for each trial began at the onset of the sentence and ended at the end of the trial (i.e., 2000 ms after sentence offset).
Per-trial baseline
Only trials which were retained in the RT analysis were entered into the pupillometry analysis (i.e., 1,717 trials). Data for these trials were preprocessed trial-by-trial, for each eye separately. Samples with pupil size values more than 2.5 SD from the trial mean were excluded. Then the difference between pupil sizes at successive sampling points was calculated and samples with difference values more than 2.5 SD from the trial mean were excluded. Missing and excluded samples were interpolated for strings of samples lasting 300 ms or less (Wagner et al., Reference Wagner, Toffanin and Başkent2016). As right and left pupil sizes were highly correlated (r = .91), they were then averaged (Schmidtke, Reference Schmidtke2014). The final 500 ms of baseline image presentation was selected as the per-trial baseline period (see Figure 1), as pupil size had typically stabilized by this point. Mean pupil size during the baseline period was calculated for each trial and ERPD was calculated for each sample according to the formula:
 $$ERPD = {pupil\ size - baseline\ value \over baseline\ value} \times 100\% .$$
ERPD values were smoothed using the rolling average function from the zoo package (Zeileis, Grothendieck, Ryan, Ulrich, & Andrews, Reference Zeileis, Grothendieck, Ryan, Ulrich and Andrews2018) with a window size of 10 samples. Trials were rejected if more than 50% of samples in either the baseline period or the trial period were missing. The peak dilation was then extracted per trial, defined as the maximum smoothed ERPD value for that trial.
As peak dilation values were normally distributed, a linear mixed-effects model was used. The fixed factors were Modality (AV vs. AO) and Listening condition (quiet vs. noise), both deviation coded as for the RT analysis, and the random effects structure was again maximal, including random intercepts of Participant and Item and random slopes of Modality by Participant and Modality and Listening condition by Item (model syntax: lmer(PeakDilation ~ Modality * ListeningCondition + (1 + Modality | Participant) + (1 + Modality + ListeningCondition | Item), data = PupilData)). As with the behavioral data, outlying data points with standardized residuals greater than 2.5 SD from the mean were removed before significance testing. A total of 1,262 trials were retained and 455 were rejected (26.5%; 429 had too many missing samples in either the baseline or trial period, 26 were outliers). The model showed a main effect of Listening condition (β = 2.43, SE = 0.69, p = .001), demonstrating that participants showed on average 2.43% greater pupil dilation in quiet than noisy listening conditions, the opposite of what was expected. No other effects or interactions reached significance (all p ≥ .05).
Per-participant baseline
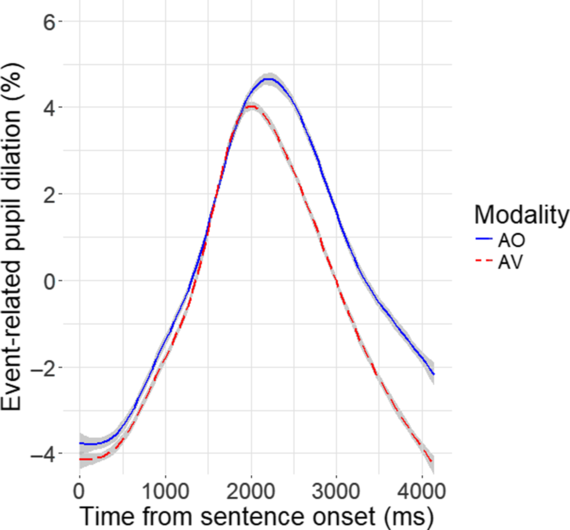
Data preparation and analysis for the second pupillometry analysis followed an identical procedure to the first, except that the baseline value used for all of a participant’s trials was their mean pupil size across the final 500 ms of the baseline image preceding the first practice trial (i.e., before the task had begun; Wagner et al., Reference Wagner, Toffanin and Başkent2016). The data entered into this analysis were trials that were retained in the RT analysis from a subset of 35 of the participants (n quiet = 17, n noise = 18; 1,585 trials). The other four participants were not included in this analysis as more than 50% of the samples in their baseline period were missing, making it impossible to establish a reliable baseline. A linear mixed-effects model was constructed as for the previous analysis. A total of 1,342 trials were retained and 243 were rejected (15.3%; 216 had too many missing samples in the trial period, 27 were outliers; see Appendix C for a by-participant breakdown of the number of included trials). The model showed a main effect of Modality (β = –0.76, SE = 0.26, p = .005), with 0.76% less pupil dilation in the AV than the AO modality (Figure 3). No other effects or interactions reached significance (all p ≥ .07).
Mean event-related pupil dilation in auditory-only (solid blue) and audio-visual (dashed red) modalities. Curves smoothed for presentation using a generalized additive model. Gray shaded areas represent the 95% confidence interval of the smoothing fit.

Individual variability
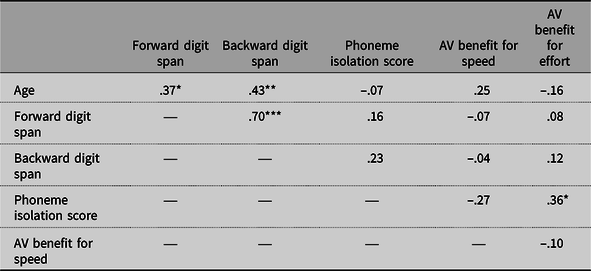
The exploratory analysis of individual variability focused on four participant characteristics: age, gender, working memory capacity, and task difficulty (see Table 1 for a summary of these characteristics). Before analysis, correlations between participant characteristics were examined. Forward and backward digit span scores were highly and significantly correlated, and both were significantly correlated with age (Table 4). To avoid multicollinearity, forward and backward digit spans were therefore excluded from the exploratory analyses.
Correlations between individual variability predictor variables and audio-visual benefits for processing speed and effort

Note: Audio-visual benefit for speed is quantified by the difference in phoneme monitoring reaction time between auditory-only and audio-visual modalities and audio-visual benefit for effort by the difference in peak pupil dilation between modalities for each participant. *p < .05. **p < .01. ***p < .001.
Exploratory analyses were then conducted separately for each of the dependent measures (RT and peak pupil dilation). Individual variability in accuracy was not investigated due to ceiling performance. In both cases, a new model was constructed, identical to the confirmatory analyses but with the remaining individual variability factors of Age, Gender, and Phoneme isolation score (indexing task difficulty) included. Model comparisons were then performed to minimize the number of factors in the model: starting from the maximal model, factors were removed one by one if they did not significantly improve model fit. In each case, Phoneme isolation score was found to contribute significantly to model fit, while Age and Gender did not. Therefore, Phoneme isolation score was the only individual variability factor retained in addition to Modality, Listening condition, and PoA. Outlier removal was conducted as for the confirmatory analyses before significance testing.
For the exploratory analysis of RT, one participant’s data were excluded as their phoneme isolation score was an outlier (a score of 8, compared to scores between 20 and 29 for the other participants), and this raised concerns that their score may exert undue influence on the results. Thus, data from 38 participants were included in the analysis reported below. The model syntax was glmer(RT ~ Modality * ListeningCondition * PoA * PhonemeIsolation + (1 + Modality + PoA | Participant) + (1 + Modality + ListeningCondition | Item), data = RTData, family = inverse.gaussian(link = “identity”), nAGQ = 0). Significance tests revealed an effect of Modality (β = –137.30, SE = 67.21, p = .04), analogous to the confirmatory analysis, but no other significant effects or interactions.
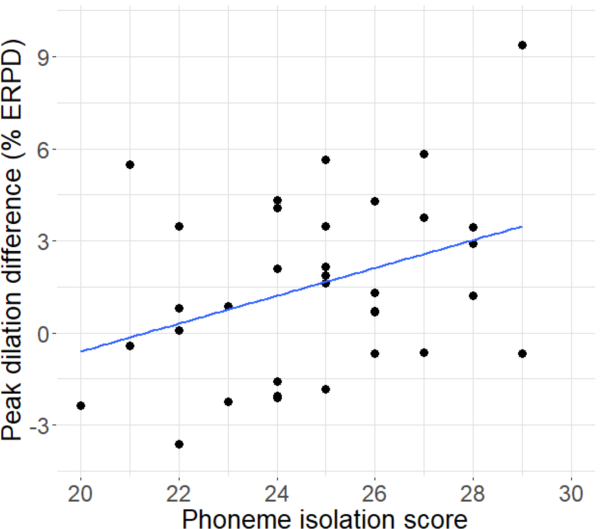
For the exploratory analysis of peak dilation, we used data that were baseline-corrected per participant (rather than per trial). This consisted of data from a subset of 35 participants (note that the participant with the outlying phoneme isolation score was among those for whom no reliable baseline could be established). Model syntax was lmer(PeakDilation ~ Modality * ListeningCondition * PhonemeIsolation + (1 + Modality | Participant) + (1 + Modality + ListeningCondition | Item), data = PupilData). Only a significant interaction between Modality and Phoneme isolation score was found (β = –0.24, SE = 0.10, p = .03). To further examine this interaction, differences in peak dilation were calculated for each participant by subtracting their mean peak dilation in the AV modality from their mean peak dilation in the AO modality, with a greater difference score indicating greater AV benefit for processing effort (see Figure 4). This revealed that participants with higher phoneme isolation scores tended to have the greatest AV benefit for effort.
Mean difference in peak pupil dilation between auditory-only and audio-visual modalities, shown according to phoneme isolation score. Each point represents one participant (n = 35). Greater difference indicates greater audio-visual benefit for effort. The blue line represents the significant correlation between phoneme isolation score and audio-visual benefit for effort.

Discussion
The current study used a phoneme monitoring task with concurrent pupillometry to determine whether adding visual speech cues to spoken input made speech processing faster and/or less effortful for 7- to 11-year-old children. We also asked whether these AV benefits for speed and effort would be found in quiet listening conditions as well as in noise, and whether individual variability in the magnitude of AV benefits could be explained by certain characteristics: age, gender, working memory capacity, and how difficult the task was for the participant. Processing speed was quantified using phoneme monitoring RT and processing effort was quantified by peak pupil dilation.
We found that 7- to 11-year-old children do show faster and less effortful processing when visual speech cues are present, as evidenced by the reduction in both RT and peak dilation in the AV modality compared to AO in our confirmatory analyses. Regarding RT, we note that no effect of PoA was found: participants did not respond significantly faster to bilabial than velar phonemes in the AV modality, as would be expected if RTs were reduced due to the earlier availability of visual than auditory cues. We note that there are other possible explanations of this lack of effect, including a lack of statistical power, and so we cannot definitively conclude that PoA has no effect on RT, however the significant overall effect of Modality suggests that AV benefits are found at both PoAs.
Regarding pupillary responses, we must highlight that these results for peak dilation come from the analysis of the pupil data that used a per-participant baseline period, rather than a per-trial baseline. Like Wagner et al. (Reference Wagner, Toffanin and Başkent2016), we found that using a per-trial baseline period gave counterintuitive results for peak dilation: dilation, and thus apparent processing effort, was greater in quiet than in noise, in contrast with both common sense and previous findings (Hsu et al., Reference Hsu, Vanpoucke and van Wieringen2017; McGarrigle et al., Reference McGarrigle, Gustafson, Hornsby and Bess2019; Winn et al., Reference Winn, Edwards and Litovsky2015; Zekveld et al., Reference Zekveld, Heslenfeld, Johnsrude, Versfeld and Kramer2014). As outlined above, we can attribute this to participants’ pupils failing to return to original levels of dilation between trials in the noise condition, resulting in artificially reduced peak dilation values. For this reason we adopted the results of the analysis that used the per-participant baseline, which was not subject to this artifact as it used a baseline period from before the task began. This has the additional benefit that fewer trials were rejected overall (15%, compared to 27% with the per-trial baseline). While the rate of rejection was still rather high (although lower than that of some other pupillometry studies with participants in a similar age range; e.g., McGarrigle et al., Reference McGarrigle, Dawes, Stewart, Kuchinsky and Munro2017), this can be explained by our equipment setup. The vast majority of rejected trials were excluded because of missing data, which likely occurred because we used a portable eye-tracking system with no chin rest. This gave participants freedom of head movement and made it easy for them to look away from the computer screen during the task (despite being instructed to keep their eyes on the screen as much as possible).
The children in our study seem to perform similarly to adults in previous studies, who show AV benefits for processing speed and effort (Fort et al., Reference Fort, Spinelli, Savariaux and Kandel2010; Fraser et al., Reference Fraser, Gagné, Alepins and Dubois2010; Jesse & Janse, Reference Jesse and Janse2012). However, given the mixed results regarding AV benefits for effort among adults, our results also contradict some of those previous findings (Gosselin & Gagné, Reference Gosselin and Gagné2011; Picou et al., Reference Picou, Ricketts and Hornsby2011). Fraser et al. (Reference Fraser, Gagné, Alepins and Dubois2010) found an AV benefit for effort only when stimuli in both modalities were presented at the same SNR and found an AO benefit when SNR was manipulated to induce equivalent task performance across conditions. In our study both SNR and task performance (as measured by phoneme monitoring accuracy) were equivalent across modalities. However, we note that our study differs from these previous adult studies by using pupillometry, rather than a dual-task paradigm, to measure effort. These paradigms may tap different aspects of effort (Alhanbali, Dawes, Millman, & Munro, Reference Alhanbali, Dawes, Millman and Munro2019; McGarrigle et al., Reference McGarrigle, Munro, Dawes, Stewart, Moore, Barry and Amitay2014; Strand, Brown, Merchant, Brown, & Smith, Reference Strand, Brown, Merchant, Brown and Smith2018), so some caution is required in relating our findings to these earlier studies.
We found no effect of quiet versus noisy listening conditions on either speed or effort (nor any interaction between Listening condition and Modality). This was unexpected, as we had anticipated slower responses and increased processing effort in noise overall, given previous results from both adults and children (Hsu et al., Reference Hsu, Vanpoucke and van Wieringen2017; McGarrigle et al., Reference McGarrigle, Gustafson, Hornsby and Bess2019; Winn et al., Reference Winn, Edwards and Litovsky2015; Zekveld et al., Reference Zekveld, Heslenfeld, Johnsrude, Versfeld and Kramer2014). Potentially, the SNR in our noise condition (–2 dB; chosen to minimize phoneme monitoring errors and thus data loss) may have been too favorable to slow processing or increase effort. Using pink noise as the masker may also have played a role, as it may not have overlapped spectrally with the speech signal enough to affect processing. While pink noise is similar to the white noise employed by Fort et al. (Reference Fort, Spinelli, Savariaux and Kandel2012), it is also unlike the types of noise typically encountered by children in real-life situations, especially classrooms, which may be better represented by babble noise. However, babble noise was inappropriate for this study as participants might have responded to instances of the target phonemes in the babble, rather than the target phonemes in the test sentences.
Alternatively, the lack of difference between quiet and noise conditions may be explained by our use of a between-subjects design and extensive variability between participants. In the peak dilation analysis, for example, the estimate for the effect of Listening condition was greater than that for the effect of Modality (β = 2.15 vs. β = –0.76). However, this relatively large difference for Listening condition failed to reach significance due to its large standard error. This suggests that an effect of Listening condition (and any interaction between Listening condition and Modality) may have be masked by excessive variability.
However, we note that, even though an effect of Listening condition was not found for either RT or peak dilation, Listening condition does seem to have affected baseline levels of pupil dilation throughout the task. This overall elevated level of pupil dilation in the noise condition resulted in our decision to use the per-participant, rather than per-trial baseline to calculate ERPD. This suggests that an overall effect of Listening condition may have been found if we had used a measure of pupil dilation that was baseline-corrected using a quiet baseline for all participants, rather than a baseline measured in quiet for participants who completed the task in quiet and a baseline measured in noise for participants who completed the task in noise. This may be a consideration for the design of future studies.
Despite the unexpected lack of effect for Listening condition, we do find that AV benefits for speed and effort occurred regardless of whether noise was present. This provides supporting evidence for the claim that, when ceiling performance is avoided, noise is not a prerequisite for finding an AV benefit for speed or effort.
As noted above, our participants were highly variable in their performance. We cannot rule out that some of this variability may have been contributed by factors such as undetected hearing loss, as we have had to rely on parental report regarding children’s hearing status due to the length of the testing session. However, by using participant characteristics in our exploratory analysis, we were able to account for some individual variability in peak pupil dilation.
For RT, participants overall displayed faster responses when visual cues were available. This was not modulated by any of the individual participant characteristics that we examined. However, for peak pupil dilation, our exploratory analysis revealed that the effect of Modality was stronger for some participants than others, depending on their phoneme isolation score (rather than a main effect of Modality, only an interaction between Modality and Phoneme isolation score was found). Phoneme isolation scores were included as an index of task difficulty: participants who scored lower on phoneme isolation were expected to find the task more difficult than those who scored higher. We hypothesized that participants with lower phoneme isolation scores would benefit from the addition of visual cues more than those with higher scores, as AV benefits tend to be greater when the task is more difficult (due to noise or otherwise; Davis & Kim, Reference Davis and Kim2004; Reisberg et al., Reference Reisberg, McLean, Goldfield, Dodd and Campbell1987; Sumby & Pollack, Reference Sumby and Pollack1954). However, it was instead children with higher phoneme isolation scores who showed the greatest AV benefits for effort (Figure 4).
This pattern of results may be due to differences in motivation between the higher and lower scoring participants. Lower scoring participants may have been highly motivated to perform well due to the perceived difficulty of the task, and thus recruited all available resources to detect the target phonemes as quickly as possible. This would then account for their improvement in processing speed in the AV modality, but only when their effort level is maintained. Conversely, higher scoring participants, for whom the task was less challenging, were able to achieve faster processing with visual cues, even with a reduction in effort. These participants may not have been as strongly motivated to complete the task as quickly as possible, but rather to complete the task successfully with the minimum effort expenditure. It may well be the case that, had effort been maintained at a stable level across participants, we would have observed differences in the magnitude of AV benefits for speed according to task difficulty instead. This interpretation aligns with the FUEL (Pichora-Fuller et al., Reference Pichora-Fuller, Kramer, Eckert, Edwards, Hornsby, Humes and Wingfield2016), in which motivation is highlighted as a factor which mediates listening effort, and which identifies the listener’s evaluation of task difficulty as a factor affecting their motivation. However, we acknowledge that alternative explanations of our results are also possible. For example, children with lower phoneme isolation scores may also have less fully developed multimodal phoneme representations which may be more effortful to access (Jerger et al., Reference Jerger, Damian, Spence, Tye-Murray and Abdi2009), preventing an AV benefit for effort among these participants.
In our confirmatory analysis, RT and pupil dilation metrics showed the same pattern of results. This is compatible with treating speed and effort as measures of the same construct, as is assumed when speed metrics such as verbal response time are used to index processing effort (e.g., McGarrigle et al., Reference McGarrigle, Gustafson, Hornsby and Bess2019). However, the results of our exploratory analysis do not accord with this view, as processing speed and effort were shown to have different relationships with Phoneme isolation score, suggesting that these measure different constructs in some circumstances. This is further supported by the lack of any significant correlation between AV benefits for processing speed and effort, shown in Table 4. This suggests that it would be valuable in future to continue examining speech processing speed and effort separately.
The results of our study have two main implications. First, as we have demonstrated that, overall, visual speech cues increase processing speed and decrease processing effort for 7- to 11-year-olds, visual speech cues may be beneficial for children’s speech processing in the classroom. Teachers may facilitate processing by ensuring their face is visible to the class when speaking, and by avoiding situations where students are required to process complex speech input while engaged in activities that prevent them from looking at the speaker. Second, our results suggest that a complex relationship exists between the magnitude of AV benefits and the difficulty of the task. It seems that children’s motivation to perform well on a task (which may be modulated by the difficulty of the task) may affect the degree to which they show AV benefits for effort. The extent to which they benefit from visual speech cues may therefore vary according to characteristics of individual tasks or listening situations, as well as other more stable properties of the listener or input speech signal (such as SNR or lip-reading skill, as reported in previous studies). Our findings may also provide some support for the inclusion of motivation in models of listening effort, as in the FUEL (Pichora-Fuller et al., Reference Pichora-Fuller, Kramer, Eckert, Edwards, Hornsby, Humes and Wingfield2016).
Our study gives rise to many promising avenues for future research. Future studies may further probe effects of quiet versus noise on AV benefits for processing speed and effort by manipulating this factor within subjects. This would increase the power available to detect effects and/or interactions of Listening condition and mitigate the issue of between-participant variability to some extent. In addition, it would be useful to examine whether the magnitude of AV benefits is affected by noise type (e.g., babble or speech-shaped noise), as different types of noise mask speech sounds to different extents. Future studies could also assess the effect of visual cues on processing speed and effort in a comprehension-related task, rather than a phonological task, which may relate more to what children are typically required to do in real life, particularly in the classroom. They could also consider what aspect(s) of the AV speech signal are responsible for the observed benefit: it may be that children are primarily making use of the speaker’s lip movements to facilitate their processing, or they could be relying more on prosodic information conveyed by the speaker’s head and eyebrow movements (e.g., Cvejic, Kim & Davis, Reference Cvejic, Kim and Davis2010; Kim, Cvejic, & Davis, Reference Kim, Cvejic and Davis2014). This question may be addressed in part by considering how lip-reading skill relates to the magnitude of AV benefits in this population, or by having participants monitor for phonemes that do not occur in prosodically focused words. A more comprehensive investigation of the effect of task difficulty on AV benefits for effort would also be useful, to provide confirmatory evidence for the effects that we observe in our exploratory analysis. Finally, future research could extend this type of task to other populations, such as children with hearing loss, who may use visual speech cues differently to the typically developing children in this study.
Conclusion
In this study we investigated whether 7- to 11-year-old children show faster and less effortful speech processing when visual speech cues are available. We found that this was the case, however, not all children benefited to the same extent. Children with better phoneme isolation ability, who likely found the task to be easier, showed the greatest AV benefits for effort. In addition, we found that these AV benefits were present in both quiet and noisy listening conditions. Our findings therefore indicate (a) that children’s speech processing in classroom situations may be facilitated when the speaker’s face is visible; (b) that the presence of noise is not a necessary prerequisite for observing AV benefits for speed and effort; and (c) that children vary in how they recruit visual speech information according to the difficulty of the task, perhaps as a function of their motivation.
Acknowledgments
We thank Elise Tobin and Julien Millasseau for assistance with stimuli recording; Craig Richardson for technical assistance; Peter Humburg for statistical advice and the Child Language Lab, Macquarie University, for their feedback. This project was supported by the Australian Research Council (ARC FL130100014; ARC CE110001021) and Macquarie University (MQ RIS83034101). Portions of this work were presented at the 32nd Annual CUNY Conference on Human Sentence Processing (Boulder, CO, USA) and the 19th International Congress of Phonetic Sciences (Melbourne, Australia).
Appendix A. Test sentences
The children placed their books on the counter.
The girl left her bike at her uncle’s house.
The campers saw a bear in the forest.
The woman cooked the beans in the saucepan.
The child drew a boat on the newspaper.
Grandma gave a bone to the puppy.
The ladies put their basket in the car.
The girl drew a border around her drawing.
The girl put on her beanie when her ears got cold.
The doctor wrapped a bandage around the girl’s leg.
The girl sewed some buttons onto her school dress.
His dad went to the butcher to get some steak.
They had eaten some pies after the game.
The boys liked the pigs that were at the farm.
The boy used a pen to write his name.
The chef cleaned all the pots in the kitchen.
The artist left his paint on the floor.
The thief tore his pants as he ran away.
The women saw some ponies running around.
The girl lost her pencils on the excursion.
Her sister loved the pandas at the zoo.
The children ate some pizza for their dinner.
They used all the peaches when making the cake.
The dog chewed all the pages in the book.
The boy scored a goal at the football match.
The two boys bought a game at the toyshop.
The auntie bought a gift for the little boy.
The tradesman fixed the gate with his hammer.
The man saw a ghost walk down the hallway.
The farmer fed the geese in the afternoon.
The chef chopped the garlic to put in the soup.
The flowers for his girlfriend wilted in the heat.
The boy saw a gecko climbing the wall.
The plants in the garden needed more water.
The man took out his garbage every Thursday.
The boy thought a goldfish would be the best pet.
The two boys wrote a card for their mother.
The ruins of the camp were found by the boys.
They looked for the cave where the bats were hiding.
The young girl left her comb on the table.
The man lost his coat at the cinema.
The girl broke her cup when she dropped it on the floor.
The ladies brought some carrots from their garden.
The boy stained the carpet when he spilt his juice.
The girl left the cabbage on her plate.
The young man on the corner dropped his wallet.
The shop with the curtains belongs to the men.
The tourist loved the castle in the valley.
Appendix B. Trials included in reaction time analysis
The number of trials per participant, modality and place of articulation that were included in the confirmatory reaction time analysis. The maximum possible number of trials per cell is 12.

Appendix C. Trials included in peak dilation analysis
The number of trials per participant, modality and place of articulation that were included in the confirmatory peak dilation analysis with by-participant baselines. The maximum possible number of trials per cell is 12.