1. Pseudo-torsions as reduced representations for RNA conformational space
1.1 The problem of RNA backbone complexity
The challenge of building an RNA structure is much like building a house from flexible rods that rotate in eight different places. Every time you attempt to shape the rod in one spot, it rotates in another spot, and you soon discover that it is impossible to build anything stable without reducing the dimensionality of the system and finding a new type of building material.
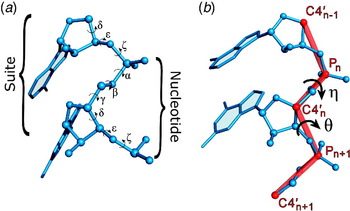
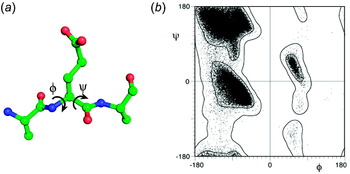
We first confronted this problem while attempting to build a three-dimensional model of a small hairpin-loop region (Domain 5, D5) within a self-splicing group II intron. This RNA substructure is not highly complex, as it consists only of an extended RNA duplex that is capped by a GNRA tetraloop and interrupted in its center by an asymmetric, two-nucleotide bulge (Abramovitz et al. Reference Abramovitz, Friedman and Pyle1996). However, when we attempted to create an ab-initio model of D5 using the version of MC-SYM that was available at that time (Major et al. Reference Major, Turcotte, Gautheret, Lapalme, Fillion and Cedergren1991), we obtained hundreds of distinct structural solutions (Duarte & Pyle, Reference Duarte and Pyle1998). The program was, correctly, representing the fact that each nucleotide in an RNA structure can flex and rotate about seven individual torsion angles (α, β, γ, δ, ∊, ζ and χ) (Fig. 1a) and adopt one of at least two major sugar pucker configurations (C2′-endo and C3′-endo). The output from MC-SYM reflected the reality that each RNA building block has eight degrees of freedom. In a protein structure, each peptide building block has only two degrees of freedom: φ and ψ (phi and psi, Fig. 2a), thereby representing a significantly simpler geometry problem than the modeling of RNA.
The RNA backbone. (a) Diagram of a nucleotide showing the six standard backbone torsion angles (α, β, γ, δ, ∊ and ζ). The nucleotide and suite divisions of the backbone are indicated. A nucleotide is centered about the ribose sugar and spans two phosphates, while a suite is centered about the phosphate and spans two sugars. (b) Diagram depicting the definitions of the pseudo-torsions, η and θ. The red lines indicate the pseudo-bonds that connect successive P and C4′ atoms. The portion of the backbone shown affects a single pair of η and θ values, as the pseudo-torsions extend into the previous and next nucleotide. Figure modified from Wadley et al. (Reference Wadley, Keating, Duarte and Pyle2007) with permission.

The peptide backbone. (a) Diagram of a peptide showing the two variable backbone torsions (φ and ψ). (b) A Ramachandran plot of φ versus ψ showing approximately 81 000 non-glycine, non-proline and non-pre-proline residues from a high-resolution database, along with validation contours for favored and allowed regions. Figure reprinted from Lovell et al. (Reference Lovell, Davis, Arendall, De Bakker, Word, Prisant, Richardson and Richardson2003) with permission.

When confronted with the numerous models for D5 structure, we decided to address the problem by visually examining each one. We found that, while each structure was slightly different, the models could actually be grouped into a few major structural categories. On visual inspection, members of these categories appeared similar, and although individual torsion angles within these groups varied, they compensated for one another resulting in similar overall shapes. This phenomenon had been previously documented on a smaller scale: early studies of RNA structure noted the ‘crankshaft’ effect, where compensatory rotations of torsion angles helped to maintain base-stacking interactions (Holbrook et al. Reference Holbrook, Sussman, Warrant and Kim1978; Olson, Reference Olson1982). As a result, we began to wonder whether the individual backbone torsion angles of RNA were, in fact, useful indicators or predictors of specific RNA structures.
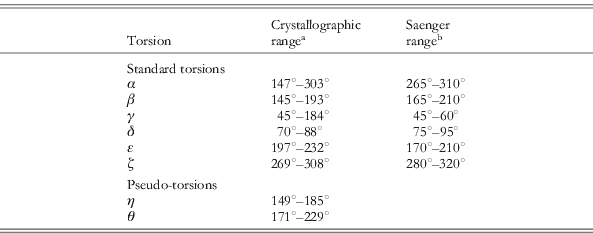
Despite the wide ranges of standard torsions within our model structures, it was not clear as to whether this variation would actually be seen in real, crystallographically determined structures. We therefore examined whether standard torsion angles could uniquely describe the conformation of nucleotides within the most rigid form of natural RNA structure: the A-form helix. In order to approach this problem, we asked whether the empirically determined and generally accepted ranges for individual torsions that were published in the literature (Saenger, Reference Saenger1984) were observed in two high-resolution crystal structures of A-form RNA (Portmann et al. Reference Portmann, Usman and Egli1995), one of which was ultimately refined to 1.4 Å (Egli et al. Reference Egli, Portmann and Usman1996). Surprisingly, we observed that only a few helical nucleotides within the crystal structures fell within the standard torsion range defined previously for A-form RNA. In addition, we observed wide variation in standard torsion angles for A-form nucleotides within the crystal structures, suggesting that individual torsion angle ranges were not precise descriptors of discrete conformations (Duarte & Pyle, Reference Duarte and Pyle1998). We recently repeated this examination using several helical RNA crystal structures solved at 1.2 Å or better, and the results matched our previous observations: A-form nucleotides contain a wide range of standard torsion values (Table 1).
Angle ranges for A-form helical nucleotides
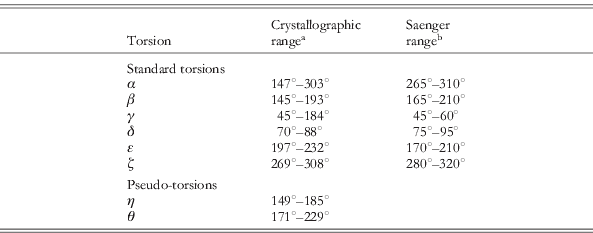
The standard torsions alone are poor discriminators of A-form structure due to the wide range of allowed torsion values. The pseudo-torsions present far narrower ranges and can easily be used to identify A-form nucleotides.
a Crystallographic ranges were determined using high-resolution helical structures (⩽1.2 Å resolution, PDB IDs: 1QCU, 2Q1R, 2V7R, 2VUQ, 3GVN, 434D). The first and last nucleotide of each chain were excluded due to the greater flexibility allowed at chain ends.
b For reference, torsion ranges published in 1984 are provided (Saenger, Reference Saenger1984).
Based on this experience, we sought a new way to describe RNA that reduced the dimensionality of RNA backbone configuration and did not implicitly depend on the identity of bases or pairings within a molecule. Nevertheless, we wanted the new formalism to accurately capture the discrete conformations that were empirically observed for whole RNA structures and specific RNA motifs. Perhaps more importantly, we wanted to employ a description that was intuitively understandable (few humans can think in eight dimensions) and that computers could process rapidly. To this end, we developed the η/θ formalism for describing RNA backbone configuration.
1.2 The development of η and θ as descriptors of nucleotide conformation
Inspired by the simplicity of protein structure, we sought to determine whether the RNA backbone could be approximated by connecting sequential phosphates and sugars through a series of artificial rods (pseudo-bonds; Fig. 1b), of which there would be two per nucleotide. We predicted that the two torsion angles between these virtual bonds might provide a metric of conformational space, much like the function of φ and ψ in proteins (Fig. 2), and we hoped that the simplified, two-variable description would be comprehensible to humans and computers alike. Our approach was inspired by previous attempts to reduce the dimensionality of nucleotide conformation using tools such as modular blocks (Westhof et al. Reference Westhof, Masquida and Jaeger1996), virtual bonds (Olson, Reference Olson1975; Olson & Flory, Reference Olson and Flory1972), and principal component analysis of correlations in standard torsion angles (Beckers et al. Reference Beckers, Melssen and Buydens1998).
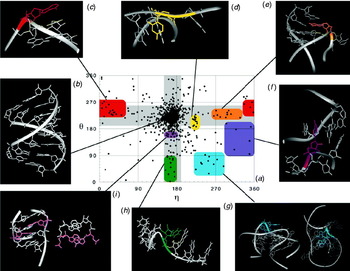
When we used the phosphate and C4′ atoms as anchor points for the virtual bonds, a plot of the resultant pseudo-torsion angles resulted in clusters of data (Fig. 3a) (Duarte & Pyle, Reference Duarte and Pyle1998), as observed in a φ−ψ plot that is calculated from protein structures (Fig. 2b). Such clustering was not observed for pseudo-torsions resulting from other choices of backbone anchor points. After observing this clustering, we named these torsions η and θ, where η referred to the torsion of C4′i−1, Pi, C4′i and Pi+1, and θ referred to the torsion of Pi, C4′i, Pi+1 and C4′i+1 (Fig. 1b). The two-dimensional plot of these torsions was therefore named an η/θ plot. In 1998, when this work was done (Duarte & Pyle, Reference Duarte and Pyle1998), the database of solved structures was small and there were few large RNA molecules that contained elements of complex tertiary motifs. Nonetheless, distinct nucleotide clusters could be identified in both the center of the η/θ plot (which turned out to represent the abundant nucleotides involved in A-form helices) and in various well-spaced regions of the plot (Fig. 3a, colored blocks).
Features of the η−θ plot. (a) An η−θ plot published in 1998 shows all nucleotides from a database of 53 RNA structures. Gray bars represent areas of the plot where either η or θ is in the same range as nucleotides in the helical region. Colored areas are regions of the plot that contain nucleotides that share similar structural features. Note that η−θ plots from later analyses are shown in Figs 6, 8 and 20. (b)–(i) Representative nucleotides from the regions of the plot indicated. (b) The helical region: the intersection of the two gray bars include nucleotides from the crystal structure of an A-form duplex (from PDB file 1rxa; Portmann et al. Reference Portmann, Usman and Egli1995). (c) Stacked turn region; exemplified by the second nucleotide of a GNRA loop (PDB file 1zif, Ade 5; Jucker et al. Reference Jucker, Heus, Yip, Moors and Pardi1996). (d) The χ-switch region: includes the nucleotide 5′ to the cleavage site of the hammerhead ribozyme (PDB file 300d, Cyt B170; Scott et al. Reference Scott, Murray, Arnold, Stoddard and Klug1996). (e) Flip-turn region; exemplified by APK A27 G pseudo-knot nucleotide G9 (PDB file 1kpd, Gua 9; Kang & Tinoco, Reference Kang and Tinoco1997). (f) The C2′-bend region, includes tRNAPhe tertiary contact nucleotide G18 (PDB file 1tra, GUA 18; Westhof & Sundaralingam, Reference Westhof and Sundaralingam1986). (g) The stack switching region, exemplified by P456 domain pivot nucleotides (PDB file 1gid, nucleotides Ade A122, Ade A123; Cate et al. Reference Cate, Gooding, Podell, Zhou, Golden, Kundrot, Cech and Doudna1996). (h) The base twist region: includes the last stem nucleotide of a kissing hairpin (PDB file 1kis, Ura 21; Chang & Tinoco, Reference Chang and Tinoco1997). (i) The cross-strand stack region: includes all 5′ nucleotides in sheared tandem R-R pairs (PDB file 1gid, Ade A113, Ade A206; Cate et al. Reference Cate, Gooding, Podell, Zhou, Golden, Kundrot, Cech and Doudna1996). Figure reprinted from Duarte & Pyle (Reference Duarte and Pyle1998) with permission.

Having observed that nucleotide conformers tend to cluster in η/θ space, it was important to determine whether there was any physical meaning to the co-localization of these points on the plot. A first challenge for this analysis was to define the spatial boundaries of each cluster, and to determine which points belonged inside these boundaries. We would then be able to analyze the clustered spots and determine if they represented structurally similar nucleotides in all-atom space. At the time of this analysis (Duarte & Pyle, Reference Duarte and Pyle1998), the clusters contained an insufficient number of data points for application of a statistically rigorous clustering analysis (this was performed later, with a more mature database (Wadley et al. Reference Wadley, Keating, Duarte and Pyle2007), vide infra). We therefore chose to categorize only the most well-populated clusters and to use simple geometric shapes to visually define their boundaries (colored blocks, Fig. 3a). Once the clusters were designated, we then examined each spot within a clustered group, referring back to the original PDB file from which each set of coordinates was calculated (Fig. 3b–i). This analysis was made possible by the development of the first in a series of computational tools designed specifically to investigate RNA conformational space using the pseudo-torsional formalism: AMIGOS (Algorithmic Method of Identifying and Grouping Overall Structure) (Duarte & Pyle, Reference Duarte and Pyle1998).
Much to our surprise, given the radical reduction in dimensionality of the η/θ approximation, nucleotides within a given cluster shared very similar three-dimensional structures and often belonged to the same type of building block within known RNA motifs. For example, a pronounced group of co-localized points is found in the upper left region of the plot, centered at approximately η 225°, θ 30° (Fig. 3c) (Duarte & Pyle, Reference Duarte and Pyle1998). The vast majority of nucleotides falling within this cluster are part of a sharp turn in which a new stacking axis is established on the 5′-side of the nucleotide. This is the conformation adopted by the second nucleotide within canonical U-turns and GNRA tetraloop motifs, and we therefore named this the ‘stacked turn region’. A similar analysis was performed with eight different regions of the plot (Fig. 3b–i), resulting in the identification of discrete regions of η/θ space in which the vast majority of nucleotides represented the same type of RNA conformational unit. Each of these building blocks represents an obligate component of a specific RNA tertiary structural motif (Duarte & Pyle, Reference Duarte and Pyle1998).
It was clear from this primitive analysis that the η/θ formalism represented a useful tool for analyzing and building RNA structures. It was also significant that one of the two anchor points chosen for the virtual bonds defining η and θ (the phosphorus) represents the atom that is the most easily recognized in electron density maps of RNA X-ray diffraction. Thus, we anticipated that the approach might one day be useful in building structures from crystallographic data. However, we realized that both structure building and further cluster analysis would require a considerably larger database of solved structures, which was not available at the time. In the meantime, the η/θ formalism was used as a platform for the development and use of new tools designed to explore the diversity of RNA conformational space (Beuth et al. Reference Beuth, Pennell, Arnvig, Martin and Taylor2005; Correll & Swinger, Reference Correll and Swinger2003; Giambasu et al. Reference Giambasu, Lee, Sosa, Robertson, Scott and York2010; Huppler et al. Reference Huppler, Nikstad, Allmann, Brow and Butcher2002; Jovine et al. Reference Jovine, Hainzl, Oubridge, Scott, Li, Sixma, Wonacott, Skarzynski and Nagai2000; Keating et al. Reference Keating, Toor and Pyle2008; Scharpf et al. Reference Scharpf, Sticht, Schweimer, Boehm, Hoffmann and Rosch2000; Sigel et al. Reference Sigel, Sashital, Abramovitz, Palmer, Butcher and Pyle2004; Szep et al. Reference Szep, Wang and Moore2003; Tamura & Holbrook, Reference Tamura and Holbrook2002), which was a burgeoning new problem in structural biology.
1.3 Other virtual bond systems
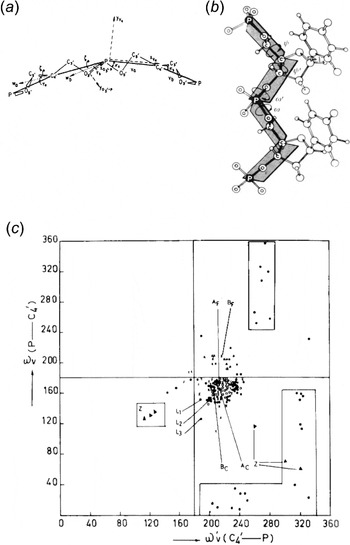
It is important to note that η and θ were not the first pseudo-torsional system for conceptualizing RNA conformation. Indeed, a phosphate- and sugar-atom-based virtual bond system was independently developed three separate times (Fig. 4). The first of these was published by Olson and Flory in 1972, employing a virtual bond system anchored at the phosphate and C5′ atoms (Olson & Flory, Reference Olson and Flory1972). Three years later, Olson published a simpler system that represented each nucleotide by a single virtual bond using only the phosphate atom (Olson, Reference Olson1975). In 1980, Olson published her final virtual bond system, which employed the C4′ atom in place of the C5′, as this was better able to account for the effects of base-stacking (Olson, Reference Olson1980) (Fig. 4a). Several months later, Malathi and Yathindra published an identical P-C4′ system (Malathi & Yathindra, Reference Malathi and Yathindra1980) and conducted a number of analyses using this system throughout the early 1980s (Malathi & Yathindra, Reference Malathi and Yathindra1980, Reference Malathi and Yathindra1981, Reference Malathi and Yathindra1982, Reference Malathi and Yathindra1983, Reference Malathi and Yathindra1985) (Fig. 4b). Interestingly, one of these studies published in 1985 (Malathi & Yathindra, Reference Malathi and Yathindra1985) contained an analysis of pseudo-torsional values using an ω′v−ωv plot (Fig. 4c), which is conceptually identical to the η−θ plot presented above (Fig. 3a). When we first published the η−θ pseudo-torsions in 1998 (Duarte & Pyle, Reference Duarte and Pyle1998), we were unaware of the Yathindra system and its application as a two-dimensional plot for analyzing tRNA structure. It is inherently significant that three separate research groups independently converged on the phosphate and C4′ atoms as anchor points for a virtual bond system, as it underscores the robustness and utility of this specific methodological approach.
A phosphate- and C4′-based virtual bond system has been independently developed three separate times. (a) The first such system was published in July of 1980 by Olson. Figure reprinted from Olson (Reference Olson1980) with permission. (b) Several months later – November, 1980 – Malathi and Yathindra independently published an identical virtual bond system (Malathi & Yathindra, Reference Malathi and Yathindra1980). Figure reprinted from Malathi & Yathindra (Reference Malathi and Yathindra1982) with permission. (c) An ω′v−ωv plot published in 1985 by Malathi and Yathindra (Malathi & Yathindra, Reference Malathi and Yathindra1985). The ω′v angle is the torsion about the C4′-P virtual bond and is identical to θ, and the ωv angle is the torsion about the P-C4′ virtual bond and is identical to η. (Note that the ω′v and ωv axes are reversed from those in the η−θ plots shown in Figs 3, 6, 8 and 20). The points on this plot represent nucleotides from oligonucleotide and yeast tRNAPhe crystal structures. Figure reprinted from Malathi & Yathindra (Reference Malathi and Yathindra1985) with permission.

More recently, while adapting the η/θ formalism for crystallographic RNA model building (Keating & Pyle, Reference Keating and Pyle2010) the C4′ atom was replaced by the C1′ atom (resulting in the η′ and θ′ torsions, vide infra). Subsequently, another research group also independently determined that C1′ was superior to C4′ for this type of application (Gruene & Sheldrick, Reference Gruene and Sheldrick2011; Keating & Pyle, Reference Keating and Pyle2010). Thus, for purposes of automated building of RNA into electron density, the P and C1′ atoms appear to be the optimal anchors for a virtual bond system.
2. Validating and testing the η/θ formalism
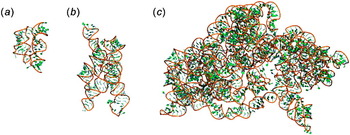
After the publication of Duarte & Pyle (Reference Duarte and Pyle1998), the number of high-resolution RNA crystal structures climbed sharply. Many of these molecules contained complex architectural elements and provided much-needed information on the diversity of tertiary structural motifs (Fig. 5). This wealth of new information can be attributed, in part, to the successful crystallization and structural analysis of ribosomes and their subunits (Ban et al. Reference Ban, Nissen, Hansen, Moore and Steitz2000; Ramakrishnan, Reference Ramakrishnan2002; Schluenzen et al. Reference Schluenzen, Tocilj, Zarivach, Harms, Gluehmann, Janell, Bashan, Bartels, Agmon, Franceschi and Yonath2000; Wimberly et al. Reference Wimberly, Brodersen, Clemons, Morgan-Warren, Carter, Vonrhein, Hartsch and Ramakrishnan2000), which contain massive rRNA components (Fig. 5c). But other molecules such as self-splicing introns (Adams et al. Reference Adams, Stahley, Kosek, Wang and Strobel2004; Golden et al. Reference Golden, Kim and Chase2005; Guo et al. Reference Guo, Gooding and Cech2004; Juneau et al. Reference Juneau, Podell, Harrington and Cech2001), large and small ribozymes (Ferre-D'Amare et al. Reference Ferre-D'amare, Zhou and Doudna1998; Kazantsev et al. Reference Kazantsev, Krivenko, Harrington, Holbrook, Adams and Pace2005; Rupert & Ferre-D'Amare, Reference Rupert and Ferre-D'amare2001; Serganov et al. Reference Serganov, Keiper, Malinina, Tereshko, Skripkin, Hobartner, Polonskaia, Phan, Wombacher, Micura, Dauter, Jaschke and Patel2005; Torres-Larios et al. Reference Torres-Larios, Swinger, Krasilnikov, Pan and Mondragon2005) and riboswitch RNAs (Batey et al. Reference Batey, Gilbert and Montange2004; Montange & Batey, Reference Montange and Batey2006; Thore et al. Reference Thore, Leibundgut and Ban2006) were also structurally characterized at this time (Fig. 5a,b). These RNAs are particularly rich in complex tertiary contacts and their structures greatly expanded our understanding of conformational diversity in RNA molecules. By the beginning of 2006, these new RNA structures resulted in a greatly expanded database for analysis of η/θ space and they set the stage for rigorous evaluation of pseudo-torsional formalisms.
The late 1990s and early 2000s saw the publication of a wealth of complex RNA tertiary structures, including (a) the thiamine riboswitch (PDB ID: 1CKY; Thore et al. Reference Thore, Leibundgut and Ban2006), (b) the group I intron (PDB ID: 1U6B; Adams et al. Reference Adams, Stahley, Kosek, Wang and Strobel2004) and numerous ribosomal structures. (c) Shown here is the 16S ribosomal RNA from the bacterial 70S ribosome (PDB ID: 2JOO; Selmer et al. Reference Selmer, Dunham, Murphy, Weixlbaumer, Petry, Kelley, Weir and Ramakrishnan2006). All structures are shown to scale. In each, the backbone is shown as an orange ribbon and the bases are shown in green.

The new database not only provided more structures for calculating η/θ coordinates, it provided a larger set of higher-resolution structures. This allowed us to apply more stringent filtering criteria and to select the highest-quality files for inclusion in the database. As in our previous work, we avoided sample redundancy (e.g. only one tRNAPhe is included, despite the numerous examples in the protein data bank) and we now applied a resolution cut-off of 3.0 Å. For structures in this category, the positions of P and C4′ can typically be reasonably well determined. Further selection criteria were imposed on individual nucleotides within the database, resulting in a final set of 7407 nucleotides (Wadley et al. Reference Wadley, Keating, Duarte and Pyle2007).
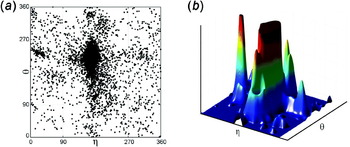
The η/θ coordinates were calculated for all nucleotides within the final dataset and results were displayed on a scatter plot (Fig. 6a). As predicted, clusters of nucleotides were more densely packed than we had observed previously (Duarte & Pyle, Reference Duarte and Pyle1998), and additional clusters appeared (Wadley et al. Reference Wadley, Keating, Duarte and Pyle2007). However, there were still a number of points in this scatter plot that did not fall into any clearly defined cluster. Additionally, despite the maturation of the structural database, we recognized that additional clusters were likely to exist. As a result, we sought a global method for analyzing structural similarity between any arbitrary set of proximal nucleotides on the η/θ plot.
The effect of windowing an η−θ plot using a Blackman window function. (a) An η−θ scatter plot of all nucleotides from the (Wadley et al. Reference Wadley, Keating, Duarte and Pyle2007) dataset. Each point shows the η and θ values of an individual nucleotide. (b) The result of applying the Blackman window to the dataset, colored from low to high density: blue, green, yellow and red. An upper cut-off has been applied to allow for better discernment of the peaks surrounding the helical region. Figure modified from Wadley et al. (Reference Wadley, Keating, Duarte and Pyle2007) with permission.

2.1 A global correlation between η/θ and conformation
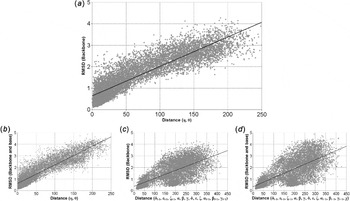
In order to examine the global correlation between η/θ coordinate co-localization and structural similarity as defined by RMSD (root mean square deviation), we chose random pairs of nucleotides from the dataset and plotted their distance from one another in η/θ space (in degrees) versus the RMSD of their backbone position (Fig. 7a). A striking linear relationship is observed (correlation coefficient R 2=0.80, P≪0.001), indicating that, irrespective of relative plot location, co-localized nucleotides share similar structures (Wadley et al. Reference Wadley, Keating, Duarte and Pyle2007). Surprisingly, the tight correlation is maintained even when the position of base atoms are included in the RMSD calculation (Fig. 7b). It is particularly illustrative to compare these results with a similar plot that is calculated using standard torsion angles. In the latter case, there is no correlation between RMSD and proximity of nucleotides in standard torsion space for all but the most similar of nucleotides (Fig. 7c,d; R 2=0.50). This analysis confirms that the η/θ pseudo-torsions, but not the individual backbone torsion angles, can serve as global descriptors of discrete RNA conformations.
Scatter plots of RMSD versus distance in the η−θ plane or standard torsional angles. For each plot, the best fit line for 10 000 random pairs of nucleotides from the dataset is shown. (a) RMSD of backbone atoms versus distance in the η−θ plane. The correlation coefficient is 0.80. (b) RMSD of backbone, sugar and base atoms versus distance in the η−θ plane. The correlation coefficient is 0.81. (c) RMSD of backbone atoms versus distance of standard torsional backbone angles. The correlation coefficient is 0.50. (d) RMSD of backbone, sugar and base atoms versus distance of the standard torsional angles (including χ). The correlation coefficient is 0.50. Figure reprinted from Wadley et al. (Reference Wadley, Keating, Duarte and Pyle2007) with permission.

2.2 Identifying and characterizing high-density regions of the η/θ plot
After confirming the global relationship between the pseudo-torsions and nucleotide conformation, we further examined the clustering in the η/θ plot. While the high-density regions of the plot were visually evident, they were not defined or circumscribed using standard statistical techniques. In order to identify the statistically significant regions of the plot and to establish their boundaries, we experimented with a series of window functions that convert the η/θ plot into a density function, thereby differentiating signal from noise (Wadley, Reference Wadley2006). The Blackman window function (a kernel smoothing technique commonly employed in astronomy (Kolb, Reference Kolb1980)) provided the best balance between efficiency and accuracy (Harris, Reference Harris1978), allowing us to readily visualize and categorize the most highly populated regions of the plot (Wadley et al. Reference Wadley, Keating, Duarte and Pyle2007). The scatter plot was thereby transformed into a topological map of η/θ space, and each region of high density appeared as a proportionally sized peak on the plot (Fig. 6b).
Having delineated densely populated regions of the η/θ plot by purely statistical methods, we then sought to determine the extent to which nucleotides within each region were structurally similar at atomic resolution. The best way to make this determination was to conduct a direct RMSD superposition of nucleotides within each region, comparing the nucleotides with one another and with a prototype that was most representative of this region of η/θ space. We wrote a script that enabled us to communicate directly between each pair of η/θ coordinates (e.g. a point on the η/θ plot) and the original location of a nucleotide within a specific PDB file, allowing us to call up individual sections of original structures and compare them to one another by superposition. From this analysis, we calculated a ‘regional score’, defined as the fraction of nucleotides that superimpose with an RMSD lower than 0.95 Å (Wadley et al. Reference Wadley, Keating, Duarte and Pyle2007).
2.3 The importance of sugar pucker as an additional variable
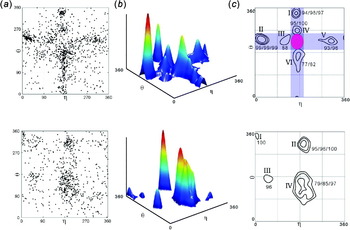
Examination of these scores revealed that a few regions of the η/θ plot represented overlapping sectors that were composed of two structurally distinct populations. In order to increase dispersion of the plot and differentiate these populations graphically, we set out to determine the structural feature that distinguished these conformers. In order to address the overlap issue, we filtered the constituents of each region by C2′ and C3′ endo sugar pucker based on the pseudo-phase angle of the furanose ring (Saenger, Reference Saenger1984) (later, we also applied other metrics to discriminate sugar pucker, vide infra). This analysis revealed that members of the overlapping regions differed in their sugar conformation, and were easily separated by constructing different η/θ plots for the two different major types of sugar pucker (Fig. 8a) (Wadley et al. Reference Wadley, Keating, Duarte and Pyle2007). With the regional scoring system established through RMSD comparison, and the sugar pucker differentiation in place, we were then able to define bona-fide structural clusters of nucleotides in η/θ space by setting a lower limit on the regional score (initially 70%).
Clusters of non-helical nucleotides in the η−θ plot become more apparent after the dataset is divided by sugar pucker. (a) A scatter plot of the η−θ values of all non-helical C3′-endo (top) and C2′-endo (bottom) nucleotides. (b) A 3D view of the plot of C3′-endo (top) and C2′-endo (bottom) nucleotides with a 60° wide Blackman window function applied. (c) A contour plots resulting from analyzing the C3′-endo (top) and C2′-endo (bottom) density plots in (b). Contour levels are shown at 1σ, 2σ and 4σ levels, and scores are given in that order. These cluster scores report the percentage of nucleotides within the specified region that are superimposable with the corresponding prototype nucleotide. Contours with small populations (<9) are not shown. The blue bars span the helical η values and the helical θ values for C3′-endo nucleotides. The pink elliptical area near the center of plot indicates the helical region that was initially excluded from the analysis. Figure modified and reprinted with permission from Wadley et al. (Reference Wadley, Keating, Duarte and Pyle2007).

This resulted in 11 spatially and structurally distinct clusters of nucleotides in η/θ space (Fig. 8b,c) (Wadley et al. Reference Wadley, Keating, Duarte and Pyle2007). In each cluster, the degree of structural identity increases as one moves to the center of each region, resulting in contour plots that resemble a geographic topographical map, where the center of the region approaches >95%. The majority of data points fall within these spatially and structurally defined clusters, underscoring the finding that RNA conformation is highly discrete and that η/θ space is a reasonable proxy for all-atom structural space (Wadley et al. Reference Wadley, Keating, Duarte and Pyle2007).
We were able to assign the plot clusters to specific nucleotide conformations and to associate these with specific RNA tertiary structural motifs. These analyses allowed us to begin analyzing and utilizing RNA conformational space in new ways. For example, at this stage we began using sets of allowed η/θ coordinates to build and model RNA molecules (vide infra) (Wadley et al. Reference Wadley, Keating, Duarte and Pyle2007). In addition, we noticed that the base-planes of nucleotides that share η/θ space are almost identical, despite of the fact that χ and other descriptors of base location are not explicitly included in the η/θ formalism (Wadley et al. Reference Wadley, Keating, Duarte and Pyle2007). This led to us to investigate the role of backbone conformation in setting base orientation (vide infra).
3. The η/θ formalism as platform for innovation in RNA structural biology
Immediately after the first pseudo-torsional validation paper was published in 1998, the η/θ formalism was applied as a tool by structural biologists. Like the PROCHECK program for protein crystal structures (Laskowski et al. Reference Laskowski, Macarthur, Moss and Thornton1993), AMIGOS quickly became useful for building η/θ plots of new structures and scanning them for substructures that appear in unusual or potentially ‘disallowed’ regions. This provides the crystallographer with a method for double-checking a model and determining whether a section of RNA should be built differently (Beuth et al. Reference Beuth, Pennell, Arnvig, Martin and Taylor2005; Huppler et al. Reference Huppler, Nikstad, Allmann, Brow and Butcher2002; Jovine et al. Reference Jovine, Hainzl, Oubridge, Scott, Li, Sixma, Wonacott, Skarzynski and Nagai2000; Scharpf et al. Reference Scharpf, Sticht, Schweimer, Boehm, Hoffmann and Rosch2000). However, the pseudo-torsions are capable of significantly more than simply classifying individual RNA nucleotides. In the past decade, η and θ have been used in a wide variety of applications.
3.1 PRIMOS: an η/θ adaptation for RNA motif comparison and identification
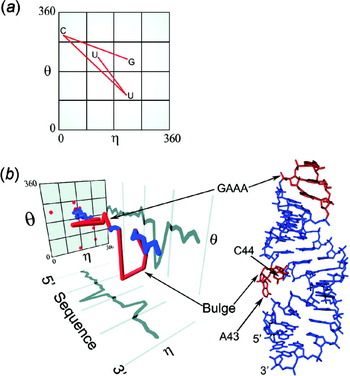
When the nucleotides comprising a specific RNA structural motif (e.g. a GNRA tetraloop, A-platform, etc.) are diagrammed on an η/θ plot, it becomes apparent that the path between these points contains valuable information. The path is a ‘signature’ for a motif that is uniquely described by a string of η/θ coordinates (Fig. 9a) (Duarte et al. Reference Duarte, Wadley and Pyle2003). While this is clearly a useful formalism, it becomes unintelligible once a motif or RNA substructure exceeds a certain size. This problem can be circumvented, and the information content within the path preserved, by incorporating nucleotide position as a third dimension of the plot (Fig. 9b) (Duarte et al. Reference Duarte, Wadley and Pyle2003). This serves to pull the string of η/θ coordinates out of the plane, connecting them along the sequence axis (Fig. 9b). The result is a computationally searchable roadmap of an RNA structure that contains all of the relevant information about constituent structural motifs. Also called an ‘RNA worm’, these maps can be created in seconds for any RNA structure, regardless of size, and they can be used to align and compare the structural features of RNA molecules.
RNA motifs can be identified using η−θ worms. (a) A two-dimensional representation of the worm for the UUCG tetraloop motif. (b) A three-dimensional representation of a worm for the group II intron domain V structure (Sigel et al. Reference Sigel, Sashital, Abramovitz, Palmer, Butcher and Pyle2004). This worm clearly reveals the location of a GAAA tetraloop and an extra-helical bulge (both of which are indicated in red on the worm and the structure). Figure reprinted from Duarte et al. (Reference Duarte, Wadley and Pyle2003) with permission.

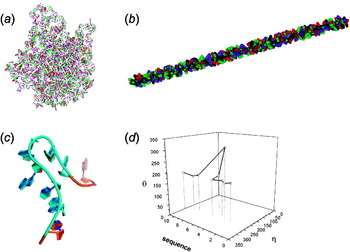
Once an RNA substructure has been solved through crystallography or NMR (nuclear magnetic resonance), PRIMOS (Probing RNA structures to Identify Motfis and Overall Structural changes), a computational tool designed to perform structural comparisons and motif searches using the pseudo-torsional formalism) can be used to create a characteristic ‘worm’ for the element, which serves as a unique identifier (Figs 9b and 10d). The worm is then used to search the entire database of RNA structures for identical or related motifs. In this way, a database of computationally searchable fingerprints for known tertiary structural motifs was created and used for structural analysis. For example, worms of the GNRA tetraloop and other common RNA structural elements were created and then used as ‘bait’ for screening the library of solved structures, which have themselves been converted to a linearized ‘worm’ formalism. The ‘bait’ worm is strung along the worm of an intact target structure, and their degree of conformational overlap at any given interval is continuously scored, thereby revealing structural matches between bait and target (Duarte et al. Reference Duarte, Wadley and Pyle2003). This approach allowed investigators to rapidly examine the database to determine the composition of motifs within their structures, to observe motifs in multiple structural contexts and to investigate how individual motifs contribute to larger substructures. In one such example, the hook-turn (Fig. 10c, initially identified from an crystallographic structural study of a ribosomal RNA loop E sequence motif) was demonstrated to be a recurrent motif by using its worm as ‘bait’ for screening the library of solved ribosome structures (Fig. 10d) (Szep et al. Reference Szep, Wang and Moore2003). This exercise revealed the presence of four other hook-turn examples, which facilitated phylogenetic analysis of the family members and established the hook-turn as a building block within RNA tertiary structures (Szep et al. Reference Szep, Wang and Moore2003).
PRIMOS analysis of the ribosome. (a) The tertiary structure of the 50S subunit of the ribosome (Ban et al. Reference Ban, Nissen, Hansen, Moore and Steitz2000). (b) The 50S subunit represented as an η−θ worm. (c) The hook turn, a motif found in the ribosome that was initially identified using PRIMOS (Szep et al. Reference Szep, Wang and Moore2003). (d) A three-dimensional worm for the hook-turn motif. (d) Reprinted from Szep et al. (Reference Szep, Wang and Moore2003) with permission.

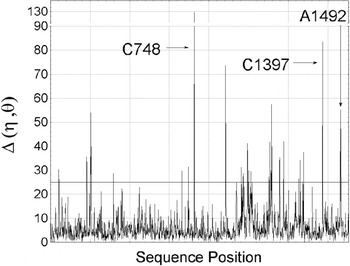
There is no limit to the size of an RNA structure that can be analyzed by PRIMOS, which readily detects subtle structural changes that occur on ligand binding to RNA molecules even as large as the ribosome. Ligand-induced conformational changes are detected by creating worms of the bound and free RNA structures and then computationally passing them through one another using a scoring algorithm (Fig. 10a,b) (Duarte, Reference Duarte2002; Duarte et al. Reference Duarte, Wadley and Pyle2003). Conformational rearrangements that occur in response to ligand binding are identified as sharp signals (Fig. 11), even in cases where direct structural superposition has failed.
PRIMOS analysis can reveal changes between two related structures. Here, two 30S structures are compared: one unbound (PDB code IBL; Ogle et al. Reference Ogle, Brodersen, Clemons, Tarry, Carter and Ramakrishnan2001) and one bound by paromomycin and a tRNA anticodon stem-loop (PDB code 1KQS; Schmeing et al. Reference Schmeing, Seila, Hansen, Freeborn, Soukup, Scaringe, Strobel, Moore and Steitz2002). The line at 25° indicates a threshold above which nucleotides are considered to have different conformations in each complex. Some regions undergoing conformational changes between the complexes are indicated: the A site (A1492), the P site (C1397) and a site in the platform domain (C748). Figure reprinted from Duarte et al. (Reference Duarte, Wadley and Pyle2003) with permission.

For example, there are multiple structures of ribosomal subunits bound to diverse antibiotics, which have been reported to induce local structural changes at the sites of ligand binding (Brodersen et al. Reference Brodersen, Clemons, Carter, Morgan-Warren, Wimberly and Ramakrishnan2000; Klein et al. Reference Klein, Schmeing, Moore and Steitz2001; Nissen et al. Reference Nissen, Hansen, Ban, Moore and Steitz2000; Ogle et al. Reference Ogle, Brodersen, Clemons, Tarry, Carter and Ramakrishnan2001; Ramakrishnan, Reference Ramakrishnan2002; Schmeing et al. Reference Schmeing, Seila, Hansen, Freeborn, Soukup, Scaringe, Strobel, Moore and Steitz2002; Wimberly et al. Reference Wimberly, Brodersen, Clemons, Morgan-Warren, Carter, Vonrhein, Hartsch and Ramakrishnan2000). These studies utilized conventional methods such as visual inspection and RMSD superposition, rendering it difficult to detect all of the structural changes induced by the antibiotics (Wadley, Reference Wadley2006). However, PRIMOS can rapidly assess the structural features within ribosomal RNAs in the presence and absence of antibiotics and readily detect ligand-induced conformational changes throughout the molecule, even at positions far from the ligand-binding site (Fig. 11) (Duarte et al. Reference Duarte, Wadley and Pyle2003). In one case, PRIMOS flagged nucleotides that act as a hinge between sections of 30S ribosomal RNA.
PRIMOS may have been successful because it is unbiased by the user input required for anchoring sites of superposition. Unlike superposition, subtle structural changes are not rendered statistically irrelevant by the vast majority of nucleotides that remain static. One might expect that this type of approach would be computationally expensive, but due to the linearized form of the data, it is not. A PRIMOS comparison of two ribosomal RNAs (each thousands of nucleotides in size) takes less than a minute.
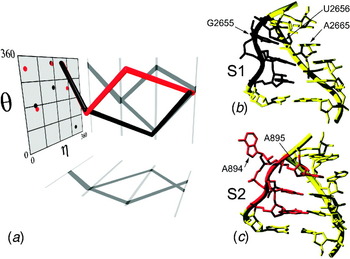
In another application, PRIMOS provides a useful way to determine if a structural element is totally novel and represents the first discovery of an RNA building block. New structural features within the catalytic cores of group I and group II introns were identified in this way (Adams et al. Reference Adams, Stahley, Kosek, Wang and Strobel2004; Keating et al. Reference Keating, Toor and Pyle2008, Reference Keating, Toor, Perlman and Pyle2010; Sigel et al. Reference Sigel, Sashital, Abramovitz, Palmer, Butcher and Pyle2004; Strobel et al. Reference Strobel, Adams, Stahley and Wang2004). PRIMOS has also been useful in classifying and differentiating motifs, as demonstrated by the discovery that there are two types of S-turns (Fig. 12): one class is superimposable and relatively common, while another class has an altered backbone architecture that distinguishes it from other examples (the S2 motif) (Duarte et al. Reference Duarte, Wadley and Pyle2003).
Pseudo-torsion analysis using PRIMOS revealed that there are two types of S-turn motifs, referred to as the S1 (classical S-turn) motif and the S2 motif. (a) Characteristic RNA worms for analogous portions of S1 (black) and S2 (red) motifs. (b) S1-motif structure with backbone ribbon (PDB code: 480D; Chang & Tinoco, Reference Chang and Tinoco1997). Nucleotides for the S1 worm (U2653–U2656) are in black. (c) S2-motif structure (PDB code: 1JJ2; Klein et al. Reference Klein, Schmeing, Moore and Steitz2001). Nucleotides for the S2 worm (G892–A895) are in red. Figure reprinted from Duarte et al. (Reference Duarte, Wadley and Pyle2003) with permission.

3.2 COMPADRES: an automated approach to motif discovery
While PRIMOS can be used to discover new motifs and substructures, its implementation requires an a priori search probe, in the form of an RNA worm. We wondered whether the η/θ formalism could be used to develop a completely automated approach for motif discovery that is unbiased by prior knowledge. It seemed plausible that the entire database of high-quality solved RNA structures could be sifted with worms representing known substructures, allowing novel units of architecture to be separated and characterized.
In order to develop this methodology, we took advantage of the fact that a worm of any size can be rapidly searched for content. Using a computational approach called COMPADRES (Comparative Algorithm to Discover Recurring Elements of Structure), we generated a set of massive worms by cutting up small, overlapping units of RNA structure and stringing them together in a linear series (Wadley & Pyle, Reference Wadley and Pyle2004). We then created a comprehensive motif library using PRIMOS (Duarte et al. Reference Duarte, Wadley and Pyle2003). Members of this motif library were then used to scan the worms for matches, thereby establishing the known and unknown sectors of worm architecture. Novel sectors were flagged using this approach, and they all represented previously undiscovered elements of RNA tertiary structure (Wadley & Pyle, Reference Wadley and Pyle2004). These elements represent the first RNA building blocks ever to be identified without human input or by heuristic classification; rather, they were found using a completely automated, mathematical approach for structural discovery.
Although these results were inherently exciting, it was nonetheless essential to determine whether any of these new substructures qualified as a bona-fide motif. The generally accepted definition of a motif is a recurrent element of RNA structure, which must be observed more than once in the database of solved structures. In order to determine whether any new elements represented actual motifs, each novel sector was used as the search probe for a PRIMOS analysis (Wadley & Pyle, Reference Wadley and Pyle2004). This allowed us to parse each of the novel sectors into one of two categories: totally unique substructures and recurrent motifs. The completely unique elements were simply classified and reported (Wadley, Reference Wadley2006), as they may be useful for structure prediction and modeling in the future. However, many of the novel substructures were common and recurrent, and thereby qualified as bona-fide motifs despite the fact that humans had never identified them by visual inspection (Wadley & Pyle, Reference Wadley and Pyle2004). This is particularly remarkable given the striking structural complexity of the novel motifs, and the fact that all of them are found at sites that are critical for the function of their parent macromolecules. The success of the approach underscored the serious limitations imposed by human perception during structural analysis (Wadley, Reference Wadley2006), and the need to employ computational approaches for evaluating macromolecular features.
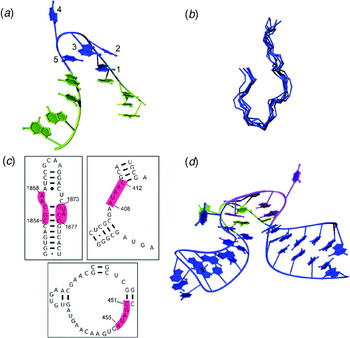
The motifs discovered by COMPADRES are generally new types of turns, although one appears to be a metal-binding motif (Wadley & Pyle, Reference Wadley and Pyle2004). Perhaps the most structurally interesting motif identified in the study is the π-turn (Fig. 13), which induces an unusually tight kink in the RNA that forms a binding site for proteins (Wadley & Pyle, Reference Wadley and Pyle2004). This motif has been observed in a duplicated form, resulting in a vase-like substructure that is decorated with extra-helical bases extending away from the backbone scaffold (Fig. 13d). Like the individual π-motifs, the duplicated form appears ideally suited for molecular recognition of amino acid side chains and other ligands.
The COMPADRES technique was used to identify a number of novel motifs, including the π-turn shown here. (a) An example of an isolated π-turn (PDB file, 1JJ2 0:A408-C12; Klein et al. Reference Klein, Schmeing, Moore and Steitz2001) from the 50S ribosomal subunit of Haloarcula marismortui (H50S). The five structurally similar nucleotides (blue) are flanked by two helical strands (yellow). Numbering is from 5′ to 3′. (b) A superposition of the backbones of the seven π-turns found in our dataset. (c) Locations of the four H50S π-turns (highlighted in red) in secondary structure. (d) Two of the π-turns found in the H50S occurred symmetrically opposite each other, shown here in their helical context. Nucleotides not part of the canonical π-turns are shown in blue. Figure reprinted from Wadley & Pyle (Reference Wadley and Pyle2004) with permission.

Having discovered a library of new RNA motifs, it was of interest to evaluate the contexts in which they were found. It was expected that RNA substructures with similar form would be embedded in similar superstructures. However, a striking finding of this study was that a given motif can be identified within vastly different primary sequence and secondary structural contexts. The π-turn is a particularly striking example, as this element can form within single-stranded, double-stranded or junction RNA composed of diverse sequences (Fig. 13c). A similar conclusion was reached by Krasilnikov et al. who showed that similar architectural elements within RNase P RNA are derived from secondary structural regions that appear completely different without knowledge of tertiary structure (Krasilnikov et al. Reference Krasilnikov, Xiao, Pan and Mondragon2004). Taken together, these findings underscore the challenges that are inherent in RNA tertiary structural prediction: sequence and secondary structure alone do not yet provide sufficient information for predicting tertiary architectural forms. While progress is being made (vide infra), additional RNA tertiary structures are needed to fully dissect the components of individual RNA motifs and their interaction partners.
One might expect, particularly given their diverse secondary structural contexts, that motifs identified through COMPADRES do not contain members with identical base plane orientation. After all, η and θ do not contain explicit information about base location. Nonetheless, members of each motif family superimpose with an RMSD of ~1 Å, even when nucleobases are included in superimposition (Fig. 13b) (Wadley & Pyle, Reference Wadley and Pyle2004). Visual inspection confirms that the bases (regardless of sequence) have almost identical locations within a motif family. This is consistent with previous observations that nucleotides with similar η and θ values share similar base plane location, underscoring the role of the RNA backbone in directing nucleobase location.
Methods such as COMPADRES provide a mechanism for learning as much as possible about RNA structural diversity, and for comprehensively mining the structural database for information about RNA architectural building blocks. But scientifically, the implications of the work are more significant than motif discovery: In the COMPADRES study, a computer method discovered a wealth of information about RNA without any human guidance or human perceptual intervention. This means that one can design tools that are capable of discovering new knowledge on their own, without carrying along the biases of the investigator, and that these tools can facilitate innovation in structural biology. In computer science, this is referred to unsupervised learning. While the application of this technique to biological data is certainly not unique to our research (Golub et al. Reference Golub, Slonim, Tamayo, Huard, Gaasenbeek, Mesirov, Coller, Loh, Downing, Caligiuri, Bloomfield and Lander1999; Quackenbush, Reference Quackenbush2001), its application to RNA structural data demonstrates its great potential.
3.3 Other tools for structural analysis using the η/θ formalism
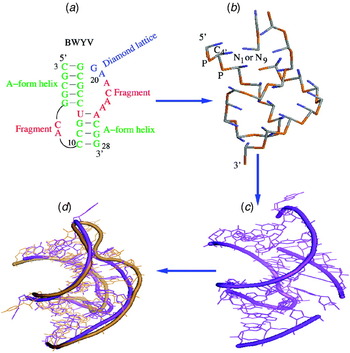
In addition to the tools and techniques developed in our lab, η and θ have been key components of algorithms developed elsewhere. For example, the pseudo-torsions are used extensively in the VFold model (Fig. 14), which has been used to study RNA folding and stability (Cao & Chen, Reference Cao and Chen2005, Reference Cao and Chen2006; Cao et al. Reference Cao, Giedroc and Chen2010; Tan & Chen, Reference Tan and Chen2008). This model represents a RNA molecule using a highly simplified system: all helices are modeled using idealized η and θ values, and loops are represented as P-C4′ and C4′-P bonds on a diamond lattice, where each phosphate and C4′ atom must fall exactly on a lattice point (Fig. 14a,b). The model can be used to accurately estimate entropy, which can then be used to predict RNA secondary structure and melting temperatures (Cao & Chen, Reference Cao and Chen2005). Additionally, the Vfold model has been used to study the folding of loops (Cao & Chen, Reference Cao and Chen2005) and pseudo-knots (Cao & Chen, Reference Cao and Chen2006; Cao et al. Reference Cao, Giedroc and Chen2010) (Fig. 14c,d), as well as the effect of salt on hairpin stability (Tan & Chen, Reference Tan and Chen2008).
The VFold model, which is based on the η and θ pseudo-torsions, can be used to predict RNA tertiary structure and folding (Cao et al. Reference Cao, Giedroc and Chen2010). Here, it is used to predict the three-dimensional structure of a pseudo-knot. (a) The predicted pseudo-knot secondary structure. (b) The predicted virtual-bond level tertiary structure. (c) The all-atom structure constructed from the scaffold shown in (b). (d) The all-atom structure after additional refinement. Figure reprinted from Cao et al. (Reference Cao, Giedroc and Chen2010) with permission.

The pseudo-torsions also form the basis of the iPARTS server, which uses η and θ to align RNA tertiary structures (Wang et al. Reference Wang, Chen and Lu2010). Traditionally, structures are aligned using RMSD; that is, by minimizing the distance between corresponding atoms in the two structures. However, this requires pre-determining which atoms are considered ‘corresponding’, which is not always straightforward with dissimilar structures. The iPARTS algorithm uses η and θ to identify corresponding regions of two structures (Wang et al. Reference Wang, Chen and Lu2010). In order to accomplish this, the η/θ plot was divided into 23 different clusters, and a unique letter was assigned to each cluster. A structure can then be represented as a string of letters by assigning each nucleotide to a cluster based on its η−θ coordinates. In this way, the pseudo-torsions are used to reduce a three-dimensional structure to a one-dimensional sequence of letters. Two such sequences can then be aligned using a variety of one-dimensional alignment techniques, which can easily find matching regions that may have been missed when examining the full three-dimensional structure. These alignments can then be used to assess structural and functional similarity.
3.4 RCrane: automated building of RNA structural models for crystallography
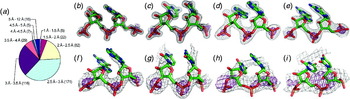
The above applications use η and θ to analyze existing structures by identifying structural motifs, predicting thermodynamic properties or performing structural alignments. However, the pseudo-torsions can also be used as a tool in crystallographic model building by helping to build RNA structure into electron density maps, which are the result of an X-ray crystallography experiment. One of the current challenges of RNA structural studies is the low resolution typical of RNA crystallography (Fig. 15), which leads to difficulty and errors in modeling the RNA backbone. This problem is exacerbated by the flexibility of the RNA backbone and the lack of computational tools for RNA modeling. In order to meet this challenge, we developed a technique for building the RNA backbone into low-resolution electron density maps using the RNA pseudo-torsions (Fig. 16b) (Keating & Pyle, Reference Keating and Pyle2010).
Typical RNA electron density maps for structures solved at various resolutions. Structures shown in (b–i) were retrieved from the Nucleic Acid Database (Berman et al. Reference Berman, Olson, Beveridge, Westbrook, Gelbin, Demeny, Hseih, Srinivasan and Schneider1992), and electron density maps were calculated using observed structure factors and calculated phases. (a) Pie chart showing the resolutions of all large RNA structures (structures that contain a chain of at least 25 nucleotides), as retrieved from the Nucleic Acid Database (Berman et al. Reference Berman, Olson, Beveridge, Westbrook, Gelbin, Demeny, Hseih, Srinivasan and Schneider1992). Numbers in parentheses are the number of structures in the specified resolution range. Note that structures in the 2.5–3.5-Å resolution range account for nearly two-thirds of all large RNA structures, whereas protein structures are typically solved at far higher resolutions. Maps are shown at (b) 1.04, (c) 1.75, (d) 2.25, (e) 2.75, (f) 3.3, (g) 3.8, (h) 4.5 and (i) 6.21 Å resolutions. Figure reprinted from Keating & Pyle (Reference Keating and Pyle2010) with permission.

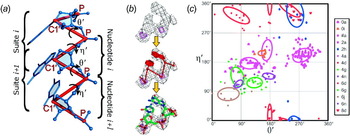
RCrane uses the pseudo-torsions for crystallographic model building. (a) The η′ and θ′ pseudo-torsions, which use the C1′ atom in place of C4′. Additionally, the suite and nucleotide divisions of the backbone are indicated. (b) The model building process. Starting with the experimental electron density (top), a crystallographer builds phosphates and bases (middle). The detailed backbone structure can then be automatically predicted and constructed (bottom). (c) A θ′−η′ plot showing suites of the RNA05 filtered dataset (Richardson et al. Reference Richardson, Schneider, Murray, Kapral, Immormino, Headd, Richardson, Ham, Hershkovits, Williams, Keating, Pyle, Micallef, Westbrook and Berman2008). Each color and shape combination corresponds to a specific conformer as indicated in the key. Ellipses correspond to the Gaussian functions (at the 1σ level) used in conformer predictions. Only conformers with leading C2′ endo sugar pucker and ending C3′ endo sugar pucker are shown. Figure reprinted from Keating & Pyle (Reference Keating and Pyle2010) with permission.

This technique uses slightly modified versions of the pseudo-torsions (Fig. 16a). While η and θ are defined using the phosphate and C4′ atoms, this study employed an alternative set of pseudo-torsions, η′ and θ′, which use the phosphate and C1′ atoms (η′ is the torsion about C1′i−1−Pi−C1′i−Pi+1 and θ′ is the torsion about Pi−C1′i−Pi+1−C1′i+1) (Fig. 16a). The η′ and θ′ torsions are more suitable when interpreting crystallographic density because the C1′ atom is covalently bound to the nucleoside base and therefore can be more easily and accurately located within a low-resolution map (Gruene & Sheldrick, Reference Gruene and Sheldrick2011; Keating & Pyle, Reference Keating and Pyle2010).
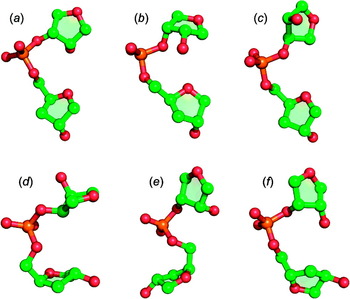
The building technique combines these modified pseudo-torsions with the consensus backbone conformer library (Richardson et al. Reference Richardson, Schneider, Murray, Kapral, Immormino, Headd, Richardson, Ham, Hershkovits, Williams, Keating, Pyle, Micallef, Westbrook and Berman2008), which enumerates a limited number of allowed all-atom configurations for the RNA backbone (Fig. 17). This library therefore provides a set of discrete choices for fitting structure into electron density. It should be noted, however, that the conformers are defined using the suite division of the backbone rather than the traditional nucleotide division. While a nucleotide is centered about the ribose sugar and spans two phosphates, a suite is instead centered about the phosphate and spans two sugars (Figs. 1a and 16a) (Murray et al. Reference Murray, Arendall, Richardson and Richardson2003). Thus, a suite is equivalent to the first half of one nucleotide combined with the latter half of the previous nucleotide. As a result of this, this study interpreted the pseudo-torsions in (θ′, η′) pairs that span a suite rather than (η′, θ′) pairs that span a nucleotide (Fig. 16a).
The consensus backbone conformers describe 46 allowable configurations for the RNA backbone (Richardson et al. Reference Richardson, Schneider, Murray, Kapral, Immormino, Headd, Richardson, Ham, Hershkovits, Williams, Keating, Pyle, Micallef, Westbrook and Berman2008). Here, sample backbone structures of six of these conformers are shown. Note that the consensus conformers use the suite division of the backbone rather than the nucleotide division (See Figs. 1a and 16a).

As with previous studies of the C4′-based pseudo-torsions, we examined η′ and θ′ in the context of sugar pucker. As pucker is exceedingly difficult to determine directly from low-resolution electron density, the building technique determines pucker using the base–phosphate perpendicular distance (Davis et al. Reference Davis, Leaver-Fay, Chen, Block, Kapral, Wang, Murray, Arendall, Snoeyink, Richardson and Richardson2007; Murray, Reference Murray2007), which requires only the phosphate and glycosidic bond coordinates to accurately assess pucker. When a θ′/η′ plot is divided by pucker, the consensus backbone conformers show remarkably tight clustering (Fig. 16c) (Keating & Pyle, Reference Keating and Pyle2010). As a result of this correlation, the C1′-based pseudo-torsions and the base–phosphate perpendicular distance can be used to predict backbone conformers, which can then be built into electron density.
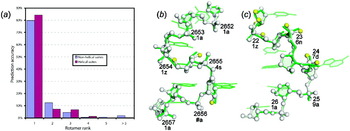
The accuracy of these predictions was tested using jackknife validation with the RNA05 dataset (Richardson et al. Reference Richardson, Schneider, Murray, Kapral, Immormino, Headd, Richardson, Ham, Hershkovits, Williams, Keating, Pyle, Micallef, Westbrook and Berman2008). This showed that the first (i.e. most likely) predicted conformer was correct 80% of the time for non-helical suites and 84% of the time for helical suites, and that one of the first three conformers was correct 97% of the time for non-helical suites and 98% of the time for helical suites (Keating & Pyle, Reference Keating and Pyle2010) (Fig. 18a). As a further test of this technique, two high-resolution crystal structures were rebuilt using only the published phosphate and base coordinates. The sarcin/ricin domain (PDB code: 1Q9A (Correll et al. Reference Correll, Beneken, Plantinga, Lubbers and Chan2003)) and guanine riboswitch (PDB code: 2EES (Gilbert et al. Reference Gilbert, Love, Edwards and Batey2007)) were both accurately rebuilt (Fig. 18b,c). Between the two structures, 76 of the 88 suites with assigned conformers were correctly predicted and built using only the first conformer prediction, and in the majority of the remaining 12 suites, the mis-prediction caused only imperceptible changes in the rebuilt structure (Keating & Pyle, Reference Keating and Pyle2010). Additionally, for two suites of the guanine riboswitch, the rebuilt structure showed a noticeably better match to the electron density than did the original coordinates (Keating & Pyle, Reference Keating and Pyle2010). Thus, this technique can produce an accurate all-atom representation of the molecule even when starting from an imprecise low-resolution density map.
The RCrane method results in highly accurate backbone structure. (a) Jackknife validation shows that conformer predictions are highly accurate. Prediction accuracy for conformers ranked as most likely, second most likely, etc., by the conformer prediction process. Standard error is <0.3% for all bars. (b, c) The sarcin/ricin domain (PDB code: 1Q9A; Correll et al. Reference Correll, Beneken, Plantinga, Lubbers and Chan2003) and guanine riboswitch (PDB code: 2EES; Gilbert et al. Reference Gilbert, Love, Edwards and Batey2007) crystal structures were rebuilt using RCrane. The rebuilding used only the published phosphate and base coordinates, and was able to accurately and automatically reconstruct the backbone. Shown here are (b) the S-motif from the sarcin/ricin domain and (c) the J1/2 linker from the guanine riboswitch. The original structures are shown as green sticks and the rebuilt structures are shown in ball-and-stick representation. Atoms built within 0.5 Å of the published coordinates are shown as white spheres, and atoms built within 0.8 Å are shown in yellow. Suite numbers and conformers are labeled. Note that the rebuilt structure has not been minimized or refined against the electron density. Figure reprinted from Keating & Pyle (Reference Keating and Pyle2010) with permission.

Independent of our research, Gruene & Sheldrick (Reference Gruene and Sheldrick2011) also used the C1′-based pseudo-torsions to develop a promising approach toward automated building of RNA into electron density. They demonstrated a technique for automatically locating phosphates and bases within density maps, and they showed that η′ and θ′ could be used to assign order and connectivity to these bases and phosphates. The technique identifies phosphates by their strong, tetrahedral-shaped electron density, and finds bases by searching for large, planar ‘blobs’ of density (Gruene & Sheldrick, Reference Gruene and Sheldrick2011). Thus, the combination of this method with our crystallographic model building technique (Keating & Pyle, Reference Keating and Pyle2010) holds great promise for fully automated building of RNA structure into electron density.
In addition to the current applications of these methodologies to X-ray crystallography, there is great potential for using η′ and θ′ to interpret cryo-electron microscopy results, which also produce electron density maps, albeit at lower resolution. Additionally, it would be interesting to investigate the applications of the pseudo-torsions toward the modeling of RNA in NMR. While NMR experiments do not produce electron density maps, the reduced dimensionality of the pseudo-torsions could prove useful in modeling RNA to match experimental spectra.
3.5 RNA structure prediction: building RNA in-silico using pseudo-torsions
A second application of the η and θ formalism in RNA structural modeling is the prediction and building of RNA structures de novo. The modeling of RNA in three dimensions is a challenging problem, complicated by its highly charged backbone and inherent backbone flexibility. Approaches to RNA modeling can typically be classified as all-atom (Das & Baker, Reference Das and Baker2007; Parisien & Major, Reference Parisien and Major2008) or coarse grained (Ding et al. Reference Ding, Sharma, Chalasani, Demidov, Broude and Dokholyan2008; Flores et al. Reference Flores, Wan, Russell and Altman2010; Jonikas et al. Reference Jonikas, Radmer, Laederach, Das, Pearlman, Herschlag and Altman2009b), depending on whether models of RNA are built in full atomic detail or whether each nucleotide is modeled in a simplified representation using pseudo-atoms (see Shapiro et al. (Reference Shapiro, Yingling, Kasprzak and Bindewald2007) for a review). All-atom approaches have been successful in the modeling of small RNAs, but tend to scale poorly with structure size, making modeling of structures larger than tRNA difficult. In contrast, coarse-grained approaches can model significantly larger RNA structures, but result in much lower-resolution detail than seen with all-atom modeling. While advances have been made in bridging the two scales of RNA modeling (Jonikas et al. Reference Jonikas, Radmer and Altman2009a), approaches that combine the detail and accuracy of all-atom modeling of RNA with the speed and freedom from size constraints afforded by coarse-grained modeling are still needed.
The η/θ formalism may be especially well suited for combining the benefits of a reduced representation of RNA and all-atom detail. The η/θ notation is simplistic, involving only two atoms per nucleotide (C4′ and P), but nevertheless can identify RNA structural features and motifs in 3D, a task that had previously required direct structural superimposition. The fact that the simplified pseudo-torsions can identify and classify 3D structure highlights an important finding on a nucleotide by nucleotide level: the closer any two arbitrary RNA nucleotides are in pseudo-torsional space, the closer their structural similarity, as measured by RMSD (vide supra) (Wadley et al. Reference Wadley, Keating, Duarte and Pyle2007). This is true not only for the highly populated regions of the η/θ plot (Wadley et al. Reference Wadley, Keating, Duarte and Pyle2007) but also in the less dense regions of the plot containing highly unusual, non-A form conformations. Surprisingly, this structural similarity often extends to base positioning as well, such that nucleotides close in pseudo-torsional space are also found to have virtually identical base orientations. Taken together, this suggests that nucleotides with similar η and θ values may be, to some degree, structurally interchangeable and that η−θ values might be useful as a shorthand proxy for specific conformational states of RNA.
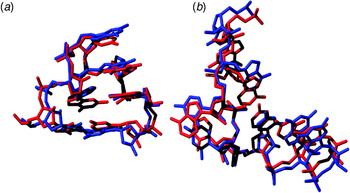
In order to test these ideas, we asked whether realistic strands of RNA could be built in silico using only the pseudo-torsional formalism. A random selection of 500 strands, each 10-nucleotides in length, were chosen from solved crystallographic structures and η/θ values were calculated for each nucleotide in the strand. The 500 RNA strands were then created in-silico by computationally joining nucleotides with similar η/θ values from other solved structures (Fig. 19) (Wadley et al. Reference Wadley, Keating, Duarte and Pyle2007). Impressively, using pseudo-torsional information alone, the average pair-wise RMSD between the 500 models and starting 10-nucleotide strands was 1.7±1.0 Å. In contrast, the RMSD observed when nucleotides with random η/θ values were selected and joined in-silico was 5.5±2.5 Å. High model-building accuracy was observed even when the η/θ formalism was used to build specific RNA structural motifs such as a GNRA tetraloop (Fig. 19a) and a RNA bulge region (Fig. 19b) (Wadley et al. Reference Wadley, Keating, Duarte and Pyle2007). Importantly, these modeled motifs were built entirely from nucleotides that had not been found in naturally occurring contiguous instances of the specific motif being built.
RNA strands can be accurately rebuilt by computationally joining nucleotides with similar η/θ values from other structures. (a) An example of an in silico tetraloop superimposed on the original (1S72 0:8994; Klein et al. Reference Klein, Moore and Steitz2004). The backbone RMSD of the in silico strand (red) to the original tetraloop (blue) is 0.78 Å, despite the fact the nucleotides used to build the strand do not belong to any naturally occurring tetraloop. (b) A bulge region (1S72 0:1391–1398; Klein et al. Reference Klein, Moore and Steitz2004) from the 50 S ribosomal subunit. The in silico strand (blue) superimposed on the original (red) with a backbone RMSD of 0.91 Å. Figure reprinted from Wadley et al. (Reference Wadley, Keating, Duarte and Pyle2007) with permission.

These initial attempts at building RNA strands in silico allowed substitution of any nucleotide within a structural dataset for any other, based solely on their respective distance in pseudo-torsional space. However, these results could be extended more generally in the future by creating a library of discrete RNA conformations by systematically varying η and θ values (stepping by 10 or 20 degrees at a time, for example) and selecting a single conformational representative from all structurally solved instances. Such a process should generate a set of discrete RNA conformations spanning the full diversity of nucleotide conformational accessibility for use in RNA structural modeling.
4. What we learn about RNA by looking through the η/θ lens
In addition to the direct applications of the RNA pseudo-torsions, such as motif finding and structure building, the studies of η and θ have revealed a great deal about RNA structure itself.
4.1 RNA conformation is not dictated by sterics alone
Our initial observation that models containing vastly different standard torsions could be grouped into similar structural categories suggests that bigger forces are at work in constraining RNA structure than simple sterics and geometry. We also observed that the distribution of nucleotides on an η/θ plot could not be explained purely by steric constraints. For example, Wadley calculated nucleotide structures using only steric constraints and plotted these nucleotides in η/θ space (Wadley, Reference Wadley2006). The distribution of nucleotides on this η/θ plot was different from the distribution of nucleotides taken from published crystal structures. A number of η/θ regions that were allowed sterically were almost entirely unpopulated by real nucleotides, indicating that RNA structural forms are dictated by many additional factors beyond sterics. A similar phenomenon is observed when sterically allowed and disallowed regions are calculated using the standard torsions: clusters of observed nucleotides do not always overlap directly with the regions predicted to be sterically optimal (Murthy et al. Reference Murthy, Srinivasan, Draper and Rose1999).
This is completely different from what is seen in protein structure. For a Ramachandran plot (Ramachandran et al. Reference Ramachandran, Ramakrishnan and Sasisekharan1963), (φ, ψ) coordinates can be divided into allowed and disallowed regions on the basis of steric constraints alone (Ramakrishnan & Ramachandran, Reference Ramakrishnan and Ramachandran1965). Disallowed regions represent backbone structure that would certainly contain steric clashes for non-glycine and non-proline amino acids. For nucleotide structures, however, structural constraints must include other aspects of the folded RNA environment, such as base-stacking and base-pairing, electrostatic terms, hydration and other energetic constraints that even now have not been adequately captured computationally (Wadley et al. Reference Wadley, Keating, Duarte and Pyle2007).
4.2 There are limited number of basic conformational units in RNA structure
The large number of backbone torsions (Fig. 1a) would seem to indicate that the RNA backbone is infinitely flexible; however, this is clearly not the case. In η/θ space, there are only 11 highly populated clusters within the existing database (Fig. 8c) (Wadley et al. Reference Wadley, Keating, Duarte and Pyle2007). Additionally, the consensus backbone conformer library (Fig. 17) contains only 46 allowed backbone suite configurations (Richardson et al. Reference Richardson, Schneider, Murray, Kapral, Immormino, Headd, Richardson, Ham, Hershkovits, Williams, Keating, Pyle, Micallef, Westbrook and Berman2008). Thus, at two very different levels of detail, RNA backbone structure is sharply constrained. While the RNA backbone allows more freedom than the protein main chain, RNA tertiary structure must still exist within the constraints imposed by the backbone.
4.3 The link between backbone and base
The pseudo-torsions clearly reveal a strong link between backbone conformation and base location. For example, η and θ are highly accurate predictors of RMSD (i.e. structural similarity) even when base atoms are considered (Wadley et al. Reference Wadley, Keating, Duarte and Pyle2007) (Fig. 7b). This relationship between backbone and base is not readily apparent when the standard torsions are examined (Fig. 7d). Furthermore, most of the clusters in η/θ space still show strong structural similarity even when base atoms are considered. Thus, even though these clusters were defined entirely on the basis of backbone conformation, the clustering still reveals information about base location (Wadley et al. Reference Wadley, Keating, Duarte and Pyle2007).
This link is further confirmed by the ability to rebuild realistic structures, with accurate nucleobase positioning, using only the pseudo-torsions (vide supra) (Wadley et al. Reference Wadley, Keating, Duarte and Pyle2007). In addition, a biopolymer chain elasticity (BCE) model has also shown accurate backbone structures of simple RNA hairpins can be reproduced without consideration of base-base interactions (Pakleza & Cognet, Reference Pakleza and Cognet2003; Santini et al. Reference Santini, Pakleza and Cognet2003). The BCE model assumes that the nucleic acid backbone behaves as a flexible thin rod and demonstrates that the structural constraints imposed by the end of the stem are sufficient for determining loop structure. This ability to accurately build RNA structure using only backbone information, whether it be pseudo-torsions or end conditions shows that RNA conformation is not driven solely by interactions between bases.
4.4 The importance of quality filters when studying the RNA backbone
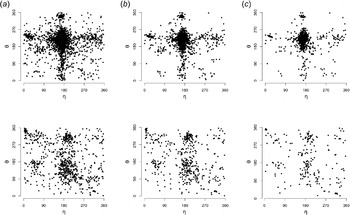
In any scientific study, assuring the quality of the data is an obvious concern, but this task is especially important and especially difficult when examining the RNA backbone. Most large RNA structures are solved using X-ray crystallography. However, due to the low resolutions typical of RNA crystallography and the lack of computational tools, backbone modeling errors are unavoidable. Similarly, NMR studies of RNA frequently provide incomplete information about the specifics of backbone structure (Furtig et al. Reference Furtig, Richter, Wohnert and Schwalbe2003). As a result, stringent quality filtering is commonly applied to studies of all-atom backbone structure (Murray et al. Reference Murray, Arendall, Richardson and Richardson2003; Richardson et al. Reference Richardson, Schneider, Murray, Kapral, Immormino, Headd, Richardson, Ham, Hershkovits, Williams, Keating, Pyle, Micallef, Westbrook and Berman2008). However, these filters are still important when considering η and θ, even though the pseudo-torsions examine the backbone at a lower level of detail. As shown in Fig. 20, the differences in η/θ plots constructed with different filtering stringencies are readily apparent, with the stronger filtering resulting in a plot with sharper distinctions between favorable and unfavorable regions.
Data filtering is important for η−θ plots. All plots shown here were constructed using the RNA05 dataset (Richardson et al. Reference Richardson, Schneider, Murray, Kapral, Immormino, Headd, Richardson, Ham, Hershkovits, Williams, Keating, Pyle, Micallef, Westbrook and Berman2008) with differing filtering criteria. (a) Plots with no filtering applied. 7,372 C3′-endo (top) and 791 C2′-endo (bottom) nucleotides are shown. (b) Plots where nucleotides containing atoms with B factors >60 have been excluded. 3733 C3′-endo (top) and 458 C2′-endo (bottom) nucleotides remain. (c) Plots with additional quality filters applied to remove nucleotides containing a steric clash (van der Waals overlap >0.4 Å, as measured by MolProbity clashscore; Word et al. Reference Word, Lovell, Labean, Taylor, Zalis, Presley, Richardson and Richardson1999). 1548 nucleotides C3′-endo (top) and 218 C2′-endo (bottom) nucleotides remain and are shown in the plot. Note that for all plots in a–c, only nucleotides with a well-defined sugar pucker are shown (C3′-endo: δ=84±30, pseudo-phase angle of furanose ring (Saenger, Reference Saenger1984) between 0°–36°±18°, base–phosphate perpendicular distance >2.9 Å; C2′-endo: δ=147±30, pseudo-phase angle of furanose ring between 144°–180°±18°, base–phosphate perpendicular distance <2.9 Å). Additionally, for nucleotides with alternative conformations, only the first instance listed in the pdb file was used.

This filtering is not without caveats, though. Even with the enormous increase in RNA structural data over the past decade, the quantity of data is still far more limited than what is available for protein structure. The application of these quality filters further decreases the amount of data. For example, confining datasets to structures approaching atomic resolutions is a laudable goal. Indeed, a popular protein side-chain rotamer library (Lovell et al. Reference Lovell, Word, Richardson and Richardson2000, Reference Lovell, Davis, Arendall, De Bakker, Word, Prisant, Richardson and Richardson2003) was constructed using structures of 1.7 Å resolution or better. However, applying a similar criterion to RNA structure would result in an unusably small dataset. Thus, a careful balance must be struck between data quantity and quality.
4.5 The importance of multiple descriptors of the RNA backbone
The pseudo-torsions and the consensus backbone conformers (Richardson et al. Reference Richardson, Schneider, Murray, Kapral, Immormino, Headd, Richardson, Ham, Hershkovits, Williams, Keating, Pyle, Micallef, Westbrook and Berman2008) describe RNA structure at two very different levels of detail. The pseudo-torsions offer information about the general path of the backbone, while the backbone conformers describe structure at an all-atom level of detail. However, these two systems provide a complementary pair of descriptors. The existence of the backbone conformer library does not reduce the utility of the pseudo-torsions, as the lower level of detail provided by the pseudo-torsions proves useful in a number of situations such as motif searching or interpreting low-resolution maps. In these cases, additional details frequently obscure the useful information. Additionally, the pseudo-bonds used to calculate η and θ span the backbone between three neighboring bases. Therefore, the pseudo-torsions describe the local ‘context’ of a nucleotide and include information about backbone orientation on the 5′ and 3′ sides (Wadley et al. Reference Wadley, Keating, Duarte and Pyle2007). In particular, this contextual information helped in the development of the consensus conformer library, as θ/η were used to confirm differences between similar conformers (Keating & Pyle, Reference Keating and Pyle2010; Richardson et al. Reference Richardson, Schneider, Murray, Kapral, Immormino, Headd, Richardson, Ham, Hershkovits, Williams, Keating, Pyle, Micallef, Westbrook and Berman2008).
Conversely, the simplicity of the pseudo-torsions does not reduce the utility of the consensus backbone conformers. The all-atom detail contained within conformers is necessary when examining individual hydrogen bonds and other interactions. This type of information is frequently necessary to understand the structural details of a specific motif. Perhaps more critically, this level of detail is necessary for understanding the chemistry carried out by ribozymes. Because of this all-atom detail, accurate backbone conformers are the ultimate goal of any de novo modeling or crystallographic building technique.
4.6 The complementarity of backbone and base descriptors
While descriptors of the backbone are crucial to the study of RNA, the details of base-pairing and -stacking are also critical for RNA folding, structure and function. Thus, descriptors of nucleobase structure are an obvious complement to the η/θ and consensus conformer systems. For example, the Leontis–Westhof nomenclature for base-pairing is invaluable when examining RNA secondary and tertiary structure (Leontis & Westhof, Reference Leontis and Westhof2001; Lescoute & Westhof, Reference Lescoute and Westhof2006). By combining descriptions of both the backbone and the base, it is possible to give a thorough characterization of the structure of a region of RNA. Such characterizations can provide a complete picture of RNA molecules and motifs.
5. Analogous approaches in the protein world
The pseudo-torsions η and θ allow the RNA backbone to be described in a way that is highly analogous to the backbone torsions φ and ψ in proteins. Thus, it is not surprising that the development of η/θ tools to analyze, classify and build RNA structure have parallels from four decades of research in the protein world. Uses of the η/θ formalism have included structure quality evaluation (AMIGOS) (Duarte & Pyle, Reference Duarte and Pyle1998; Wadley et al. Reference Wadley, Keating, Duarte and Pyle2007), motif identification (PRIMOS) (Duarte et al. Reference Duarte, Wadley and Pyle2003), motif discovery (COMPADRES) (Wadley & Pyle, Reference Wadley and Pyle2004) and structural modeling building (RCrane) (Keating and Pyle Reference Keating, Toor, Perlman and Pyle2010). Analogous applications based on φ and ψ have been developed for each of these tasks for proteins as well.
The program PROCHECK (Laskowski et al. Reference Laskowski, Macarthur, Moss and Thornton1993) can be used to flag amino acids within newly determined protein structures with abnormal φ and ψ torsions that might have been incorrectly refined. Protein backbone φ and ψ torsional ranges can be used to identify amino acids likely to be found in differing conformational states, such as alpha-helices and beta sheets (Ramachandran et al. Reference Ramachandran, Ramakrishnan and Sasisekharan1963). Based on these torsional ranges, several programs were subsequently developed to identify and classify loops (Oliva et al. Reference Oliva, Bates, Querol, Aviles and Sternberg1997; Venkatachalam, Reference Venkatachalam1968; Wintjens et al. Reference Wintjens, Rooman and Wodak1996) as well as larger motifs in proteins (Hutchinson & Thornton, Reference Hutchinson and Thornton1996; Kato & Takahashi, Reference Kato and Takahashi1997). Armed with the knowledge that the protein backbone torsions φ and ψ could be directly related to the basic building blocks of protein structure, the protein field also began searching for and classifying new and existing protein substructures, protein domains and protein families. Several tools were developed to aid in searching protein databases and discovering new substructures and the relationships between them (Holm & Sander, Reference Holm and Sander1994; Orengo et al. Reference Orengo, Jones and Thornton1994). Finally, the protein torsions φ and ψ have been useful in developing libraries of discrete, backbone-dependent rotameric conformations of individual amino acids (Dunbrack & Karplus, Reference Dunbrack and Karplus1993; Lovell et al. Reference Lovell, Word, Richardson and Richardson2000, Reference Lovell, Davis, Arendall, De Bakker, Word, Prisant, Richardson and Richardson2003; Ponder & Richards, Reference Ponder and Richards1987), the use of which has led to great successes in the protein modeling world (Dahiyat & Mayo, Reference Dahiyat and Mayo1997; Kortemme et al. Reference Kortemme, Ramirez-Alvarado and Serrano1998; Kuhlman et al. Reference Kuhlman, Dantas, Ireton, Varani, Stoddard and Baker2003). While comparable successes have yet to be achieved in the modeling of RNA, the development of crystallographic and de novo modeling applications using the η/θ formalism is currently an active area of research, both in our lab and others.
Despite the many similarities in the application and development of tools using the η/θ pseudo-torsions for RNA and φ and ψ torsions for proteins, it is worth pointing out an important difference between the η−θ plot for RNA and the comparable φ−ψ Ramachandran plot for proteins. Ramachandran plots were initially determined, in part, by modeling the conformations theoretically allowed by the steric constraints of polyalanine and shown to correlate with energetically allowed states of the protein backbone (Ramachandran et al. Reference Ramachandran, Ramakrishnan and Sasisekharan1963). Such a clear link between sterically allowed regions of the η−θ plot and empirically observed RNA conformations has not been established (vide supra) (Wadley, Reference Wadley2006) and, to date, the relationship between force-field conformational energies and the η−θ torsions has not been determined.
6. Tool availability
Starting with our initial publication on pseudo-torsional space in 1998, all our computational tools have been freely available for other investigators to use. The simplicity of our initial AMIGOS scripts, written at the time in perl4, helped the η/θ formalism catch on and be adapted into the complete set of computational tools available for analysis today.
Our current set of η/θ tools are all freely available at http://pylelab.org/software/. The AMIGOS II program is the most comprehensive tool for structure analysis. It includes all the capabilities of AMIGOS and PRIMOS and presents them with a graphical interface. RCrane is also available, which is a plugin for Coot that implements the techniques described in Section 3.4 and helps crystallographers in building new crystal structures.
Instructions for accessing the Vfold package are available online at http://vfold.missouri.edu/chen-software02.html and iPARTS is available online at http://bioalgorithm.life.nctu.edu.tw/iPARTS/.
7. Conclusions
By allowing us to perceive and evaluate RNA molecules in a different manner, the η/θ formalism has made it possible to capture RNA conformational features in new ways that are important for the study of RNA structure, RNA folding and the interaction of RNA with ligands. The biophysics and computational biology of RNA molecules is a young field that is rapidly exploding with biological significance. It is therefore important to tailor our intellectual frameworks and methods to meet the specific needs of the RNA research community and to reflect the unique characteristics of RNA molecules. While the η/θ formalism is one such attempt, we anticipate that there are many creative ways to understand macromolecular form and function. In reading about the development of the η/θ formalism, we hope that other researchers will be encouraged to develop entirely new approaches for thinking about RNA and protein structure.
8. Acknowledgements
We are grateful for the insights gained through discussion with Jane and David Richardson, and members of their laboratory, particularly Laura Murray and Gary Kapral. In addition, we want to thank Chuck Duarte and Leven Wadley, whose innovations and imagination provided the foundation for this work. We want to thank Eric Westhof, Neocles Leontis and Bohdan Schneider for helpful discussions and for their role in establishing the RNA Ontology Consortium (ROC), which served as an early forum for this type of research. A. M. P. would like to thank Helen Berman for her early encouragement to develop this project and Wilma Olson for helpful discussions. And perhaps most of all, we want to thank the many RNA researchers, hopefully all cited here, who began implementing the η/θ formalism to study RNA structure and to develop new algorithms based on the approach. Their feedback and commentary has been invaluable to our research program. This work was supported, in part, by an NIH training grant T15 LM07056 to K. S. K. and by NIH Grant GM50313 to A. M. P. Anna Marie Pyle is an Investigator of the Howard Hughes Medical Institute.