Implications
Traditional fertility traits are complex multi-factorial traits, thereby contributing to the low heritability of these traits. Identifying detailed reproductive phenotypes that are affected by fewer factors than the traditional traits could provide a better understanding of fertility, help to improve reproductive performance, and with the reduction in unexplained variance, may increase the heritability and thus genetic gain of these traits. From the present study, the factors associated with the detailed reproductive phenotypes that were identified can lead to a better understanding of reproductive performance in both dairy and beef cattle and provide knowledge that can be used in future research and breeding programmes.
Introduction
It is now widely accepted that aggressive single-trait selection for greater milk production in dairy cattle has resulted in unfavourable genetic trends in both animal health (Berry et al., Reference Berry, Bermingham, Good and More2011) and reproductive performance (Albarrán-Portillo and Pollott, Reference Albarrán-Portillo and Pollott2013). Genetic selection for terminal traits in beef cattle is also known to have unfavourable correlated responses in reproductive performance (Berry and Evans, Reference Berry and Evans2013). Compromised reproductive performance in dairy and beef production systems impacts negatively on overall profit. The cost of impaired fertility is greater in seasonal calving production systems compared with all year round calving systems because of the necessity of calving to coincide with the initiation of grass growth, thereby maximising the exploitation of low-cost grazed grass in the diet (Horan et al., Reference Horan, Faverdin, Delaby, Rath and Dillon2006). Fertility and other non-production traits are now generally included in many national dairy and beef cattle breeding objectives to reduce, halt, or reverse the previously observed deterioration in reproductive performance (Miglior et al., Reference Miglior, Muir and Van Doormaal2005). The generally low heritability of traditional field measures of reproductive performance in dairy (Berry et al., Reference Berry, Bastiaansen, Veerkamp, Wijga, Wall, Berglund and Calus2012) and beef populations (Berry and Evans, Reference Berry and Evans2013) however, hinder rapid genetic gain in these traits.
Traditional fertility traits are complex traits that are affected by more than genetics (Lucy, Reference Lucy2001). For example, calving interval is a function of the ability of the animal to undergo normal uterine involution, initiate normal ovarian function post-calving, express oestrus, conceive and establish pregnancy, as well as the length of gestation. Transrectal ultrasonography of the reproductive tract may help to identify detailed reproductive phenotypes (Fricke, Reference Fricke2002) that may not be affected by as many factors as the traditional traits. Reducing the unexplained variation in fertility may increase the heritability and, assuming genetic variance remains the same and access to the necessary information from individual animals are available, then genetic gain for fertility may improve. The objective of this study was to define detailed fertility phenotypes in dairy and beef cattle from transrectal ultrasonography and quantify the risk factors associated with these phenotypes. As well as providing a useful source of information for producers on individual cow and herd incidences of these traits, the results from this study may be useful in designing statistical models for national genetic evaluations to help increase the rate of genetic gain for overall reproductive performance.
Material and methods
Data
Data were available from the Irish Cattle Breeding Federation (ICBF) database on 148 947 transrectal ultrasound observations of the reproductive tract from 75 949 cows in 843 seasonal calving Irish dairy and beef herds between March 2008 and October 2012. Calving dates, degree of calving difficulty (measured on a scale of 1 to 4), artificial insemination (AI) dates, as well as breed composition and parity of the cow were also available from the Irish Cattle Breeding Federation database. Evaluation of the status of the reproductive tract (i.e., ovaries and uterine horns) was based on the ultrasound images described in detail by Mee et al. (Reference Mee, Buckley, Ryan and Dillon2009). A reproductive classification was assigned to non-pregnant cows based on a three point combined assessment of the right ovary, left ovary and a cross section of the uterine horns. Information collected using transrectal ultrasound included (1) the presence of ovarian structures such as the corpus luteum (CL), follicles or cystic structures, (2) day of the oestrus cycle; which could only be determined from the ultrasound scan up to 6 days after ovulation, (3) the accumulation of uterine fluid and tone and size of the uterine horns, (4) pregnancy status and estimated gestational age of the embryo/foetus and (5) embryonic/foetal death.
All ultrasound measurements were performed by a single commercial company (Reprodoc Ltd., Fermoy, Co. Cork, Ireland; http://www.cowsdna.com/) and results from all examinations were available from the ICBF database. Ultrasound assessments were performed at various time-points post-calving at the discretion of the producer. Ultrasound measurements were performed transrectally using a real-time B-mode ultrasound scanner with a 5 MHz transducer.
Phenotypes
The phenotypes generated from the ultrasound examinations included resumed ovarian cyclicity, cystic structures on the ovaries, early ovulation, uterine score and embryonic/foetal death.
Non-pregnant cows were identified as having resumed normal oestrus cyclicity (cycling=1) or not (cycling=0) at the time of examination; pregnant cows received no value for cycling. A cyclic cow was described as a cow that had a detectable CL on either ovary. The CL was characterised as dense echogenic tissue on the ovaries with or without the presence of a non-echogenic lacuna. In the latter stage of the oestrus cycle, the presence of a regressing CL (darkened structure) and the emergence of a dominant follicle (>10 mm) was classified as cycling. Cows that had not resumed cyclicity by the time of examination, as determined by the absence of a CL, were defined as not cycling.
Non-pregnant cows were identified as having follicular or luteal cystic structures (cystic=1) or not (cystic=0) on one or both of the ovaries at the time of examination; pregnant cows received no value for this variable. Cystic structures were identified by the presence of a large fluid filled structure on the ovary. A follicular cyst was characterised as a thin walled structure on the ovary >25 mm in diameter in the presence of no CL or a regressing CL (<5 mm in diameter). A luteal cyst was defined as a structure on the ovary >25 mm in diameter with the presence of luteal tissue in the wall of the structure of <5 mm. No distinction was made, however, between follicular and luteal cystic structures when recorded in the field.
Early ovulation was defined as ovulation having occurred (early=1) or not (early=0) before day 15 postpartum. Date of ovulation was determined from the ultrasound records up to 6 days after ovulation by the size and echogenicity of the CL, but could not be accurately determined thereafter. Thus, for cows scanned on or before day 21 postpartum, it was possible to identify if an ovulation occurred prior to day 15 postpartum by the age of the CL. For scans conducted after 21 days postpartum, cows received no value for early ovulation.
Uterine score was measured on a 1 to 4 scale based on the tone of the uterine wall, the size of the lumen, and the quantity of fluid present in the uterus of non-pregnant cows similar to that reported by Mee et al. (Reference Mee, Buckley, Ryan and Dillon2009). The uterine score was defined as (1) little or no fluid (<2 mm) with normal tone and normal lumen, (2) small quantity of fluid (2 to 5 mm) with normal tone and slightly enlarged lumen, (3) large quantity of fluid (5 to 60 mm) with moderately flaccid tone and enlarged lumen and (4) very large quantity of fluid (>60 mm) with a flaccid tone and very enlarged lumen. These scores indicate the health status of the uterus at the time of examination, with a score of one being most desired and a score of four being least desired.
Embryonic/foetal death was defined as the presence of a non-viable embryo/foetus at the time of scanning or a cow scanned pregnant that did not subsequently calve to that pregnancy. A non-viable embryo/foetus was identified by the presence of an embryo/foetus with no detectable heartbeat. The identification of an embryo was only possible from day 20; therefore only embryo death which occurred >20 days was determined. Embryo/foetal death was identified if a cow that had been scanned pregnant did not calve at the predicted calving date dictated by the predicted gestational age of the embryo/foetus at the time of examination (i.e., embryo/foetal death=1). Where no subsequent calving dates were available, embryo/foetal death was assumed if an AI occurred after the date of examination where a pregnancy was detected (i.e., embryo/foetal death=1). If a cow was scanned pregnant with a viable embryo and calved around the predicted calving date, embryonic/foetal death was assumed not to have occurred (i.e., embryonic/foetal death=0). Predicted calving dates were obtained using estimated gestational age of the embryo/foetus at the time of scanning and assuming a gestation length of 283 days. To ensure accuracy, the predicted calving date was compared against the actual calving date (obtained from the ICBF database), and a strong positive correlation (r=0.92, P<0.001) was obtained. If no subsequent calving date was available and there was no AI after the scan date, no value was allocated to the embryonic/foetal death variable.
Data edits
Nulliparous heifers were removed from the data. Herd-years where <80% of the cows in a herd were presented for ultrasound examination at least once in a calendar year were discarded, in order to obtain a comprehensive view of the herd-year; a total of 74 herd-years were discarded. Treatment was recommended by the ultrasound technician for a selection of reproductive tract classifications; however, no information was available on whether or not any treatment subsequently occurred. Therefore, ultrasound records occurring after the assignment of a reproductive tract classification that would have resulted in a treatment recommendation were discarded. The exception was where the subsequent ultrasound records were in pregnant animals.
Where information on next calving date was available, cows with a calving interval of >800 or <300 days were removed. Cows calved >600 days at the time of ultrasound examination that were identified as non-pregnant were also discarded. Cows of parity 5 or greater were grouped together in one parity group (i.e., parity 5+). Contemporary groups of herd-year-season of examination for each trait were created. The definition of herd-year-season was based on an algorithm described in detail by Berry and Evans (Reference Berry and Evans2013). Within a given herd, the algorithm groups animals together, that are scanned around the same time. Herd-year-seasons with less than five animals were removed from the analysis. After editing, 72 773 ultrasound records from 44 415 lactating cows in 643 herds remained. Of these, 40 940 cows were from 475 dairy herds and 3475 cows were from 168 beef herds.
Statistical analyses
Factors associated with the logit of the probability of a positive outcome for each of the binary fertility traits were quantified using generalised estimating equations in ASReml (Gilmour et al., Reference Gilmour, Cullis, Welham and Thompson2009) assuming a binomial error distribution. Factors associated with uterine score were quantified using linear mixed models in ASReml (Gilmour et al., Reference Gilmour, Cullis, Welham and Thompson2009). An initial analysis included a single factor, herd-type (i.e., dairy or beef) in the model to quantify differences between the two herd types.
Factors considered for inclusion in subsequent models included parity (1, 2, 3, 4 and 5+), level of dystocia from the previous calving (i.e., no assistance, slight assistance, considerable assistance and veterinary assistance), stage of lactation (0 to 14, 15 to 39, 40 to 84, 85 to 149, 150 to 300 and >300 days post calving), year of examination (2009 to 2012), month of examination (Januar to December), breed of cow (Holstein, Friesian, Jersey, Montbelliarde, Norwegian Red, Belgian Blue, Aberdeen Angus, Hereford, Charolais, Limousin and Simmental) and heterosis and recombination loss coefficients of the cow; interactions between the main effects were also evaluated. Breed proportions were individually included in the model as continuous effects. Animal and herd-year-season contemporary group were included in all models as random effects. To avoid quasi-complete separation of the data, when the dependent variable was cycling or not, for interactions between the main effects and dystocia, dystocia was categorised as (1) no dystocia or assistance (unobserved/no assistance at calving) or (2) at least some assistance.
Results
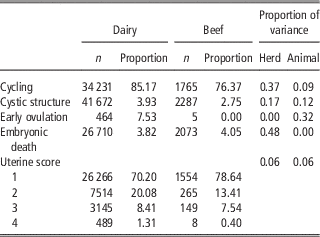
The prevalence of cycling, cystic structures, early ovulation and embryonic/foetal death in the entire dataset was 84.75%, 3.87% 7.47% and 3.84%, respectively. The prevalence of uterine scores of 1, 2, 3 and 4 in the entire dataset was 70.63% (n=27 820), 19.75% (n=7779), 8.36% (n=3294) and 1.26% (n=497), respectively. The prevalence of each trait in dairy and beef herds is summarised in Table 1.
Number of records (n) and mean prevalence in dairy and beef herds for cycling, cystic structures, early ovulation, embryonic death and uterine score; also included is the proportion of variation in he different traits accounted for by herd and animal (i.e., repeatability)

Dairy v. beef herds
The mean days post calving at the time of examination was the same (i.e., 144 days) in both dairy and beef herds. Cows in beef herds had a lower likelihood of cycling (OR=0.51, 95% CI=0.41 to 0.63, P<0.001) and cystic structures (OR=0.70, 95% CI=0.54 to 0.91, P<0.01) at the time of examination compared with cows in dairy herds. The mean uterine score of cows in beef herds was lower (i.e., superior) (P<0.001) than the mean uterine score of cows in dairy herds (Table 1).
Cycling
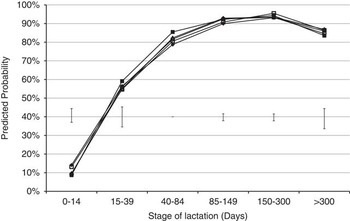
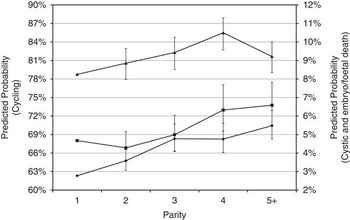
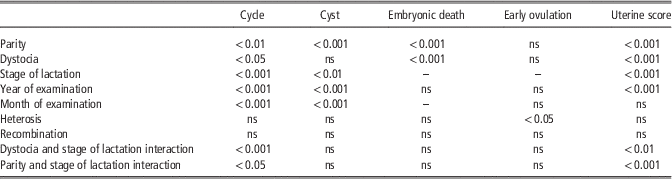
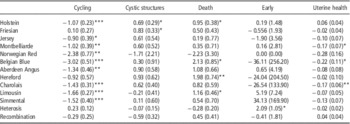
Factors associated with the likelihood of a cow cycling at the time of examination included parity, degree of dystocia in the previous calving, stage of lactation, month of examination, and breed proportion of Holstein, Jersey, Montbelliarde, Norwegian Red, Belgian Blue, Aberdeen Angus, Charolais, Limousin and Simmental (Tables 2 and 3). The association between stage of lactation (n=6) and cycling differed however depending on whether or not assistance at calving was experienced during the previous calving (n=2). Similarly, the association between stage of lactation (n=6) and cycling differed with parity (n=5). Nevertheless, although the interaction between parity and stage of lactation was statistically significant, the trends for the association between parity and cycling were similar across stages of lactation (Figure 1). The main effects will therefore be discussed separately. The likelihood of cycling increased with parity (Figure 2). Relative to parity 1 cows, the odds of cycling at the time of examination was greater in parity 3 (OR=1.25, 95% CI=1.05 to 1.50, P<0.001) and parity 4 (OR=1.59, 95% CI=1.29 to 1.96, P<0.001) cows; this equated to a 4 percentage unit and 6 percentage unit greater predicted probability of cycling in parity 3 and 4 cows, respectively, relative to a 1st parity cow.
Predicted probability of cycling (average 95% confidence interval for each parity are represented as error bars) for parity 1 (♦), 2 (□), 3 (▴), 4 (■) and 5+ (●) across different stages of lactation. The reference cow was a 100% Holstein cow with no previous dystocia, scanned in March in the average year.

Predicted probability (95% confidence intervals represented as error bars) of cycling (▴), cystic structures (♦) and embryonic/foetal death (■) in different parities. The reference cow was a 100% Holstein cow, in mid lactation (40 to 85 days postpartum), with no previous dystocia scanned in March in the average year.

Summary of risk factors associated with the fertility traits

ns=non-significant; –=not tested.
Heterosis, recombination loss and breed regression coefficients (standard errors in parenthesis) for the different reproductive traits

*P<0.05, **P<0.01, ***P<0.001.
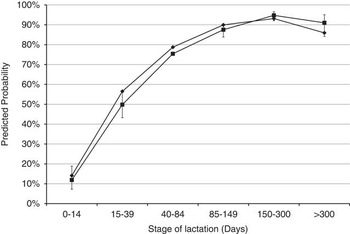
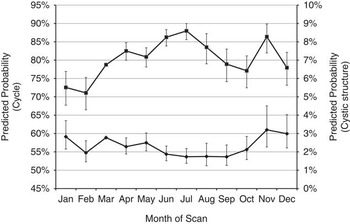
The likelihood of cycling increased with advancing stage of lactation (n=6) between calving and 84 days postpartum, remained similar between 85 and 300 days postpartum, and reduced slightly thereafter (Figure 1). Cows that had experienced dystocia in their most recent calving had a reduced likelihood of cycling in the early stages of lactation (0 to 40 days post calving) compared with cows that had not experienced dystocia, but the difference no longer existed after 40 days post calving (Figure 3). There was an increased likelihood of a cow cycling mid-year compared with the remainder of the year (Figure 4). Increased proportion of Holstein, Jersey, Montbelliarde, Norwegian Red, Belgian Blue, Aberdeen Angus, Charolais, Limousin and Simmental breed fractions were associated with a decreased likelihood of cycling at the time of examination (Table 3).
Predicted probability of cycling (95% confidence intervals represented as error bars), for dystocia (■) and no dystocia (♦) across different stages of lactation. The reference cow was a 100% Holstein parity 1 cow, scanned in March over the average year.

Predicted probability (95% confidence intervals represented as error bars) of cycling (■) left axis and cystic structures (♦) right axis across different month of the year. The reference cow was a 100% Holstein parity 1 cow, in mid lactation (40 to 85 days postpartum), with no previous dystocia, over the average year.

Cystic structures
Factors associated with cystic structures at the time of examination included parity (n=5), stage of lactation (n=6), month of scan (n=12) and both Holstein and Friesian breed proportion (Tables 2 and 3). No interactions between the fixed effects existed. Relative to parity 1 cows, the odd of cystic structures occurring in parity 2, 3, 4 and 5+ cows were 1.30 (95% CI=1.11 to 1.54, P<0.01), 1.76 (95% CI=1.49 to 2.06, P<0.001), 1.75 (95% CI=1.47 to 2.08, P<0.001) and 2.02 (95% CI=1.75 to 2.36, P<0.01), respectively.
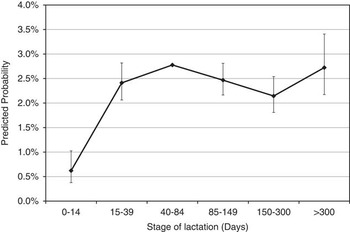
Cows scanned shortly after calving (0 to 14 days) had a 0.22 odds of having cystic structures (95% CI=0.13 to 0.36, P<0.001) compared with cows that were 40 to 84 days calved; this manifested itself as a 2 percentage unit lower predicted probability of cystic structures being present at the time of examination. The likelihood of cystic structures at the remaining stages of lactation was similar to each other (Figure 5). Increased proportion of Holstein and Friesian breed fractions was associated with a greater likelihood of cystic structures (Table 3).
Predicted probability (95% confidence intervals represented as error bars) of cystic structures in different stages of lactation. The reference cow was a 100% Holstein, parity 1 cow with no previous dystocia, scanned in March in the average year.

Early ovulation
Heterosis was the only factor associated with early ovulation. Increased heterosis was associated with a greater likelihood of early ovulation (Tables 2 and 3).
Uterine score
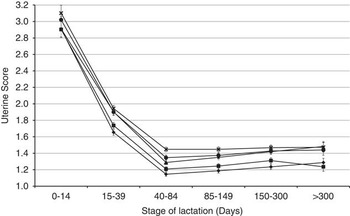
Factors associated with uterine score included parity (n=5), stage of lactation (n=6), month of examination (n=12), level of dystocia in the previous calving (n=4) and breed proportion of Montbelliarde, Belgian Blue and Charolais (Tables 2 and 3). The association between stage of lactation and uterine score differed with parity and with degree of dystocia experienced. Although the interaction was statistically significant, trends for parity effect were similar across stages of lactation (Figure 6) and are therefore discussed as main effects. Uterine score deteriorated with increasing parity number with a mean (standard error in parenthesis) uterine score in parity 1 to 5+ animals of 1.57 (0.03), 1.61 (0.03), 1.73 (0.03), 1.75 (0.03) and 1.81 (0.03), respectively. Mean (standard error in parenthesis) uterine score improved with stage of lactation from 2.97 (0.09) in early lactation (0 to 14 days postpartum) to 1.83 (0.03) between 15 and 39 days postpartum and 1.29 (0.02) between 40 to 84 days postpartum. Mean uterine score remained similar for the remainder of the lactation.
Least square means of uterine score for parity 1 (♦), 2 (■) 3 (▴), 4 (●) and 5+ (x) animals across different stages of lactation. The reference cow was an average of the breeds, scanned in the average month in the average year.

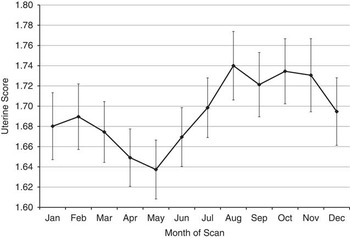
Compared with cows that experienced no dystocia (mean uterine score of 2.67; s.e.=0.04) or slight assistance (mean uterine score of 2.79; s.e.=0.08), the mean uterine score in early lactation was greater (P<0.01; i.e. inferior) for cows that experienced considerable dystocia (mean uterine score of 3.46; s.e.=0.26) or severe dystocia (mean uterine score of 3.65; s.e.=0.32). As stage of lactation progressed (>15 days postpartum) there was no significant difference in mean uterine score between different levels of dystocia (Figure 7). Mean uterine score decreased (i.e., improved) from the start of the calendar year to a trough between May and August and deteriorated thereafter (P<0.05) (Figure 8). Increased proportion of Montbelliarde, Belgian Blue and Charolais breed fractions was associated with a decreased uterine score (Table 3).
Uterine score least square means for different dystocia score, (1 ♦, 2 ■, 3 ▴ and 4 ●) across different stages of lactation. The reference cow was an average of the breeds, average parity, scanned in the average month in the average year.

Least square means (standard errors represented as error bars) of uterine score across different month of scan. The reference cow was an average of the breeds, of average parity, scanned in the average year.

Embryonic/foetal death
Factors associated with embryonic/foetal death included parity (n=5) and Holstein, Belgian Blue, Hereford and Limousin breed proportion (Tables 2 and 3). No interactions between the fixed effects existed. The predicted probability of embryonic/foetal death increased with parity (Figure 2). Compared with parity 1 cows, the odds of embryonic/foetal death was greater in parity 4 (OR=1.37, 95% CI=1.12 to 1.70 P<0.01) and parity 5+ cows (OR=1.44, 95% CI=1.19 to 1.73 P<0.001). Increased proportion of Holstein, Belgian Blue, Hereford and Limousin breed fractions was associated with an increased likelihood of embryonic/foetal death (Table 3).
Discussion
Traditional fertility traits are complex traits affected by multiple factors. Decomposing traditional fertility traits into more detailed phenotypes may help to understand and therefore improve fertility more rapidly in both dairy and beef cattle breeding programmes. The ability to resume cyclicity postpartum measured by progesterone levels (Opsomer et al., Reference Opsomer, Gröhn, Hertl, Coryn, Deluyker and de Kruif2000, Santos et al., Reference Santos, Rutigliano and Filho2009) and uterine health measured by uterine fluid (Sheldon et al., Reference Sheldon, Williams, Miller, Nash and Herath2008) have been previously shown to affect reproductive performance. However, these methods are difficult and expensive to collect for on-farm decision support tools and for large-scale data collection for breeding programmes. The objective therefore of this study was to characterise detailed phenotypic fertility traits in both dairy and beef cattle derived from routinely collected ultrasound examination of the reproductive tract and to identify risk factors associated with these fertility traits.
Parity
Although the likelihood of the cow having resumed ovarian cyclicity at the time of examination increased with parity, the other fertility traits evaluated deteriorated with increasing parity. Previous studies have documented parity to be associated with the resumption of cycling in both dairy (Rhodes et al., Reference Rhodes, McDougall, Burke, Verkerk and Macmillan2003; Santos et al., Reference Santos, Rutigliano and Filho2009; Gautam et al., Reference Gautam, Nakao, Yamada and Yoshida2010) and beef (Stevenson et al., Reference Stevenson, Hoffman, Nichols, McKee and Krehbiel1997) cows. The postpartum interval to return to normal ovarian cyclicity was longer in primiparous cows compared with multiparous cows (Santos et al., Reference Santos, Rutigliano and Filho2009). This longer interval to resumption of cyclicity in primiparous cows has been linked to greater nutritional stress in younger cows due to requirements for growth and lactation (Lucy, Reference Lucy2001; Rhodes et al., Reference Rhodes, McDougall, Burke, Verkerk and Macmillan2003). This is one reason why seasonal calving producers tend to calve heifers earlier than mature cows, thereby allowing primiparous cows a longer period from calving to the start of the herd’s breeding season. Nonetheless, selection bias may also contribute to these parity effects, since cows inseminated early in the breeding season (i.e., early resumption of ovarian activity) will be retained, implying that older cows have already been selected in earlier parities for shorter postpartum intervals to resumption of ovarian cyclicity.
Corroborating the results from the present study, others have shown an association between parity and the presence of cystic structures (Erb and Martin, Reference Erb and Martin1980; Zulu and Penny, Reference Zulu and Penny1998; Roche, Reference Roche2006), embryonic death (Santos et al., Reference Santos, Rutigliano and Filho2009) as well as a deterioration in uterine health (Dubuc et al., Reference Dubuc, Duffield, Leslie, Walton and LeBlanc2010). The increased incidence of cystic structures in older parity cows could be potentially related to their greater milk production and its known effect on the presence of cystic structures (Zulu and Penny, Reference Zulu and Penny1998). Greater milk production in older parity cows and the associated greater negative energy balance (Berry et al., Reference Berry, Veerkamp and Dillon2006) may also be a contributing factor to increase prevalence of embryo/foetal death in these animals. Moreover, the bovine endocrine and immune system age rapidly; Wathes et al. (Reference Wathes, Cheng, Bourne, Taylor, Coffey and Brotherstone2007) documented reduced levels of circulating IGF-1 and insulin in early lactation multiparous Holstein–Friesian dairy cows compared with early lactation primiparous Holstein–Friesian dairy cows. Such endocrine differences between parities are also likely to contribute to parity differences in reproductive performance.
The normal process of postpartum uterine recovery (Sheldon and Dobson, Reference Sheldon and Dobson2004) involves the regeneration of the endometrium, the elimination of pathogens, and the returning of the uterus to normal size (involution). The tone of the uterus and the quantity of fluid present in the uterus is a reflection of the involution process and degree of infection in the uterus (Sheldon and Dobson, Reference Sheldon and Dobson2004). Substantiating the results from the present study (Figure 6), others (El-Din Zain et al., Reference El-Din Zain, Nakao, Abdel Raouf, Moriyoshi, Kawata and Moritsu1995) have shown that uterine involution takes longer in older parity cows. Furthermore, both the incidence and severity of uterine infection is greatest in later parity cows (Erb and Martin, Reference Erb and Martin1980; Dubuc et al., Reference Dubuc, Duffield, Leslie, Walton and LeBlanc2010).
Stage of lactation
Early lactation in cattle is characterised by energy intake being lower than the energy required for maintenance and milk production, resulting in cows in negative energy balance (Berry et al., Reference Berry, Veerkamp and Dillon2006). The impact of negative energy balance on reproductive performance in dairy cows is well established (Beam and Butler, Reference Beam and Butler1998). In agreement with the present study, stage of lactation has previously been shown to be associated with resumption of the ovarian cyclicity in both dairy (Rhodes et al., Reference Rhodes, McDougall, Burke, Verkerk and Macmillan2003; Gautam et al., Reference Gautam, Nakao, Yamada and Yoshida2010) and beef cows (Murphy et al., Reference Murphy, Boland and Roche1990) as well as the occurrence of cystic structures in dairy cows (Gröhn et al., Reference Gröhn, Hertl and Harman1994) and the uterine health of cows (Sheldon et al., Reference Sheldon, Williams, Miller, Nash and Herath2008). As lactation progresses, energy balance improves (Berry et al., Reference Berry, Veerkamp and Dillon2006), leading to more energy available for reproductive function and other bodily functions. The normal period of anoestrus postpartum can be between 25 and 50 days in dairy cows (Opsomer et al., Reference Opsomer, Gröhn, Hertl, Coryn, Deluyker and de Kruif2000) and up to 60 days in beef cows (Yavas and Walton, Reference Yavas and Walton2000). Corroborating results from the present study, Gautam et al. (Reference Gautam, Nakao, Yamada and Yoshida2010) using data from 215 Holstein cows from four herds documented that <65% of cows had resumed cycling before 35 days postpartum.
In contrast to the other fertility traits, the likelihood of cystic structures increased as lactation progressed. The increase in the prevalence of cystic structures may be related to the increased milk production observed over the same period (Horan et al., Reference Horan, Faverdin, Delaby, Rath and Dillon2006). The occurrence of follicular cysts has been previously identified to have greater incidences and occur earlier postpartum compared with luteal cysts (Garverick, Reference Garverick1997). The presence of cystic structure in early lactation that persisted throughout the remainder of the lactation may be related to the combination of both types of cystic structures into one trait in the present study. The greater prevalence of cystic structures later in lactation may also be attributable to selection bias since only non-pregnant were included in the analysis and only cows with compromised reproductive performance of some sort are likely to be non-pregnant in late lactation within a seasonal calving production system as exists in the present study.
The clearance of pathogens from the uterus postpartum can take up to 35 days (Sheldon and Dobson, Reference Sheldon and Dobson2004), while normal involution of the uterus can take up to 40 days (Sheldon et al., Reference Sheldon, Williams, Miller, Nash and Herath2008). In the present study, uterine score improved (indicating uterine tone had improved and the quantity of fluid present in the uterus had reduced) with stage post-calving and this may simply be a result of the natural process of the uterine involution postpartum.
Month and year of ultrasound examination
Seasonal effects on reproductive performance have been previously documented in populations of dairy (Opsomer et al., Reference Opsomer, Gröhn, Hertl, Coryn, Deluyker and de Kruif2000; Bruun et al., Reference Bruun, Ersbøll and Alban2002; Roche, Reference Roche2006) and beef (McNatty et al., Reference McNatty, Hudson, Gibb, Henderson, Lun, Heath and Montgomery1984) cows. Seasonal effects in the present study were estimated using multiple regression models; therefore, the seasonal effect observed is not an artefact of stage of lactation. The improved reproductive performance over the spring/summer months may be related to the quantity and quality of the feed available. In the current study the improved uterine score mid-year (March to July) coincides with the commencement of the grazing season and the period of high-quality grass. The deterioration in uterine score between August and February in the present study coincides first with the natural decline in grass growth and quality followed by the use of conserved forages during the indoor period. However, due to the seasonal calving systems that predominate in the present study a reduced number of records existed for some months of the year contributing to the larger associated standard errors.
Herd type and breed
Few studies have attempted to quantify the difference in detailed reproductive tract performance between dairy cows and beef cows. Scientific literature reviews, however, on both dairy and beef cows separately (Yavas and Walton, Reference Yavas and Walton2000; Rhodes et al., Reference Rhodes, McDougall, Burke, Verkerk and Macmillan2003; Crowe, Reference Crowe2008) suggest that beef cows have a greater incidence of prolonged postpartum anoestrous compared with dairy cows. The longer postpartum anoestrus period in beef cattle has been linked to the suckling effect (Rhodes et al., Reference Rhodes, McDougall, Burke, Verkerk and Macmillan2003). This is consistent with results in the present study where cows in beef herds in the present study were less likely to be cycling at the time of examination. The occurrence of cystic structures has been most commonly identified in dairy cows (Garverick, Reference Garverick1997; Peter, Reference Peter2004), with lower incidences reported in beef cows (Peter, Reference Peter2004). The lower incidence of cystic structures in cows from beef herds may relate to their lower milk production compared with cows in dairy herds The improved uterine score in beef cows is likely related to superior postpartum energy status compared with dairy cows; differences are also likely attributable to differing breeding policies (i.e., selection for increased milk production in dairy cows and increased carcass yield in beef).
The greater likelihood of the presence of cystic structures and embryonic/foetal death in Holstein cows is not unexpected since the Holstein breed has traditionally been aggressively selected for milk production which has been linked to cystic structures (Gröhn et al., Reference Gröhn, Hertl and Harman1994) and embryonic death (Diskin et al., Reference Diskin, Murphy and Sreenan2006). Corroborating previous research on double muscled cows (Arthur, Reference Arthur1995), the Belgian Blue breed had the lowest likelihood of cycling, as well as an increased likelihood of embryonic death. The favourable association between heterosis and some of the traits (although not always significant) in the present study is not unexpected since favourable associations with fertility traits have been documented elsewhere (Wall et al., Reference Wall, Brotherstone, Kearney, Woolliams and Coffey2005).
Dystocia
Corroborating results from the present study, an unfavourable association was previously documented to exist in dairy cows between dystocia and both the likelihood of cycling postpartum (Opsomer et al., Reference Opsomer, Gröhn, Hertl, Coryn, Deluyker and de Kruif2000) as well as uterine health (Sheldon and Dobson, Reference Sheldon and Dobson2004). Furthermore, dairy cows that experienced dystocia had a greater incidence of metritis and endometritis postpartum (Dubuc et al., Reference Dubuc, Duffield, Leslie, Walton and LeBlanc2010). Sheldon and Dobson (Reference Sheldon and Dobson2004) documented that dystocia was associated with an increase in bacterial infections postpartum resulting in delayed uterine recovery. This in turn impacts the time required for uterine involution, clearance of bacteria, and resumption of normal ovarian cyclicity (Sheldon and Dobson, Reference Sheldon and Dobson2004). In the current study, the association with dystocia was greatest early postpartum; however, over time the effect on the reproductive tract abated.
Conclusions
Ultrasound examination of the reproductive tract can identify detailed fertility phenotypes to assist in management decisions for improving reproductive performance in both dairy and beef cattle. Furthermore, ultrasound examination of the reproductive tract can provide large-scale collection of biologically pertinent information on detailed reproductive performance for using in benchmarking or possibly improved genetic evaluations for reproductive performance. Herd type, parity and stage of lactation were identified as important risk factors for ultrasound assessment measures of reproductive performance in the present study, consistent with previously documented risk factors associated with traditional fertility traits. The risk factors identified in this study can be use in genetic models to determine the genetic contribution to phenotypic variation among cows in these traits and their usefulness in breeding strategies to improve reproductive performance.
Acknowledgements
Funding from the Department of Agriculture, Food and Marine Research Stimulus Fund (RSF 11/S/133) and the OptiMIR project is gratefully acknowledged.