


INTRODUCTION
Agricultural shows originate from the late 18th and early 19th centuries where they were established as events to display the ‘best’ livestock and to disseminate new farming techniques and good practice to farmers. More recently agricultural shows have taken on the additional role of the promotion of British produce to the general public [Reference Holloway1]. Recent legislation, introduced in response to the 2001 foot-and-mouth disease (FMD) outbreak, has resulted in a tightening of bio-security measures both at the show and for farmers attending shows. These bio-security measures add to the burden of administration for both attendees and show organizers and increase the cost of holding a show [Reference Riley2], many of which already run at a net loss [Reference Holloway1]. It is, therefore, important to improve our understanding of the potential role of agricultural shows in the spread of infectious diseases in order to assess the likely impact of these measures in reducing the risk of disease outbreaks spread via shows. Here I focus on the potential for disease spread between shows via common competitors using a network-based approach.
The pattern of contacts between shows (nodes) plays an important role in determining the potential spatial and temporal dynamics of an infectious disease through the show population. Network structure affects individual risk of exposure to infection, the maximum potential epidemic size and the efficacy of targeted prevention programmes [Reference Wallinga, Edmunds and Kretzschmar3, Reference Read and Keeling4]. Network analysis has been used extensively to study the social networks underlying the spread of sexually transmitted diseases [Reference Jolly, Muth, Wylie and Potterat5]. These studies have highlighted the impact of a heterogeneous contact structure between pairs of individuals within a population on the transmission of infection [Reference Ghani, Swinton and Garnett6, Reference Gupta, Anderson and May7]. Furthermore, detailed investigations of the spread of viruses using the internet have highlighted the importance of hubs (nodes that are highly connected) and brought into question traditional methods by which we estimate critical thresholds above and below which we expect such viruses to spread or to die out [Reference Pastor-Satorras and Vespignani8].
Historically, the viability of developing a true picture of the contact structure of large populations has been dismissed. However, developments in network theory, improvements in recording animal movements and increasing computer power, mean that we can begin to explore the between-farm contact structure of farm animal populations. The contact networks of farms consist of layers of ‘relations’, where a relation is defined as a specific type of tie [Reference Wasserman and Faust9]. Ties at a local level might include shared pasture, attendance at local markets, direct sales between farms, attendance at local shows, shared boundaries, shared equipment and workers (e.g. veterinarians and contractors) moving between farms. Long-distance ties might include summer grazing, large markets, shared rams, large agricultural shows and breed-specific sales. Which of these relations are important will vary between diseases according to a range of biological and environmental parameters. In general, the probability of disease spread from one farm to another is likely to be a function of several types of relations. By combining the set of relations contributing to disease spread to form a single network, a risk-potential network [Reference Friedman and Aral10] is obtained on which disease spread can be modelled.
The relative importance of different relations to the spread of infectious diseases is likely to vary throughout the farming year. In this paper I focus on the sheep population and investigate the structure of the network of links between agricultural shows. Data collected from shows held in 2000 are used to investigate the overlap in common competitors between shows and the relationship between this overlap and geographic distance between shows. The potential for disease spread through the network of shows is examined for diseases of varying infectious periods. The maximum size of an epidemic is limited by the population at risk, thus, one approach to disease control, might be to break up the network of shows by imposing limits on which shows individuals can co-attend. Two methods of grouping nodes are compared in relation to the number of inter-group ties that would need to be broken to separate the show network into four groups. The first method uses geographical location to group nodes by region, and the second method uses a data-driven grouping, faction analysis, that minimizes the number of inter-group ties [Reference de Amorim, Barthélemy and Ribeiro11, Reference Borgatti, Everett and Freeman12]. It is important to emphasize that this paper focuses on the potential for disease spread via shows, which constitutes just one of the many relations that could contribute to the spread of an exotic disease. The current precautions taken to minimize the risk of disease transmission at shows in Great Britain are highlighted in the discussion.
METHODS
Data collection
A questionnaire consisting of 10 short-answer questions was sent out in November 2000 to all show society secretaries listed in The Showman's Directory [Reference Lance and Lance13] and in the Farmers' Guardian Year Book and Desk Diary [14]. Addressees were asked to provide information on the location, date and frequency of the show they represented. In addition respondents were asked to provide a copy of the 2000 sheep competition classes or a 2000 show guide.
Where show programmes were provided, individual entrant names, addresses (if included in the programme) and breed entered for all competitors in live sheep classes were extracted and recorded in a Microsoft Access database (Microsoft Corporation, Seattle, WA, USA). Where the entrant's full name and address were provided, identifying matches was straightforward. For those entrants for whom only name and breed were known, matches were established on the basis of common initials, surname and breed(s) exhibited.
OS grid references for showgrounds were obtained from exact locations of shows (if supplied by the respondent) or from postcodes [15]. Postcodes give location to an accuracy of 100 m. For each pair of shows (dyad) two pieces of relational information were recorded in matrix form: the time (in days) separating the shows, and the number of common competitors. The diagonals of both matrices were set to zero.
Network analysis and modelling
A directed link from show A to show B, say, can only occur if both show A occurs before show B and shows A and B share common competitors. Thus the adjacency matrix for the show-to-show network is the element-by-element product of the number of common competitors matrix with the dichotomized time between shows matrix [such that (A, B) ⩾1 if and only if show A precedes show B and shows A and B share common competitors, otherwise (A, B)=0]. Subsequent analysis is based on this network.
For each dyad, the direct geographical distance (by a straight line) was calculated using the show grid coordinates. For each show, the in, out and total node degrees were calculated directly from row and column sums of the adjacency matrix [Reference Wasserman and Faust9]. Node degree is a basic measure of how connected an individual show (node) is to the rest of the network. The in-degree and out-degree take into account the direction of each link.
The impact of restrictions on the shows that a particular set of farms is eligible to enter sheep into was assessed using two methods of subdividing the shows. The first method is based on show attribute, in this case geographical location. For illustrative purposes we divide Great Britain in to four regions: Scotland, North of England, the Midlands & Wales, and Southern England (including East Anglia). The second method, faction analysis, is data driven and partitions nodes into a user-defined number of groups (here we choose four) such that the number of inter-group ties are minimized [Reference de Amorim, Barthélemy and Ribeiro11, Reference Borgatti, Everett and Freeman12]. The method ignores tie strength (in this case the number of common competitors each pair of shows has). The procedure is iterative and may stabilize at local minima. Here we use 1000 random starts and the maximum number of iterations in a series is set to 50, the length of time in the penalty box (used to try and prevent iteration around a local minimum) is fixed at 15 [Reference Borgatti, Everett and Freeman12]. An index of the relationship between external and internal links, the E–I index [Reference Borgatti, Everett and Freeman12, Reference Krackhardt and Stern16], is used to compare the impact of these groupings on the number of ties within and between groups. The E–I index is a measure of dominance of external over internal ties and is given by:

where E is the total number of links between subgroups and I is the total number of links within the subgroups. The possible scores for the E–I index range between −1 and +1. As the E–I index approaches +1 all the links would be external to subgroups. A score of −1 would indicate all links are internal. The observed values are compared with the expected value for the E–I index, if all the ties were selected randomly, using a permutation test (5000 iterations). Note that this is not necessarily zero as the maximum values of E and I depend on the number and size distribution of the subgroups.
A simple model to determine the relationship between the show at which an infectious disease, with a fixed infectious period, is introduced and the potential number of shows at which sheep could be subsequently exposed to this infection was set up using the following assumptions:
• if any sheep attending a show are infectious, then all sheep at that show become infected;
• if these sheep, or sheep from the same holding, attend another show within the infectious period of the disease, then all sheep at that show become infected.
This model gives us the worst-case scenario for an infectious disease.
Next we tighten the criteria on what constitutes a tie between two nodes and consider the impact of placing a maximum time limit on the time between shows such that a directed edge between shows A and B can only occur if A and B (i) have at least one common competitor and (ii) are separated by less than or equal to the maximum time limit. This time limit equates to the time between infection and clinical signs, whereby if a competitor's sheep are infected at show A, then the owner will not be aware of this, and hence take no disease control action, until clinical signs are observed. The impact of these limitations on the formation of a dyad are assessed at a network level in terms of the number of isolates and disconnected components of the graph, and at an individual node perspective in terms of the ‘accessible world’ of each node. The accessible world is defined as the number of nodes that can be reached via a directed path of any length from the given node, in this case the number of shows that could potentially be exposed to infection given that the infection is introduced at a given show.
RESULTS
Questionnaire
Out of 321 questionnaires sent out, 176 (55%) completed questionnaires were returned. A further 15 questionnaires were returned uncompleted. There was no significant difference in the response rate between geographical regions. Of the respondents, 146 (83%) answered yes to ‘Are sheep shown/present at the show?’. The majority of shows were always held at the same address (90%) and were held annually (99%) at a fixed time of year (93%). There is no official facility for the sale of sheep at the majority of shows (93%).
The majority of shows are 1 day long and are not restricted to weekends and public holidays (Fig. 1a, c). The main show season lasts from late April to the end of September (Fig. 1b) with shows distributed throughout Great Britain (Fig. 1d).
Summary of show data for all shows with sheep: (a) percentage of show days by day of week (note shows lasting more than 1 day are counted for each day they occur on); (b) percentage of shows by month of first day of show; (c) percentage of shows by duration of show in days; (d) Geographical distribution of agricultural shows at which sheep were present in 2000 (black circles); shows at which sheep were not present (grey circles); and, non-responders (grey triangles). Locations for shows at which sheep were not present, and for shows for which no response was received, were obtained from the postcode of the addressee and may not reflect the actual location of the showground.

Show programmes were supplied by 110 respondents: 68 included name and address details of competitors for each competition class, 12 included entrant name only and the remainder contained no entrant information. After data collection and initial processing, 2813 unique entrants were identified. Of these 22% were recorded at exactly two shows and 18% at three or more shows.
Network analysis
The directed show-to-show network is acyclic since the direction of a tie between any two shows depends on the relative dates of those shows. The potential maximum in-degree of shows increases as time progresses and conversely the potential maximum out-degree of shows decreases to zero at the end of the show season. This is reflected in a linear increase in cumulative average in-degree from zero to 7·6 and a decrease in cumulative average out-degree from 21 to 7·6 over time. On average, 64% (s.d.= 20%) of entrants at any given show registered for at least one other show and the number of shows that each show shared common competitors with ranged from 0 to 53 (mean=15·13; s.d.=8·96). One show did not share any common competitors with any other show in the database.
The probability that two shows are linked via common competitors decreases with geographical distance between the shows (Fig. 2a). Moreover, for those pairs of shows with common competitors, the median number of common competitors decreased with increasing geographical distance (Fig. 2b).
Relationship between the geographical distance between agricultural shows and: (a) the proportion of dyads within each distance band that are linked via common competitors; (b) the distribution of number of common competitors in the sheep classes. The box plot has lines at the lower quartile, median and upper quartile values. The whiskers give values within 1·5× inter-quartile range [17]. Note: upper bounds for distance bands only are shown. The first band contains pairs of shows that were ⩽50 km apart, the second band contains pairs of shows that were >50 km apart and ⩽100 km apart, and so on.

Faction analysis
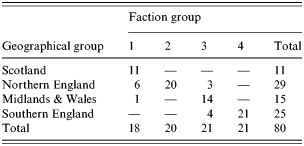
There were 605 ties between shows in the show-to-show network resulting in a density for the undirected network of 0·19. Grouping shows by geographic region resulted in within-group densities ranging from 0·42 to 0·48 and between-group densities ranging from 0·01 to 0·18 (Fig. 3a). This grouping results in 218 ties between groups that would need to be broken to ensure no transmission of infection between the groups. Grouping by faction analysis resulted in within-group densities ranging from 0·37 to 0·67 and a maximum between-group density of 0·16, i.e. lower than the density of the complete network (Fig. 3b). However, this grouping only reduced the number of ties, which would need to be broken to ensure no transmission of infection between groups, to 210. Further examination of these groups reveals that they are similar to the geographical groups with each faction group dominated by one region (Table). The E–I index for the geographical groups is −0·28 compared with an expected range of 0·27–0·57 and for faction groups is −0·31 compared with an expected range of 0·39–0·61, thus, both groupings are more effective at reducing the number of inter-group ties than a random grouping.
Schematic diagram illustrating the within- and between-group densities for (a) groups selected on geographical location; (b) data-driven groups obtained using faction analysis.

Breakdown of faction group membership according to geographical-based group membership. Faction groups were calculated in UCINet [Reference Borgatti, Everett and Freeman12] using the undirected binary graph of overlap between shows
Effect of time restriction on dyad formation
Where no upper time limit is imposed, the network consists of one large connected component and one isolate for which no common competitors were found in the database (Fig. 4a). Imposing a time restriction, of 14, 10 and 7 days respectively, on dyad formation both increased the number of components and isolates in the network, and decreased the number of shows in the largest connected component (Fig. 4b–d). For no time limit on dyad formation, there is a broadly sigmoidal relationship between the accessible world of individual shows and the date of the show (Fig. 5a), with attendees at shows held early in the season having access to the majority of subsequent shows and those late in the season, having access to only a small number of shows. The relationship is not completely smooth, highlighting the different branches through which shows link into the network and the number of ‘dead-ends’ in the network.
Graphs of the directed networks where an edge occurs from show X to show Y if X and Y share common competitors and (a) X precedes Y; (b) X precedes Y by ⩽14 days; (c) X precedes Y by ⩽10 days; (d) X precedes Y by ⩽7 days. Isolates are not shown. Node size increases according to the number of days after 30 April 2000 that a show occurs.

Relationship between the accessible world for each show and date of show assuming that (a) the infection is not detected; or the infection is detected in all cases in (or the infectious period is equal to) (b) 14 days; (c) 10 days; (d) 7 days.

Imposing a time limit of 14, 10 and 7 days, on the maximum time between attending two shows for infection to be transmitted, decreases the accessible world of shows, increases the number of disconnected components in the network and increases the number of shows that are isolated from all other shows (Fig. 5b–d).
DISCUSSION
Agricultural shows serve an important role in British farming, both as a tool for promoting the quality of home-grown meat to the general public and as a meeting place for farmers to share ideas, gain a sense of pride in their produce and promote their flock [Reference Turner18]. Until now, no information was available on the degree of overlap in competitors between shows. In this paper, I have collated data on attendees at shows to investigate the show-to-show network. This data highlights the large proportion of shows that have common competitors and hence the opportunity for infectious diseases to be spread rapidly through Great Britain via shows during the summer months. No reported outbreaks of disease originating from shows were identified in the literature. However, an epidemiological study would be required to assess whether sheep farms that take sheep to shows have an overall increase in the incidence of infectious diseases or parasite infestations during the summer months.
The presented network is not complete: 66 of the respondents who answered yes to ‘Are sheep shown/present at the show?’ did not provide details of individual entrants; and, a further 145 addressees did not respond to the questionnaire. Non-responders were not followed up. A comprehensive list of agricultural shows in Great Britain is not available and it is likely that a number of shows were not included in the survey and that many of the non-responders were not agricultural shows.
A key question from an epidemiological perspective is whether historic data can be used to parameterize models for emerging disease outbreaks. The temporal and geographic structure of the network appears to be relatively stable with most shows occurring at the same time of year and on the same showground annually. Furthermore, 40% of farmers competed at more than one show suggesting that they are regular competitors. It is likely that the 2001 FMD outbreak has had an impact on the number of shows, in particular small local shows for whom the new legislation may be prohibitively costly, and on the group of individuals who regularly compete at shows. A repeat study would be required to assess the impact of the 2001 FMD outbreak both on the number of shows and attendance at shows and to provide a more accurate picture of the current show-to-show network.
The relationship between the geographical distance between shows and the number of common competitors illustrates the distance over which farmers travel to shows, with shows as far as 600 km apart connected by common competitors. The network for the shows for which data were supplied consisted of one large connected component and one isolate (a show held on an island). It is probable that most of the missing shows would link into the connected component via common competitors.
The spread of infectious diseases through the British sheep population depends on the complete network structure, when all relations that represent a disease risk are incorporated. This work demonstrates the potentially important contribution of ‘attends the same show’ to this network – approximately 20% of all possible pairs of shows shared at least one common competitor with a large proportion of these shows sharing several common competitors. One approach to reducing this contribution would be to artificially break up the network by imposing limits on which shows individuals can attend if they wish to enter multiple shows. The most transparent and practical way of imposing these limits would be to group shows according to geographical location. Indeed comparison of this method with a grouping obtained using a numerical method, based on minimizing the number of inter-group ties, suggests that it is a relatively optimal strategy. Following the 2001 FMD outbreak, a number of alternative strategies for national disease control were suggested including limiting the distance over which animals can be transported [Reference Garner19], however, this is unlikely to break up the show-to-show network due to the close proximity of many shows. Such a strategy might slow down the spatial spread of infectious disease but it is unlikely to prevent disease from spreading throughout the country.
The break up of the network for diseases with a relatively short infectious period suggests that the greatest risk to sheep at a show is exposure to diseases with a long incubation period. Diseases that appear relatively soon after an animal is infected are likely to be identified and treated prior to attending another show. The network data presented here is incomplete, and it is unlikely that the network will fragment as much in reality, thus, a disease with a relatively short incubation period may have a larger accessible world than suggested from the presented data. The impact of a standstill period between shows was relatively ineffective in breaking up the network (data not shown). This is because, of those dyads that were linked, 90% were separated by ⩾8 days and 70% by ⩾20 days. Inclusion of the missing shows may increase the proportion of shows that are linked by short time periods. However, this strategy alone is unlikely to radically reduce the accessible world of the majority of shows since most are linked to more than one other show.
It is important to emphasize that although we have demonstrated the opportunity for disease spread via shows, strict bio-security regulations are designed to reduce the risk of disease spread at shows. New national regulations relating to bio-security at shows were introduced in the aftermath of the 2001 FMD outbreak. These regulations are summarized in the Animal Gatherings Order [Statutory Instrument No. 2004 1202, Welsh Statutory Instrument 2003 No. 1967 (W. 212)] and the Disease Control (Interim Measures) Amendment Order 2003 (Scottish Statutory Instrument 2003 No. 228). The regulations require that all shows must appoint a bio-security officer and provide a contingency plan for the event that an animal is suspected of having a notifiable disease. To reduce the risk of disease spread at shows, the licensee must ensure: that no vehicle enters or leaves the show ground visibly contaminated with animal excreta; inspection of all animals, on arrival, by a veterinary surgeon for signs of notifiable diseases; that facilities are provided for cleansing and disinfection of footwear, protective clothing and livestock vehicles; and hand-washing facilities are available. The licensee must have a contingency plan in place to be implemented in the event that an animal is suspected of having a notifiable disease, and keep a record for 28 days of the name and address of all persons who handle the animals to enable tracing in the event of a suspected notifiable disease. Many shows have additional non-statutory regulations. These may include a requirement to treat sheep with a licensed product for the control of sheep scab within a certain number of days prior to the show; provision of separate areas in the showground for Maedi-Visna accredited sheep; and criteria that all entries must be non-pregnant and not have lambed within 30 days of the show.
Individual entrants are also required to comply with movement regulations under the Disease Control Order [Statutory Instrument 2003 No. 1279, Welsh Statutory Instrument 2003 No. 1966 (W. 211)]. Under these regulations all movements onto a farm trigger a 6-day standstill. However, show animals can claim exemption from this rule provided they have been held in an on-farm DEFRA-approved isolation facility for 6 days before attending the first show. Thereafter they may be moved directly from show to show, or from show to the farm isolation facility to show, without triggering a standstill. An entire holding may be approved as an isolation facility if it meets the separation criteria. All sheep moving to and from a show must be individually identified and their movement recorded in the on-farm movement record book. These rules differ for Scotland with the on-farm standstill set at 13 days.
The regulations focus on the control of notifiable diseases, however, they are unlikely to have an impact on diseases with a long incubation period, such as scrapie, Johne's and Maedi-Visna and may miss the spread of non-notifiable diseases via shows due to a lack of tracing. Ideally show licensees might request both a signed declaration regarding non-notifiable diseases in all animals held on the on-farm isolation unit for the 6 days (or 13 days for Scotland) prior to attendance at a show and notification of any diseases occurring within 28 days of the show so that all other competitors could be notified of disease risk.
There are a number of ways in which the work presented in this paper can be extended. Future work will involve a repeat survey of agricultural shows to provide up-to-date information with which to parameterize mathematical models for disease spread and to assess the stability of the network from year to year. In this paper, the worst-case scenario for disease spread within and between shows was presented, however, there a number of factors that will limit the actual risk of disease spread. Exposure to infectious diseases will depend on the layout of pens and competition rings, disinfection procedures and whether the sheep are penned indoors or outdoors. Individual risk may vary according to a number of factors including: pen location in relation to infected animals; sheep behaviour; health status and stress levels; and prior disease control measures, such as vaccination. A study of showgrounds will be conducted to parameterize a detailed model for the within-show spread of infectious diseases.
The show-to-show network is only one component of the risk-potential network for infectious diseases of sheep and future work will combine this relation with information on other relations, such as attendance at markets. Furthermore, many notifiable diseases cross between farm animal species – a complete analysis of the potential risks of a disease, such as FMD, requires expansion of the network to incorporate these species.
ACKNOWLEDGEMENTS
I am very grateful to all show secretaries who have responded to our requests for information and data. Thanks are also due to members of the scrapie epidemiology group at VLA Weybridge, UK, for their assistance in collating the address list of shows and in entering the preliminary questionnaire data. The data collection in this study was funded by a grant from the Department for the Environment, Food and Rural Affairs (SE0228). Additional work was funded by the Tetra-Laval Research Fund and the Isaac Newton Trust.



