Population ageing is forcing governments to review several social programs, including healthcare and pensions (OECD 2017). In electoral democracies, we may wonder if some of these policy decisions could be driven by changing citizen preferences. In fact, the “greying of democracies” has already been cited in public discourses as an explanation for political outcomes (Glueck and Tavernise Reference Glueck and Tavernise2020). While appealing, we do not know to what extent this explanation relies on verified empirical patterns.
Studying life-cycle trends in support for public spending is important to enrich our discussions about the consequences of demographic change for government budgets. If support for certain programs is more prevalent among seniors, then population ageing could be accompanied with increasing support for some policies and decreasing support for others. The context of population ageing thus stresses the importance of developing a good understanding of life-cycle fluctuations in support for public spending in major budgetary sectors, like healthcare or education, but also in programs that could be constrained in a context of changing budgetary demands, like the arts or public transportation.
Other things being equal, we may expect older people – as compared to younger people – to be more favourable to the status quo in terms of government spending. In fact, studies in political behaviour show that resistance to change increases with age, which could make older people more inclined to maintaining current levels of public spending (Peterson et al. Reference Peterson, Smith and Hibbing2019). On the other hand, one’s interest for specific policy areas could also influence their support for spending in these domains (e.g. Svallfors Reference Svallfors2008). Following this rationale, scholars interested in life-cycle attitudinal changes investigated how the use of certain age-related government services, like education or old-age pensions, could influence support for these policies throughout one’s lifetime. This line of research has been particularly fruitful. Even though political orientations are usually stable over the life cycle (Sears and Funk Reference Sears and Funk1999), research has shown that older people are usually less supportive of education spending (Busemeyer et al. Reference Busemeyer, Goerres and Weschle2009), but more supportive of healthcare and pension spending (Hess et al. Reference Hess, Nauman and Steinkopf2017).
One of the main shortcomings of this area of research, however, is that it remains mostly limited to the study of “age-related spending preferences” (Sørensen Reference Sørensen2013), such as education, healthcare, childcare, and pensions. What about other government services? Can we explain life-cycle changes in support for areas of spending that are not as obviously related to age? This paper presents an attempt to so so by investigating life-cycle changes in individual preferences towards fifteen government portfolios, including not only education, healthcare, childcare and pensions, but others as well, such as defence, transportation, and environment.
While expanding the scope of research on life-cycle public spending preferences, this paper addresses another limitation – this one methodological – of this area of study. Many studies on life-cycle spending preferences rely on datasets covering relatively short periods of time or including few data points. As a consequence, the age gaps found in these articles may be overly sensitive to period effects, or they could be hiding generational differences. To avoid this issue, this paper relies on an original dataset of Canadian cross-sectional surveys collected between 1987 and 2019. For more than thirty years, two survey organizations – Environics and the Canadian Election study Footnote 1 – included consistent measures of attitudes towards government spending in their surveys.
When aggregating respondents’ answers on all policies to create a measure of support towards general government spending, I find that older people are more favourable to maintaining the status quo in terms of spending, and less favourable to increasing spending. These life-cycle effects are not sizable, however: support for “maintaining the same amount of government spending” increases by about 5 percentage points between 25 and 75 years old. In contrast, results presented in this article point to substantial age differences in attitudes towards specific policy domains. Seniors are on average less supportive of state spending in education and the environment, but more so on transportation. Finally, support for elderly services increases with age in the beginning of adulthood, eventually reaches their peak, then decreases.
The main goal of this article is to provide a descriptive outlook on life-cycle fluctuations in support for government spending that is as comprehensive and reliable as possible. By considering a broad set of programs, this article confirms some findings highlighted in previous research, but it also brings important nuances to our understanding of age and public spending preferences. For instance, contrary to what we might expect, findings indicate that support for spending on elderly services is not more widespread among seniors, but rather among middle-aged adults. Results also show that support for many programs, such as justice, does not change significantly with age. Doing so, this article lays ground for future research on age and politics and allows us to extrapolate on the consequences of population ageing for governmental decisions on a wide variety of policy areas.
Support for government spending
Scholars have investigated several explanations to account for individual differences in support for government spending or the welfare state, such as symbolic racism (Krimmel and Rader Reference Krimmel and Rader2017) and gender (Shorrocks and Grasso Reference Shorrocks and Grasso2020). The effect of age on these attitudes has not been entirely overlooked, but this topic of research is gaining significance in the context of population ageing, when many established democracies are experiencing drastic changes to their age structure. These demographic changes revive the interest in topics like age cleavages in vote choice (e.g. Tilley and Evans Reference Tilley and Evans2014) or the influence of representatives’ age on policy output (McClean Reference McClean2019). In this context, studies that center around age are pertinent and should co-exist with studies on generational cleavages because population ageing does not only bring about generational turnover but also an increase in the size of older age groups.
Different theories help to inform expectations about life-cycle changes in support for government spending. On the one hand, we find ideological theory, which argues that ideological orientations and partisanship structure individual preferences for public spending (e.g. Oldendick and Hendren Reference Oldendick and Hendren2018). This theory rests on the idea that preferences for government spending are manifestations of left-right or conservative-liberal orientations in individuals (Jacoby Reference Jacoby1994). In accordance with this view, research has shown that support for welfare spending in the USA was lower among those exhibiting higher levels of symbolic racism (e.g. Goren Reference Goren2008).
According to ideological theory, we should not expect important age gaps in public spending preferences because political orientations such as partisan identification are generally stable over the life cycle (Jennings and Niemi Reference Jennings and Niemi1975). In fact, even though scholars found that people tend to become more conservative or vote for Conservative parties more as they age (Cornelis et al. Reference Cornelis, Van Hiel, Roets and Kossowska2009; Tilley and Evans Reference Tilley and Evans2014), the lifelong persistence of political attitudes remains more generally accepted in the political science literature (Peterson et al. Reference Peterson, Smith and Hibbing2019). Ideological theory would therefore predict very few life-cycle changes in support for government spending.
Another theory that has been used to explain public spending preferences is self-interest theory. This view provides more tools to articulate expectations about the relationship between age and support for government spending. According to self-interest theory, keeping ideology and other factors constant (such as gender and occupation), rational considerations remain important drivers of support for government spending. Assuming that people are aware of the impact government spending has on them, self-interest theory predicts that “people are less likely to favour policies that hurt them financially or where they feel their economic loss does not outweigh the social gains” (Pederson Reference Pederson2014). This means that individuals who need public services more or who feel that services should be improved will be more favourable to increasing government expenditures. In line with this view, evidence has shown that individuals with lower income are more likely to support government spending because they are more likely to use public services than wealthier people (Krimmel and Rader Reference Krimmel and Rader2017).
Self-interest theory also allows for the possibility of changing interests, which explains why scholars who study the effect of age on public spending preferences have naturally been drawn to this theory (Clark et al. Reference Clark, Lambert, Park and Wilcox2009). Age is accompanied with changes in needs, occupation, family structure, material well-being and psychological conditions, among other things (Vlandas Reference Vlandas2018). Following self-interest theory, younger people – as compared to middle-aged adults – should be more favourable to increasing government expenditures because they are more likely to have low income or to use certain public services, like education. Seniors are confronted to similar conditions – for example, their income is often fixed. But should seniors be supportive of increasing government spending, or of maintaining the status quo? Studies in psychology and cognition have confirmed that ageing was associated with less openness to experience and more resistance to change. These “psychological dispositions” in older age could trigger “a preference for familiarity” (Cornelis et al. Reference Cornelis, Van Hiel, Roets and Kossowska2009, p.56 and 72), which suggests that seniors should be more favourable to the status quo in terms of government spending. Finally, self-interest theory predicts that on average, middle-aged adults should be more favourable to decreasing public expenditures (or less supportive of increasing spending) than both younger and older people because increasing spending could be more costly to them as they pay more income taxes. These, of course, are generalizing expectations. Not everyone of the same age has the same needs or relies on the same public services.
Rational considerations also allow us to speculate about the effect of age on support for child- or senior-oriented policies. Education, childcare, and pensions have been largely covered in the literature because of this – and also because of survey data availability. On the one hand, public spending on pensions has been found to be more popular among older people, who are directly concerned by them (de Mello et al. Reference de Mello, Schotte, Tiongson and Winkler2016; Hess, Nauman and Steinkopf Reference Hess, Nauman and Steinkopf2017). On the other hand, younger people have been found to be more supportive of education (Duncombe et al. Reference Duncombe, Robbins and Stonecash2003; Busemeyer et al. Reference Busemeyer, Goerres and Weschle2009; Busemeyer and Lober Reference Busemeyer and Lober2019) and childcare (Goerres and Tepe Reference Goerres and Tepe2010), of which they are the direct beneficiaries. These findings have been nuanced by proponents of a “broader perspective on self-interest” (Busemeyer and Lober Reference Busemeyer and Lober2019, p.4), according to whom expected future use of government services or family motivations are also important rational considerations (Svallfors Reference Svallfors2008). As a matter of fact, individual age-based self-interest and solidarity with younger family members are not always mutually exclusive. Goerres and Tepe (Reference Goerres and Tepe2010) showed that seniors were in general less likely to support public childcare spending, but especially when they did not entertain contacts with children in their family.
Moving beyond age-related policies
Rational considerations could also help explain support for other, non-age-related policies. Healthcare probably is one of the most blatant example. Contrary to education, childcare, and pensions, which are more specifically aimed at certain age groups, healthcare concerns everyone (Sørensen Reference Sørensen2013). In general, though, older people make greater use of healthcare because of declining health. Consequently, older age groups have been found to be more supportive than others towards healthcare spending (Fullerton and Dixon Reference Fullerton and Dixon2010). Another example is environmental spending. Even though individuals do not “make use” of the environment, they still derive benefits from a healthy environment, which should influence their views on environmental spending. In their article on support for environmental expenditures, Geys et al. (Reference Geys, Heggedal and Sørensen2020) argue that younger and older people should both feel less concerned with the long-term benefits of environmental protection. In seniors, this is explained by shorter life spans; in youth, by a tendency of “acting ‘as if there is no tomorrow’ ” (Geys et al. Reference Geys, Heggedal and Sørensen2020, p.2). As a consequence, the authors argue – and demonstrate empirically – that support for environmental expenditures should take an inverted U-shape over the life cycle.
As we turn to other areas of spending, self-interest theory can continue to guide our expectations, but fewer and fewer empirical studies can be cited to support them. As described in the introduction, this paper proposes to widen the scope of research on life-cycle support for government spending. To do so, it analyses life-cycle support towards fifteen policy areas surveyed over a period of 32 years. Some have already been covered in the literature and reviewed here: childcare, education, healthcare, and the environment. Others have not been covered as much: spending on the arts, defence, energy, farmers, job-creation programs, justice, regions, services for the elderly, social services for the poor, transportation, and welfare.
Self-interest theory could explain support for some of these policies too. For instance, support for elderly services should be higher among older people because these services are aimed directly at seniors. In contrast, we may expect attitudes towards job-creation programs to become less favourable with age because seniors are less active on the labour market, as compared to younger people. Finally, self-interest could also explain support for transportation spending. On the one hand, mobility challenges are more frequent among seniors (Statistics Canada 2015), who may see the public provision of transportation services positively. On the other hand, younger adults use roads and public transportation more frequently for work-related travels. Support for transportation spending may therefore increase over the life cycle, but it could also be stable.
When self-interest does not seem to matter
The remaining portfolios (the arts, defence, energy, farmers, justice, regions, social services for the poor, and welfare) are not as easily associated with periods of the life cycle. These areas of public spending do not benefit certain age groups more than others, which takes us away from rational considerations. Support for some of these policies may simply be immutable throughout the lifetime, in other words, be better explained by ideology, values or socialisation. This, I expect, is the case of government spending on energy, farming, regions, the arts, welfare, Footnote 2 and social services for the poor. I have no theoretical reasons to believe that support for these policies changes because of age. Justice and defence, however, are related to one’s sense of safety. Studies in cognition have established that ageing is associated with risk aversion (James et al. Reference James, Boyle, Yu, Han and Bennett2015), which can make individuals more supportive of military policies (Huddy et al. Reference Huddy, Feldman, Taber and Lahav2005) and crime control. I therefore expect support for defence and justice spending to increase with age, not because one makes more “use” of these services, but due to psychological motivations. Indeed, a few cross-sectional studies from Canada (Fitzsimmons et al. Reference Fitzsimmons, Craigie and Bodet2014) and the USA (Simon and Lovrich Reference Simon and Lovrich2010; Cohen et al. Reference Cohen, Rust and Steen2006) confirmed that older people were more supportive of military and crime prevention spending.
Measures
This article introduces new data to draw a comprehensive portrait of public spending support over the life cycle. Between 1987 and 2010, Environics Canada conducted 25 surveys that included the same question: “Keeping in mind that increasing services could increase taxes, do you think the federal government is spending too much, just the right amount, or should be spending more on each of the following: …?" Footnote 3 A similar question was also included in seven Canadian Election Studies (CES) surveys conducted between 2000 and 2019. Footnote 4 A wide variety of policies were concerned by these questions, but the fifteen policies listed in the previous section occurred most often. Footnote 5
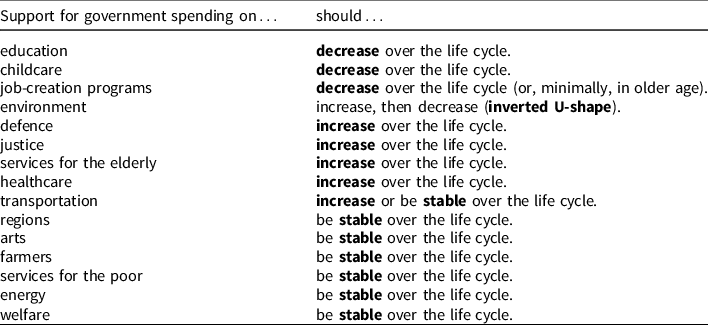
Having access to individual attitudinal measures on such a large variety of policies makes it possible to test various expectations about life-cycle changes in support for government spending. First, we can aggregate individual answers on all policies to verify if older people are more favourable to maintaining “the same amount of government spending”, i.e. if they are generally more reluctant to change. Evidently, aggregate support for these options adds up to 1, so if support for the status quo increases in older age, it should necessarily be accompanied with a decrease in at least one of the two other options. I expect the option of “more spending” to also be more popular among seniors because older people are more dependent on government services than middle-aged adults. Youth should also be less favourable to decreasing public spending (or more favourable to increasing it) given their lower income. Second, these data allow us to test expectations about specific policies, which are summarized in Table 1.
Theoretical expectations about the relationship between age and support for government spending

Pooling the Environics and CES surveys creates a dataset that includes 116,818 individual respondents between 1987 and 2019. Descriptive statistics on all measures are available in the online supplementary materials. Footnote 6 As highlighted previously, these Canadian surveys provide repeated measures that are consistent over time, which justifies their use in this article. Canada is a relevant case for this study also because it is one of the most rapidly ageing democracy (van Bavel and Reher Reference van Bavel and Reher2013), which makes it interesting for studying age gaps in spending preferences. Canada is “a liberal welfare regime in which universal social programs [such as healthcare and pensions] have long played a central role” (Béland et al. Reference Béland, Marchildon and Prince2020, p.125). Considering that context matters for how individuals perceive the role of the state at different stages of their life (see Goerres and Tepe Reference Goerres and Tepe2010), we may not be able to generalize the effects of age found in the Canadian case to all contexts. That said, the closest comparison may be found in other liberal welfare state regimes, like the USA and Australia.
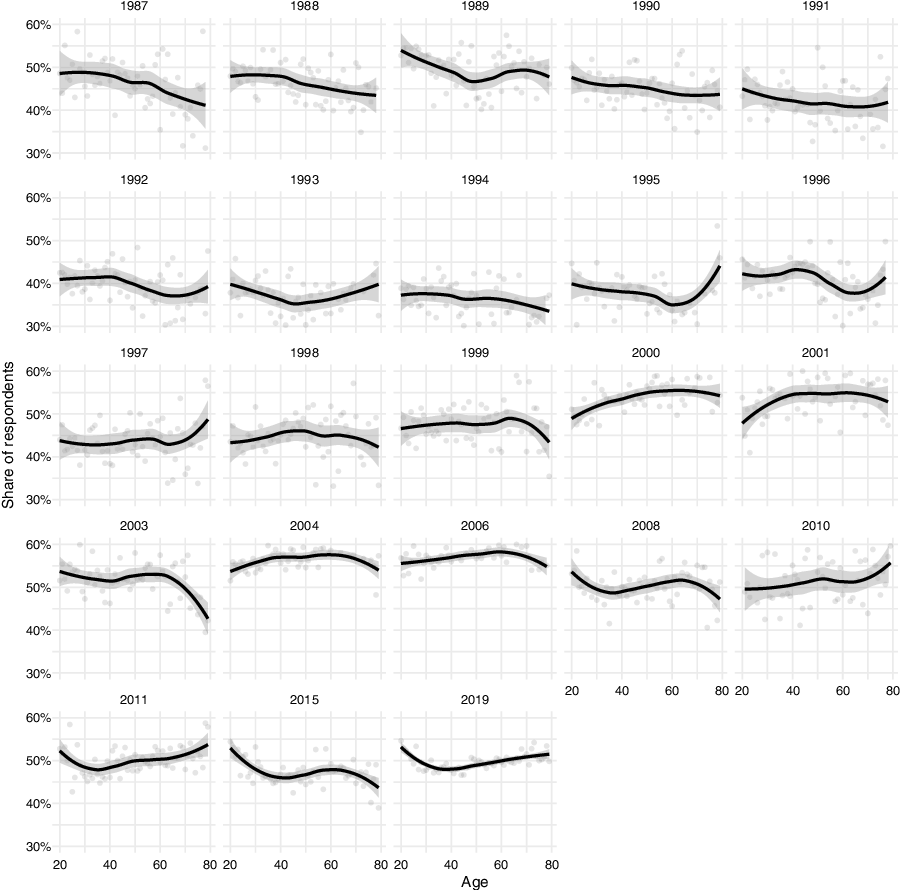
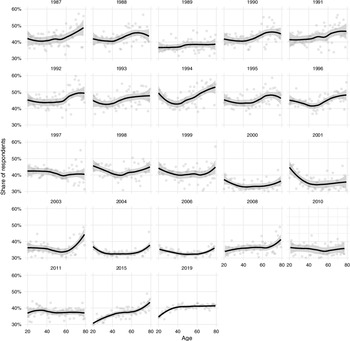
To begin, let us investigate trends in support for each possible answer. To do so, I created two dependent variables: support for more government spending (coded 1, otherwise 0) and support for the same amount of spending (coded 1, otherwise 0). Then, I averaged individual answers on all policies by age. Figures 1 and 2 track these averages in every survey year. Footnote 7 In every year, if we sum the average for “wants more spending” and the average for “wants the same amount of spending”, we obtain a value close to 100%. This is because the third option not shown here – support for less government spending – is much less popular than the two other ones. This last option was never selected by more than 22% of respondents. In contrast, between 1987 and 2019, 26% to 61% of respondents thought the government should be spending more, with the lowest value observed in 1993 and highest value observed in 2008. The “status quo” category largely mirrors this trend, with Canadians being more favourable to the status quo in the early 1990s (maximum = 56% in 1991) but less so since the new millennium (minimum = 30% in 2008).
Share of respondents who want more government spending, according to age.

Share of respondents who want the same amount of government spending, according to age.
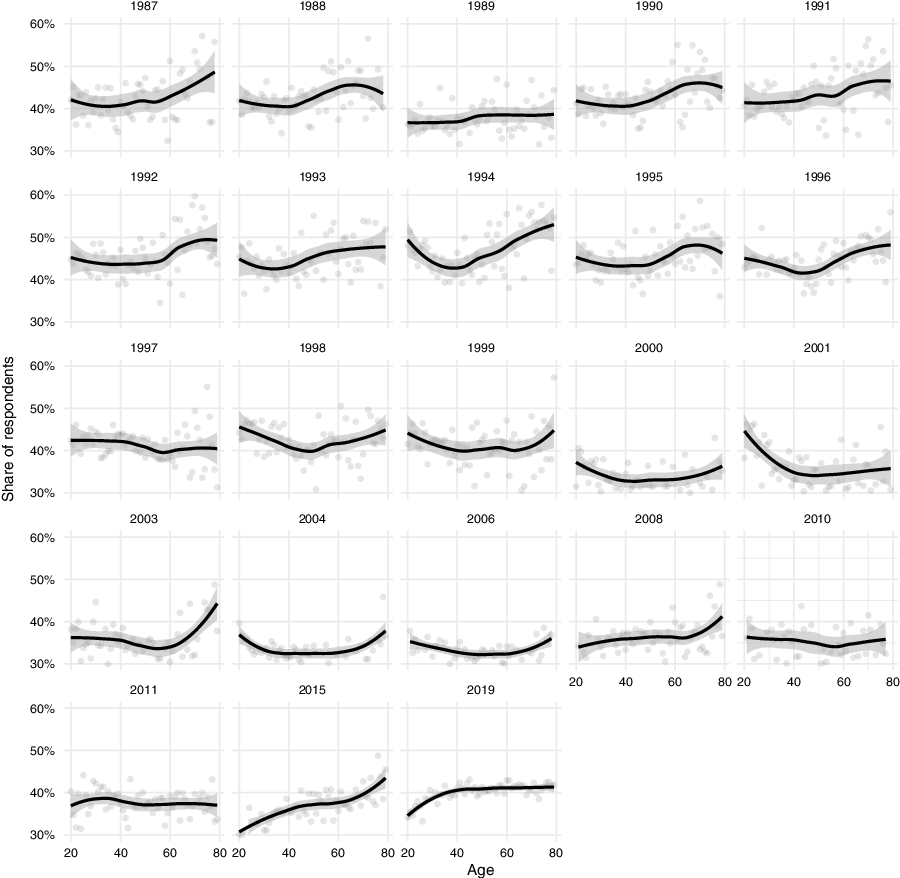
Figures 1 and 2 show that support for the two options is not strongly affected by age. Support for more public spending declines in older age in 2003, but the opposite can be said of in 1995. In 2015, support for the status quo increases by approximately 20 percentage points between 20 and 80 years old, but this trend is absent in other years. We cannot, however, conclude to age effects from eyeballing Figures 1 and 2 only. The presence (or absence) of age differences in these figures could be explained by two factors.
First, they could be explained by cohort effects, or the “socialization experiences [of different generations] which manifest themselves in their belief systems” (Neundorf and Niemi Reference Neundorf and Niemi2014, p.2). At any given point in time, cohort effects are confounded with age: the opinions that prevail in different age groups are not only explained by how old their members are but also by the generation to which they belong. Socialization effects have been confirmed repeatedly in the political behaviour literature (Jennings and Markus Reference Jennings and Markus1984; Neundorf and Soroka Reference Neundorf and Soroka2012; Vallée -Dubois et al. Reference Vallée-Dubois, Dassonneville and Godbout2020). For example, evidence has shown that “coming of age under sustained periods of Conservative governments” leads to the development of more conservative political values (Grasso et al. Reference Grasso, Farrall, Gray, Hay and Jennings2017, p.17). Second, period effects could also be at play in Figures 1 and 2. Period effects are defined as the influence of current events (a recession, terrorist attacks, etc.) on issue attitudes (Neundorf and Niemi Reference Neundorf and Niemi2014). For example, in the 1990s, the Canadian government recorded important deficits, which appeared to have an impact on public opinion towards public spending: there was, during this period, a decline in support for government spending across all age groups.
Many studies on age and spending preferences rely on a few data points, usually between one and five, to test their expectations (Busemeyer et al. Reference Busemeyer, Goerres and Weschle2009; Busemeyer and Lober Reference Busemeyer and Lober2019; Cattaneo and Wolter Reference Cattaneo and Wolter2009; de Mello et al. Reference de Mello, Schotte, Tiongson and Winkler2016; Duncombe et al. Reference Duncombe, Robbins and Stonecash2003; Goerres and Tepe Reference Goerres and Tepe2010; Hess et al. Reference Hess, Nauman and Steinkopf2017; Rhodebeck Reference Rhodebeck1993; Sørensen Reference Sørensen2013; Street and Cossman Reference Street and Cossman2006; Svallfors Reference Svallfors2008; Wilkoszewski Reference Wilkoszewski2009). The age gaps presented in these analyses therefore run higher risk of being confounded with generational or period effects. Two studies from the American context rely on more data points and longer time periods: Fullerton and Dixon’s study (Reference Fullerton and Dixon2010) presents evidence from 17 surveys conducted over a 22-year period, and Plutzer and Berkman’s article (Reference Plutzer and Berkman2005) presents data from “dozens” of surveys over a 35-year period. Estimations of age effects in these studies are likely to be more robust, but the two of them only cover a total of three policies (education, health, and social security).
Identification strategy
While making it possible to study a wider range of policies, the data introduced in this paper include long-term and recurring attitudinal measures. As a matter of fact, to capture the effect of age on issue attitudes, one needs to phase out cohort and period effects. Theoretically, to do so one would have to compare the policy preferences of a 30 year old with the preferences of a 60 year old, had they both been socialized at the same time. This counterfactual is, of course, impossible to observe. A reasonable approach would be to follow the same individual throughout their lifetime, and then to control for time periods in the analysis. This approach is impractical in the present case because the data available to us are not panel data but cross-sectional – they cover different individuals in different time periods.
When relying on cross-sectional data, one needs to “control” for birth years and periods to be able to estimate the effect of age on political attitudes. But when doing so, one faces an important methodological challenge: age, birth year, and survey year are perfectly linearly correlated (Age = Survey year – Birth year). Including these three variables in the same regression model would make it impossible to estimate each parameter (Smets and Neundorf Reference Smets and Neundorf2014). To circumvent this issue, scholars have come up with different solutions, such as proxy models, fixed-effects models, and hierarchical age-period-cohort models (Yang and Land Reference Yang and Land2006), all relying on a different set of assumptions (Bell Reference Bell2019).
On the one hand, we can make the strong assumption that one of the effects (either age, period or cohort) is flat, and to exclude this factor from the equation altogether (Neundorf and Niemi Reference Neundorf and Niemi2014; Bell Reference Bell2019). This is not something we can easily do here because we have theoretical reasons to believe that members of certain birth cohorts have different opinions on government spending due to their socialization. We also have reasons to believe that the political and economic circumstances can have an influence on attitudes towards government spending. We therefore cannot remove any one of these effects from the analysis.
The alternative is to make the not-so-strong assumption that some individuals can be pooled within age groups, periods, or birth cohorts. If only one of these factors was treated as categorical instead of linear in the model, we would be able to estimate all coefficients. When making this assumption, however, Bell (Reference Bell2019) warns us to be transparent and to create groupings based on theory. In the case before us, it is reasonable to group individuals together within birth cohorts. Indeed, as explained previously, studies in political behaviour confirm that “impressionable years” can influence the formation of political opinions. Individuals of the same cohort – who have lived through the same formative experiences as adolescents and young adults – are therefore more likely to have similar opinions on political questions (Neundorf and Niemi Reference Neundorf and Niemi2014). Pooling individuals within birth cohorts makes sense theoretically.
To define birth cohorts, I begin by identifying impressionable periods of the last century in Canada, or “key period[s] during which citizens form the basis of political attitudes and behaviors” (Smets and Neundorf Reference Smets and Neundorf2014). Young people experiencing major events together will share similar political orientations over the lifespan. Critical political years of the last century in Canada include the Great Depression of 1929, the end of the Second World War in 1945, the economic crisis beginning in 1973, the fall of the Soviet Union in 1992, and the 9/11 terrorist attacks in the USA. I removed 18 years from each of these moments, assuming that individuals who were about 18 years old when these events occurred have been influenced by them when forming political opinions. This allowed for the identification of six birth cohorts: people born before 1912, between 1912–1927, between 1928–1955, between 1956–1974, between 1975–1983, and people born in 1984 or more.
Estimating support for government spending
To introduce this identification strategy, I begin by estimating ordinary least squares regressions with two different dependent variables. First, I use individual support for more public spending. This variable is obtained by coding support for more spending on every policy as 1 in the dataset (otherwise, 0), then averaging answers on all issues across individuals. Second, I follow the same process to create a variable of individual support for the same level of public spending. The third option (support for less government spending) is the inverse of the two other options. If support for the status quo decreases over the life cycle and support for more spending increases at the same rate, it necessarily means that support for less spending is stable over the life cycle. It is therefore unnecessary to report all three options. I also decided not to report support for less spending because this option is generally the less popular of all three.
I add birth cohorts as dummy variables in the models, along with the linear terms of survey year and age. I also add a quadratic age term to account for potential curvilinear relationships between age and support for government spending. Models control for gender, income, education level, religiosity, employment, marital status, and vote intention. Footnote 8
In order to estimate support for government spending on each of the fifteen policy areas introduced previously, I estimate ordinary least squares regression models with support for more (coded 1, otherwise 0) or the same amount (coded 1, otherwise 0) of government spending on each of the fifteen policies as dependent variables. Age (linear and squared) is the main explanatory variable in all models. Footnote 9 Again, models include birth cohorts and year of survey, as well as controls for gender, income, education level, religiosity, employment, marital status, and vote intention. Footnote 10
Results
Support for government spending
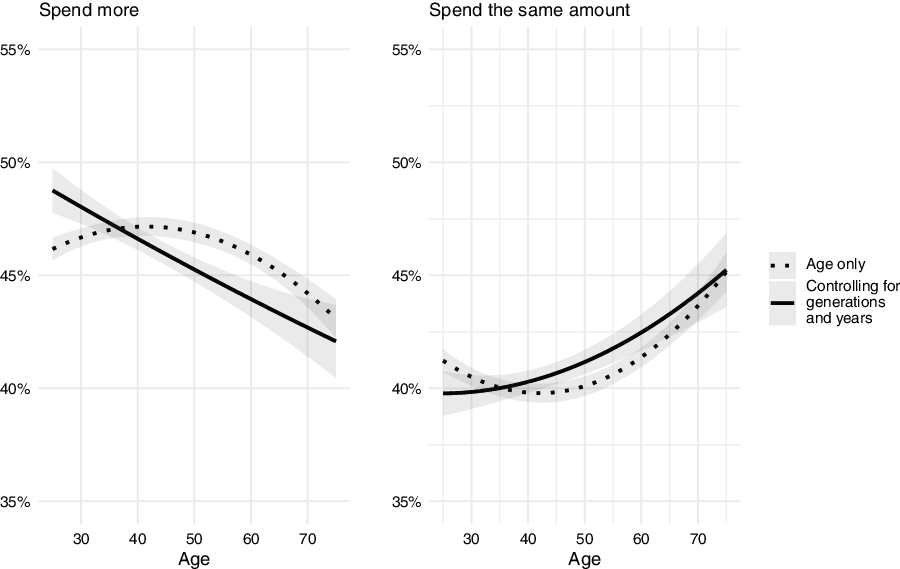
The first set of results are visualized in Figure 3, which presents predicted probabilities derived from the models estimating support for more spending on all policies averaged together. The dotted line represents a model that only includes the independent variable of age along with its quadratic component, age-squared (and all other demographic controls). The solid line represents a model that controls for birth cohorts and year of survey. Footnote 11 Complete regression results are available in the online supplementary materials.
Predicted probability of supporting more/the same amount of government spending according to age.
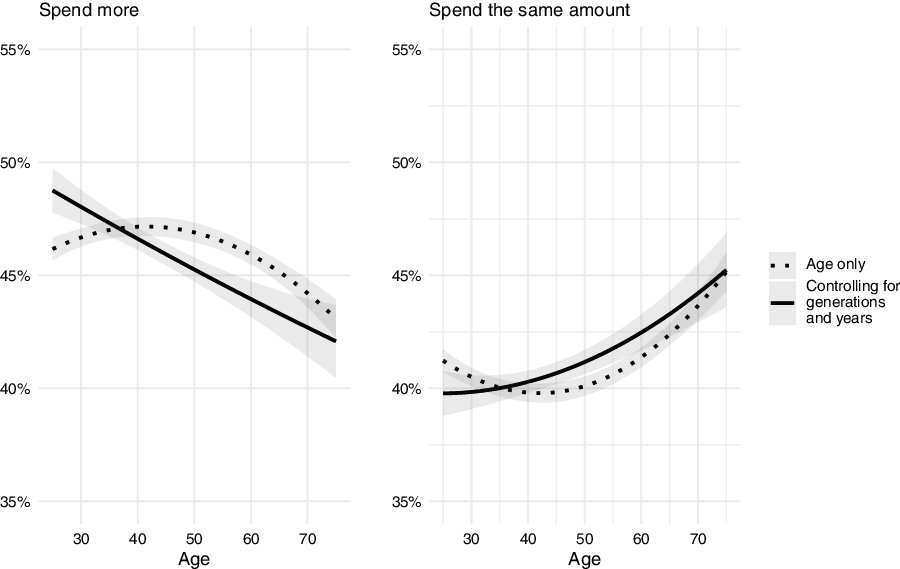
Controlling for birth cohorts and periods is important when estimating the effect of age on support for these two options. When not doing so, the age trend is curvilinear. But when accounting for birth cohorts and survey years, support for more public spending declines over the life cycle (left-hand plot). The estimation of life-cycle trends in support for the status quo is also, but less so, affected by the inclusion of survey years and birth cohorts in the analysis. The option of the status quo is somewhat less popular among younger people than seniors (right-hand plot). Keeping constant birth cohorts, periods, and other individual determinants like vote choice, support for the same amount of government spending increases by approximately 5 points between 25 and 75 years old (p < .05).
In short, in accordance with theory, becoming older is associated with greater support for the status quo, but this effect is small. A 5-point change in preferences over 50 years of age is negligible. This increases seems to come at the expense of the option of “more spending”, but again, the decline in support for this option is not large (about 7 points over 50 years of age). In other words, when aggregating opinions over a large set of issues, we find that seniors are somewhat more supportive of the status quo when it comes to government spending and less supportive of increasing government spending.
Life-cycle support for spending on fifteen policies
Averaging individual answers together may hide variation across programs. Does age strengthen support for government spending on some policies, such as defence and justice, while depressing support for other programs, like education and childcare?
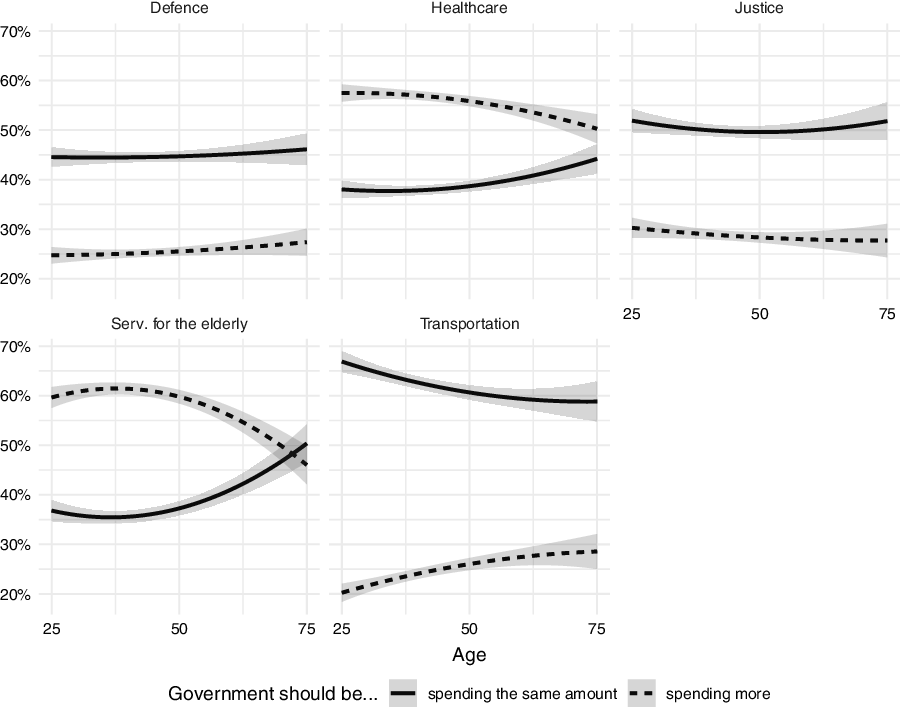
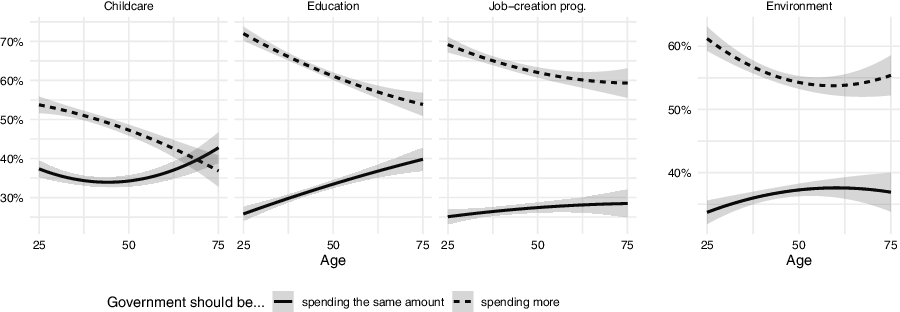
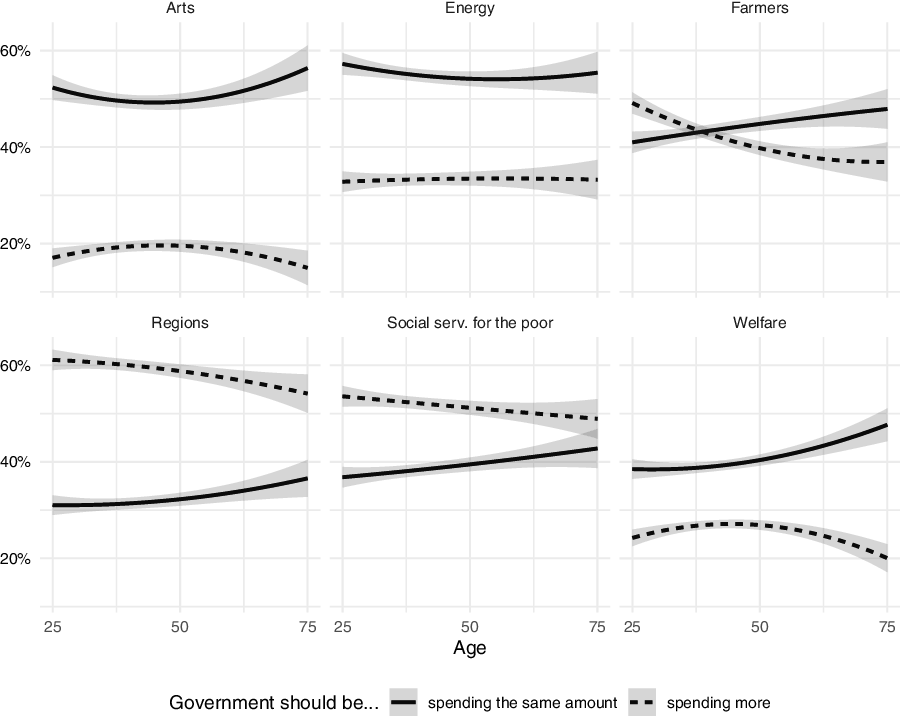
Results from the thirty regressions (15 policies, times 2 models) estimating the effect of age on support for government spending on each policy domain can be found in the online supplementary materials; but in the spirit of conciseness, results are reported in Figures 4 to 6. The figures plot the probability of supporting more or the same amount of government spending between 25 and 75 years old. Younger (less than 25 years old) and older (more than 75 years old) ages are excluded from the plots because lower number of respondents of these ages make for less precise predictions. Footnote 12 Policies for which I expected increasing support over the life cycle are presented in Figure 4; policies for which I expected decreasing support or an inverted U-shape over the life cycle are presented in Figure 5; and policies for which I expected no change over the life cycle are presented in Figure 6. Footnote 13
Predicted probability of supporting more/the same amount of government spending according to age. Expectation: Increasing support over the life cycle.
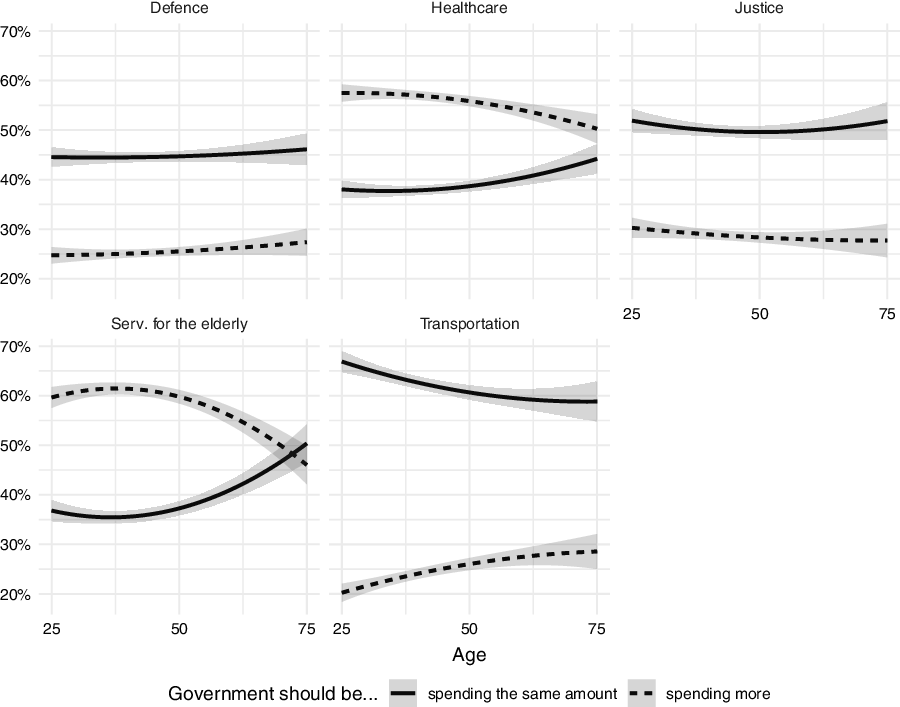
Predicted probability of supporting more/the same amount of government spending according to age. Expectation: Decreasing support over the life cycle (first three policies) or curvilinear shape over the life cycle (environment).

Predicted probability of supporting more/the same amount of government spending according to age. Expectation: Stable over the life cycle.

Three main findings can be drawn from the analyses. First, seven of the fifteen policies are in accordance with theoretical expectations. On the one hand, support for more spending in transportation increases over the life cycle (Figure 4). This happens at a decreasing rate and is accompanied with a decline in the option of “the same amount of” spending. On the contrary, older people are less likely to say they want more public spending in education, childcare, and job-creation programs. As expected by the theory, support for more spending in education decreases over the life cycle. It does so at a decreasing rate. This change is accompanied with a weaker (but still significant) increase in support for the same amount of spending on education. Support for more spending on childcare and job-creation programs decline with age, but these effects are weaker than for education, and the childcare finding is not statistically significant at the p < .05 level. Note also that while support for more spending on childcare decreases with age, support for the status quo takes a U-shape. This is consistent with a broader interpretation of self-interest: when they start having grandchildren, older individuals continue to be less supportive of an increase in childcare spending than younger people, but they begin to support the option of the status quo more. Finally, in line with hypotheses, there are no substantial differences between age groups when it comes to public spending on energy, regions, and services for the poor (Figure 6).
Second, five policies – justice, military, healthcare, elderly services, and the environment – are in contradiction with theoretical expectations. Support for justice and defence spending were expected to increase over the life cycle because of higher prevalence of risk aversion among seniors, but evidence suggests that support for these programs does not differ across age groups (Figure 4). The same conclusion can be drawn for healthcare (Figure 4). Support for more spending on healthcare seems to decline over the life cycle, but effects are actually weak and insignificant. This could be explained by the fact that Canadians are generally consensual about their healthcare system (Nadeau et al. Reference Nadeau, Bélanger, Pétry, Soroka and Maioni2014), thus alleviating age effects.
The life-cycle trend in support for elderly services takes an inverted U-shape shape, which was unexpected (Figure 4). Support for more public spending on these services increases in younger age, then decreases. Middle-aged people are at a point in their life where they plan for retirement and are often required to take care of ageing family members. This could explain why they are more favourable to broadening public coverage of elderly services than any other age group.
Support for more spending on the environment decreases in younger age, then stabilizes (Figure 5). Footnote 14 This shape is inconsistent with what Geys et al. found in their 2020 paper. Their analysis showed that support for environment spending was weaker in younger and older adults and higher in middle-aged people (inverted U-shape). The difference between these findings and the results presented in this paper could be explained by the fact that the survey question used in Geys et al.’s article explicitly tells respondents that their standard of living could be considerably affected by environmental protection. Geys and his colleagues argue that young people and seniors discount the future more, so priming respondents about long-term consequences may explain the inverted U-shape found in their analysis, in comparison with what is found here, i.e. a declining trend between youth and middle age.
Third, three policies for which we expected no age effects exhibit surprising life-cycle trends. These are the portfolios of welfare, the arts, and farmers (Figure 6). These effects are milder than others introduced previously, so they should be interpreted with greater care. That said, findings indicate that younger and older adults, as compared to middle-aged adults, would like to see more spending in the arts, and are less supportive of the status quo in this sector. Moreover, when compared to youth, older adults are less supportive of increasing farming expenditures. Support for welfare, like services for the elderly, increases slightly in younger age, then decreases.
What does it mean?
The presentation of many results for a large number of different policies may be difficult to digest. Let us summarize. First, support for education spending decreases over the life cycle. Second, support for transportation spending increases with age. Third, support for elderly services follows a curvilinear trend (inverted U-shape) over the life cycle. Fourth, support for environmental spending declines during the first portion of life, then stabilizes. These trends presented over 50 years of one’s lifetime may seem unrealistic because several of the birth cohorts found in our sample do not include respondents of 25 to 75 years old. For instance, the 1928–1955 cohort includes respondents between 32 and 91 years old and the 1956–1974 birth cohort includes respondents between 18 and 63 years old. These are the two cohorts for which we have the largest age ranges. Restricting effects to ages that truly “exist” in the dataset, what is a more realistic change in support for these policy domains as one becomes older? In other words, how does a 10- or 20-year increase in age influence support for these policies?
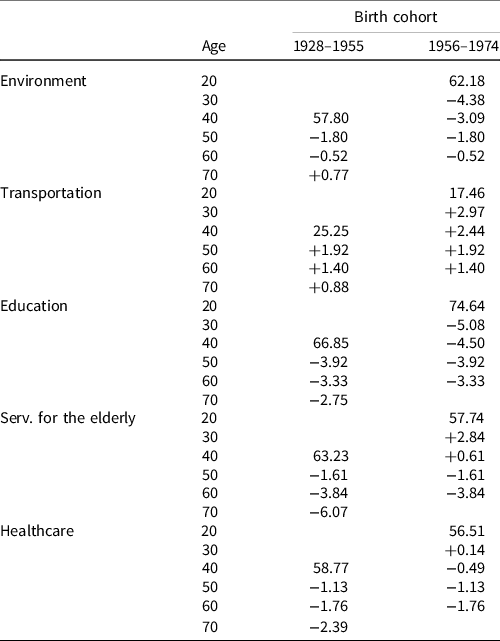
Table 2 reports probabilities of supporting more government spending in five policy areas, according to age, for two birth cohorts. Footnote 15 The initial value in each column is the predicted level of support for the corresponding age. For example, the probability of supporting more spending on the environment is estimated at 58% among 40-year-old members of the 1928–1955 cohort. Other values (preceded by a plus or minus sign) indicate incremental increases or decreases in the previous probability. Support for environmental spending among members of the 1928–1955 cohort thus decreases by 1.8 point between 40 and 50 years old, .5 point between 50 and 60 years old, and so one and so forth. Four of the policies included in the table – environment, transportation, education and elderly services – are programs for which we found substantively important and statistically significant effects of age. The last one, healthcare, is used to illustrate a policy where age effects are weaker.
Probability of supporting more public spending, according to age
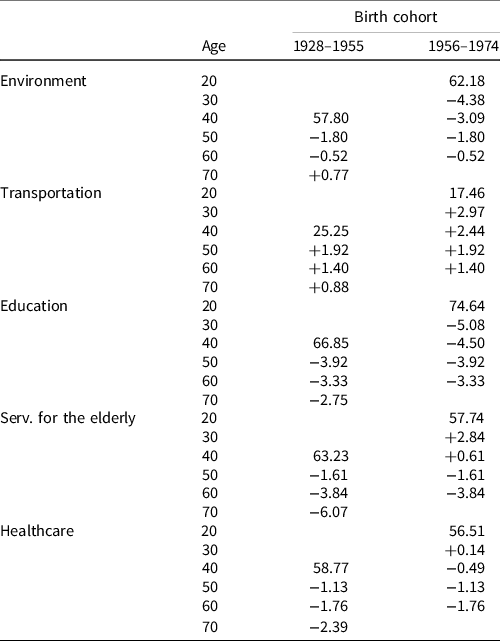
Note how support for more environmental expenditures shrinks over the life cycle, but at a declining rate. Twenty-year-old members of the 1956–1974 birth cohort have a 62% likelihood of supporting more environmental spending. By 60 years old, this probability is down by 9.8 percentage points, meaning that only one in two 60-year-old members of this same cohort would like the government to increase environmental spending. Recall that this finding was obtained after controlling for birth cohorts. Models also control for vote intention, so results cannot be driven by differences in party preferences in younger versus older age.
In the case of transportation, increments also decrease over the life cycle. The probability of supporting more spending on transportation is predicted at 17% among 20-year-old members of the 1956–1974 cohort and at 26% among 60-year-old members of the same cohort. Mobility issues are becoming more salient with population ageing. The fact that older individuals are more favourable to public investments in transportation may be an indication of more widespread support for public transportation in the future.
In education, the pattern is reversed and more striking. Keeping everything else constant, the probability of supporting more government spending in education is estimated at 67% among 40-year-old members of the 1928–1955 cohort, but 57% among 70-year-old members of the same cohort, a 10-point decline over 30 years. Education is the second largest government portfolio of most provincial governments in Canada, after healthcare (Statistics Canada 2019). Among Canadians in their twenties, support for education spending is higher than support for any other policy, including healthcare. Among 60- to 70-year-old Canadians, however, support for the option of more education spending is almost the same as support for healthcare and elderly services. Education is the policy for which we find the largest decline in support over the life cycle.
Contrary to what we might expect, the decline in support for this “youth” policy does not translate into comparable increases in support for government expenditures in elderly services (or healthcare by that matter). Spending on elderly services is more popular among middle-aged than young Canadians: 40-year-old members of the 1956–1974 birth cohort have a 61% likelihood of supporting more spending on these programs. But as one reaches 50 years old, support for spending in elderly services has already started to decline – by 5.5 points between 40 and 60 years old. A similar trend can be found in healthcare, but in this case, support does not decline as quickly – by 3 points between 40 and 60 years old. Plus, in younger adults, support for more spending on healthcare does not change as much as support for elderly services.
Conclusion
In the context of population ageing, it becomes critical to know how age groups differ in terms of public spending preferences. Using an original dataset measuring opinions towards fifteen policies over thirty-two years in Canada, this article broadens our knowledge of the influence of age on support for governmental expenditures. The evidence presented in this paper suggests that in the aggregate, support for government spending changes minimally over the life cycle, with seniors being slightly more favourable of the status quo in terms of public spending, and less so of increasing spending.
In contrast, becoming older influences attitudes towards key governmental portfolios. First, consistent with previous research (e.g. Goerres and Tepe Reference Goerres and Tepe2010; Sørensen Reference Sørensen2013), results show that support for government expenditures in education decreases substantially with age. In fact, this decline is the largest life-cycle change that could be identified. The goal of this paper is not to make predictions about future aggregate public opinion, but it would be interesting to carry on studying this pattern as the population continues to age.
Second, findings suggest that support for environmental expenditures declines with age, but at a decreasing rate. Environmental issues are more salient today than only a few decades ago. These age cleavages could therefore change with time. In fact, additional models presented in the online supplementary materials indicate that young groups of Liberals are more supportive of environmental spending than young Conservatives. Put differently, younger cohorts appear to be divided along partisan lines when it comes to environmental spending, but older cohorts not so much. As young cohorts grow older, the age effect that we find today may be replaced by partisan divisions. Future research could help investigate this phenomenon.
Third, this article finds that transportation spending is more popular among seniors. Public transportation is at the centre of many important questions in relation with population ageing. Cities, which are in part responsible for transportation investments, increasingly need to review their infrastructures to make them accessible to residents and visitors of all ages (e.g. Plouffe Reference Plouffe2013; Van Hoof et al. Reference Van Hoof, Kazak, Perek-Białas and Peek2018). The finding that public transportation spending is more popular in older age is consistent with this new reality.
Finally, findings indicate that adults in their forties are more supportive of public investments in elderly services than other age groups. Again, this result is important in the current context of changing demographics. As the more sizeable generations – like baby boomers – continue to age, we could see an increase in overall support for public spending on elderly services, not because seniors are more supportive of this policy area, but because younger age groups are.
These results help to confirm that policy preferences are not always settled following the “impressionable years” of adolescence and early adulthood. Even though conservatism is only slightly more prevalent in older age (Peterson et al. Reference Peterson, Smith and Hibbing2019) and party identification usually remains stable over the life cycle (Sears and Funk Reference Sears and Funk1999), the evidence presented in this article shows that age can influence attitudes towards public spending. When interpreting these results, one should be careful not to assume that life-cycle trends in public spending preferences are the same across all individuals, or that seniors cannot be influenced by more grand preoccupations – like solidarity with younger family members – when forming opinions on welfare spending (e.g. Goerres and Tepe Reference Goerres and Tepe2010).
Some might worry about the generalisability of these results, considering that they rely on the Canadian case only. The national context cannot be ignored when analysing citizens’ attitudes towards the welfare state. For instance, the null result obtained in the case of healthcare could be explained by the fact that this policy can be characterised as a valence issue in Canada (Nadeau et al. Reference Nadeau, Bélanger, Pétry, Soroka and Maioni2014). Indeed, unlike citizens of the USA, who are highly divided on the best way to manage healthcare, consensus is stronger in Canada when it comes the this issue. In other words, the national context can help make sense of these results. It is important to note, however, that the findings presented in this article are overall consistent with empirical studies conducted in other countries. One of the strongest effects presented in this article – the observation that support for education spending declines significantly over the life course – is in line with existing comparative research (Busemeyer et al. Reference Busemeyer, Goerres and Weschle2009).
To conclude, the analyses presented in this article help to advance our understanding of age and individual support for government spending. In doing so, this paper raises new questions about the future of public opinion towards the welfare state. One of the questions that remain open is whether individual-level age trends in public spending preferences could translate into age cleavages in party support. Further research could help answer this puzzle and several others in the field of age and politics.
Supplementary material
To view supplementary material for this article, please visit https://doi.org/10.1017/S0143814X23000065
Data availability statement
Replication materials are available in the Journal of Public Policy Dataverse at https://doi.org/10.7910/DVN/SZWDDD
Acknowledgement
This project was funded by the Social Sciences and Humanities Research Council of Canada. I would like to thank participants in the 2020 Leuven-Montreal Winter School on Elections for their input on this project. I would also like to acknowledge the contribution of the Canada Research Chair in Electoral Democracy and the Center for the Study of Democratic Citizenship, which provided funding for this project.