I. INTRODUCTION
Thermal management is a significant issue for many devices or systems because of the increasing volumetric power density they experience. The conventional passive cooling techniques are often inadequate for high rates of heat dissipation, and hence, active cooling techniques need to be used. Open-cell porous metals have excellent thermal conductivity, large specific surface area, and good permeability,Reference Sertkaya, Altinisik and Dincer1–Reference Zhao, Lu and Tassou3 making them good candidates for use in active cooling devices, such as heat exchangers and heat sinks.
The heat transfer performance of a number of commercial porous metals has been studied. Jiang et al.Reference Jiang, Li, Lu, Yu and Ren4 reported that particle-sintered bronze samples with porosities from 40 to 46% enhanced the heat transfer performance up to 15 times for water and up to 30 times for air in comparison with an empty channel. Porous copper samples with high porosities from 88 to 94% enhanced the heat transfer performance by about 17 times in comparison with an empty channel.Reference Zhao, Kim, Lu and Hodson5,Reference Zhang, Pinjala, Wong and Joshi6 Boomsma et al.Reference Boomsma, Poulikakos and Zwick7 conducted an experimental study on 6101-T6 aluminum foams with porosities from 60.8 to 88.2% and found that the thermal resistance of the foams was up to three times lower than that of commercially available heat exchangers under the same pumping power. These studies were conducted either on sintered metals with porosities lower than 50% or on metal foams manufactured by the investment casting method, which have high porosities between 87% and 97%. The high-porosity foams were sometimes compressed to reduce porosity.Reference Boomsma, Poulikakos and Zwick7 However, very little research has been conducted on the porous metals manufactured by the space-holder methods, which typically have porosities in the range of 50–85%. In addition, all these studies were conducted on porous metals with homogeneous structures. There is very little work reported in the literature on inhomogeneous or multilayer structures.
The lost carbonate sintering (LCS) processReference Zhao, Fung, Zhang and Zhang8 is a powder metallurgy route method widely used to fabricate porous metals with highly controllable structures, including porosity, pore size, and pore shape.Reference Zhao, Fung, Zhang and Zhang8–Reference Parvanian and Panjepour12 It is particularly attractive for fabricating porous metals for heat transfer applications because of their ability of creating gradient or layered structures. Zhang et al.Reference Zhang, Mullen, Lynn, Zhao, Brechet, Embury and Onck13 investigated the heat transfer performance of LCS porous copper with different porosities and pore sizes and found that porous copper could increase the heat transfer coefficient by 2–3 times compared with the empty channel and up to 100% compared with particle-sintered copper. However, the measurement setup used in their work had an axial–radial or impingement flow configuration, which makes it difficult to compare their results with theoretical models and the results obtained by other researchers. In addition, they only studied homogeneous structures. Therefore, there is a need to investigate into the heat transfer performance of hybrid and gradient structures.
In this paper, porous copper samples of a single layer with specific porosity and of double layers with two different porosities were fabricated by LCS. The heat transfer coefficients of the samples, at a fixed input heat flux, were measured under one-dimensional flow conditions at different water flow rates. A segment model was developed to characterize the double-layer samples.
II. EXPERIMENTAL
Totally ten porous copper samples were fabricated by the LCS method. The raw materials were commercially pure (99.9%) copper powder (Ecka Granules Metal Powder Ltd., Wednesdbury, UK) with a particle size range of 75–150 μm, and food grade potassium carbonate powder (E&E Ltd., Melbourne, Australia) with a size range of 425–710 μm. Six samples have a single homogeneous layer, with different porosities, and were fabricated by the standard procedure described in Ref. Reference Zhao, Fung, Zhang and Zhang8. Four samples have a double layer structure with different layer thicknesses. Both layers are homogeneous; one has a nominal porosity of 60% and the other 80%. The fabrication procedure for the double-layer samples was slightly modified. In the compaction stage, the powder mixture for the 60% layer was first compacted in the mold. Subsequently, the powder mixture for the 80% layer was added in the mold and compacted. The compaction pressure used in this experiment was 200 MPa. All green compacts were sintered at 850 °C for 2 h and then further sintered at 950 °C for 2 h to remove potassium carbonate and to improve the strength.
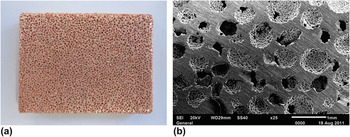
Figure 1 shows the macroscopic and microscopic photographs of a typical porous copper sample produced by the LCS method. All samples have nearly spherical pores in the size range of 425–710 μm, which replicated the potassium carbonate powder used. The pores are randomly distributed, resulting in a macroscopically homogeneous structure.
Macroscopic and microscopic photographs of a typical porous copper sample fabricated by the LCS method.

Table I lists the structural parameters of the samples. All samples had a thickness of 5 mm. For the double-layer samples (S7–S10), the first and second values show the thicknesses of the high-porosity and low-porosity layers, respectively. The actual porosity is the overall porosity of the whole sample and was measured by the Archimedes method.
Porosity and structural parameters of porous copper samples.

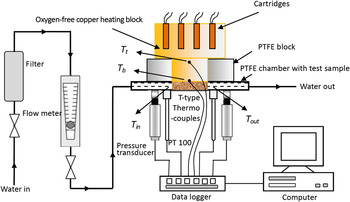
A purpose-built apparatus, as shown schematically in Fig. 2, was used for the permeability and heat transfer coefficient measurements. Water was used as the coolant and flowed in succession through (1) a filter, (2) a flowmeter (FL50001A, Omega Engineering Ltd., Manchester, UK, flow rate range of 0.1–1 LPM with a ±5% full scale accuracy) to measure the flow rate, (3) a pressure transducer (PXL 219-004GI, Omega Engineering Ltd., Manchester, UK, pressure range of 0–4 bar with a ±0.25% full scale accuracy) to measure the inlet pressure, (4) a thermometer (PT 100, Omega Engineering Ltd., Manchester, UK, with a high accuracy of ±0.1 °C) to measure the inlet water temperature, (5) the porous copper sample housed in the sealed camber, (6) another thermometer (PT 100) to measure the outlet water temperature, and (7) another pressure transducer (PXM219-001G, Omega Engineering Ltd., Manchester, UK, pressure range of 0–1 bar with a ±0.25% full scale accuracy) to measure the outlet pressure. The sample chamber was made of polytetrafluroethylene (PTFE) to minimize heat loss. The flow channel was 20 mm wide and 5 mm high. All samples were cut to 30 × 20 × 5 mm to closely fit into the channel.
Schematic diagram of the experimental apparatus for permeability and heat transfer coefficient measurements.

Pressure drop across the porous sample at different water flow rates from 0.2 to 1.0 L/min was measured at room temperature without a heat source. The permeability was determined from Darcy’s law,
 $${{\Delta P} \over L} = {{\rm{\mu }} \over K}v\quad ,$$
where ΔP is the pressure drop across the sample, L is the length of the sample, μ is the viscosity of water (0.001 Pa s at 20 °C), and v is the Darcian velocity, which was obtained by dividing the volume flow rate of water by the cross-sectional area of the sample perpendicular to the water flow direction (1 × 10⁻⁴ m2 in our test).
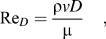
The Reynolds number based on the pore size was calculated by
 $${{\mathop{\rm Re}\nolimits} _D} = {{{\rm{\rho }}vD} \over {\rm{\mu }}}\quad ,$$
where ρ is the density of the fluid (1000 kg/m3 at 20 °C) and D is the average diameter of the pores (567.5 μm).
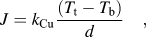
For heat transfer coefficient measurements, the heat flow was produced by an oxygen-free copper heat block imbedded with four heat cartridges. The lower part of the heat block has the same cross-section as the porous copper sample (30 × 20 mm) and was pressed tightly against the sample to achieve a good thermal contact. After the steady state condition was reached, the temperatures of the top and bottom spots of the lower part of the heat block were measured by T-type thermocouples with a high accuracy of ±0.1 °C. The heat flux to the sample was equal to the heat flux through the lower part of the heat block and was calculated by
 $$J = {k_{{\rm{Cu}}}}{{({T_{\rm{t}}} - {T_{\rm{b}}})} \over d}\quad ,$$
where k Cu is the thermal conductivity of oxygen-free copper (390 W/m K), T t and T b are the temperatures of the top and bottom spots, respectively, and d is the distance between the two spots (0.03 m). The heat flux was maintained at around 250 kW/m2, with a deviation of 4.6%.
The overall heat transfer coefficient of the cooling system, comprising the porous copper sample and the water flow, was determined by
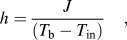 $$h = {J \over {({T_{\rm{b}}} - {T_{{\rm{in}}}})}}\quad ,$$
where T in is the temperature of inlet water. The overall uncertainty of the heat transfer coefficient was assessed using the method in Ref. Reference Moffat14 and was estimated to be 2.3%.
III. RESULTS
A. Permeability
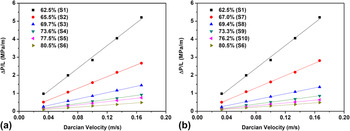
Figure 3 shows the pressure gradients across the sample as a function of Darcian velocity for samples with different porosities. The pressure gradient has a linear relationship with Darcian velocity, with the correlation coefficient R 2 > 0.998. The values of permeability, obtained by fitting Eq. (1) to the data, are listed in Table I. It is shown that permeability depends strongly on porosity and, if the double layers are parallel to the flow direction, the layered structure has little influence on permeability.
Variations of pressure gradient with Darcian velocity for porous copper samples with different porosities. (a) Single-layer samples (S1–S6) and (b) double-layer samples (S7–S10) compared with single layer samples (S1 and S6).

The values of the Reynolds number based on the pore diameter are in the range of 19–95, which would normally correspond to the steady nonlinear laminar flow regime.Reference Dybbs, Edwards, Bear and Corapciolgu15 However, the regions of the porous channels in the LCS porous copper samples that restrict the fluid flow are the interpore openings, which are often much smaller than the neighbouring pores. An effective Reynolds number based on the interpore openings would have given lower values. As suggested by Boomsma et al.Reference Boomsma, Poulikakos and Zwick7 for general comparison among porous media, replacing the characteristic length by the square root of the permeability results in Reynolds number values in the range of 0.06–0.98, which is within the regime of validity of Darcy’s law. It seems Darcy’s law can be applied to Reynolds numbers based on the pore diameter up to 100 in the current experimental conditions.
B. Heat transfer coefficient of single-layer samples
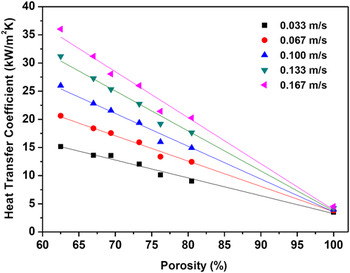
Figure 4 shows the variations of heat transfer coefficient with porosity at different Darcian velocities for single layer porous copper samples. For comparison purposes, the heat transfer coefficient of the test chamber without a sample, equivalent to a porosity of 100%, was also measured. It can be clearly seen that, at a fixed Darcian velocity, the heat transfer coefficient decreased linearly with porosity. At any given porosity, the heat transfer coefficient increased with Darcian velocity. Increasing Darcian velocity in the empty chamber had much smaller effect on the heat transfer coefficient than when there was a porous copper sample. Applying the linear least-squares fitting technique to the experimental data in Fig. 4, the heat transfer coefficient can be correlated to porosity and Darcian velocity by
 $$\eqalignb{ h = \,226.87(1 - {\rm{\varepsilon }}){\nu ^{0.60}} \cr\!+ 5.78{\nu ^{0.15}}(19 \, \lt \,{{\mathop{\rm Re}\nolimits} _D} \, \lt \, 95,\, {R^2}=0.987)\quad ,$$
where ε is porosity. The fluid flow studied in this paper has relatively low Reynolds numbers and is therefore in the laminar regime.
Variations of heat transfer coefficient with porosity at different Darcian velocities for single-layer porous copper samples (samples S1–S6).

These results showed a similar trend to those reported previously in Ref. Reference Zhang, Mullen, Lynn, Zhao, Brechet, Embury and Onck13. The decreasing heat transfer coefficient with increasing porosity is mainly attributed to the rapid decrease of the thermal conductivity of the porous sample.Reference Thewsey and Zhao9 At a given porosity, increasing Darcian velocity means more water flow to disperse the heat, resulting in increased convective heat transfer. However, the values of heat transfer coefficient in the present study are much lower than those in the previous study (Fig. 3 in Ref. Reference Zhang, Mullen, Lynn, Zhao, Brechet, Embury and Onck13), especially for the empty chamber. This difference is due to the different experimental conditions. In the previous study,Reference Zhang, Mullen, Lynn, Zhao, Brechet, Embury and Onck13 water flow entered a cylindrical-disc sample axially and exited radially, leading to better heat transfer than the one-dimensional flow in this study because a greater amount of water flow is in direct contact with the heat source. However, this impingement arrangement is difficult to realize in practical applications and, more importantly, is not suitable for characterizing the heat transfer coefficients of the porous materials.
These results are also qualitatively consistent with the results obtained by Boomsma et al.Reference Boomsma, Poulikakos and Zwick7 on compressed Duocel Al foams tested with a similar setup, in terms of the effects of Darcian velocity and porosity. Meaningful quantitative comparison is difficult because of the different setups (test channel geometry, type of material, type of coolant, and flow conditions).
It is worth noting that the sample with the porosity of 76.2% (S5) consistently falls off the trends in Fig. 4. This is likely due to a special structural feature of LCS porous copper. The denseness of the copper matrix depends on the pressure experienced by the copper particles between the potassium carbonate particles during compaction. There exists a critical volume fraction of potassium carbonate, above which the potassium carbonate particles are closely packed and the copper particles are shielded to some extent from the applied pressure. For perfectly packed spherical particles, the critical volume fraction of potassium carbonate is 0.74. The copper matrix in the porous copper samples with a porosity value (which is approximately equal to the volume fraction of potassium carbonate) above this critical volume fraction is likely to have less densification than that in the low-porosity samples. As a consequence, they may have a slightly lower thermal conductivity and thus a lower heat transfer coefficient than the predicted trend.
C. Heat transfer coefficient of double-layer samples
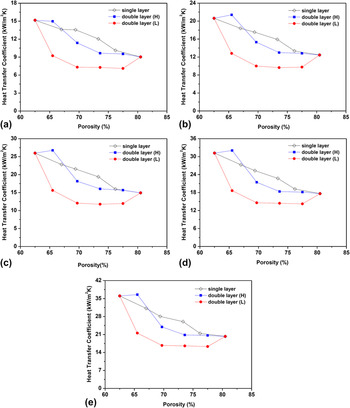
Figure 5 shows the variations of heat transfer coefficient with sample porosity for single- and double-layer porous samples. As seen from Fig. 5, the heat transfer coefficient of double-layer samples no longer followed a linear relationship with the overall porosity of the sample. More prominently, for the same double-layer sample, attaching the high-porosity layer to the heat source (indicated by H) had a much better heat transfer performance than the reversed arrangement (indicated by L). It shows that water flow in the layer next to the heat source had a dominant effect on the overall heat transfer performance. It is also worth noting that the heat transfer coefficients of the double layer samples were generally lower than the single-layer samples with the same sample porosities, except for sample S7 (H) where a thin high-porosity layer (1 mm) was attached to the heat block.
Heat transfer coefficients of single- and double-layer samples at different Darcian velocities: (a) v = 0.033 m/s, (b) v = 0.067 m/s, (c) v = 0.100 m/s, (d) v = 0.133 m/s, and (e) v = 0.167 m/s. H or L indicates that the high- or low-porosity layer, respectively, is attached to the heat block.

IV. DISCUSSION
A. Flow stratification
Fluid flow often chooses preferentially the strata with higher permeabilities.Reference Ho and Webb16
According to Darcy’s law, Eq. (1), the distribution of Darcian velocity in the individual layers in a double-layer structure parallel to the flow direction is proportional to the permeabilities of the corresponding layers,
 $${{{v_{\rm{h}}}} \over {{v_{\rm{l}}}}} = {{{K_{\rm{h}}}} \over {{K_{\rm{l}}}}}\quad ,$$
where the subscripts h and l designate the high- and low-porosity layers, respectively.
Because the overall Darcian velocity for the sample follows the rule of mixture,
 $$v = {f_{\rm{h}}}{v_{\rm{h}}} + {f_{\rm{l}}}{v_{\rm{l}}}\quad ,$$
where f is the fraction of the thickness of a layer in relation to the total sample thickness (f h + f l = 1), the scaling factors for Darcian velocity can be obtained by combining Eqs. (6) and (7):
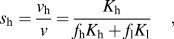 $${s_{\rm{h}}} = {{{v_{\rm{h}}}} \over v} = {{{K_{\rm{h}}}} \over {{f_{\rm{h}}}{K_{\rm{h}}} + {f_{\rm{l}}}{K_{\rm{l}}}}}\quad ,$$
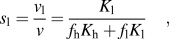 $${s_{\rm{l}}} = {{{v_{\rm{l}}}} \over v} = {{{K_{\rm{l}}}} \over {{f_{\rm{h}}}{K_{\rm{h}}} + {f_{\rm{l}}}{K_{\rm{l}}}}}\quad ,$$
where s h and s l are the scaling factors for high- and low-porosity layers, respectively.
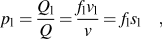
The flow rates in the double layers can be described by the following partition factors,
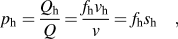 $${p_{\rm{h}}} = {{{Q_{\rm{h}}}} \over Q} = {{{f_{\rm{h}}}{v_{\rm{h}}}} \over v} = {f_{\rm{h}}}{s_{\rm{h}}}\quad ,$$
 $${p_{\rm{l}}} = {{{Q_{\rm{l}}}} \over Q} = {{{f_{\rm{l}}}{v_{\rm{l}}}} \over v} = {f_{\rm{l}}}{s_{\rm{l}}}\quad ,$$
where Q h, Q l, and Q are the flow rates of the fluid through the high-porosity layer, the low-porosity layer, and the whole sample, respectively.
Table II shows the scaling factors and partition factors of the high- and low-porosity layers in the double-layer porous copper samples. It is evident that the majority of the flow passes through high-porosity (80%) layer. Even if the thickness of the high-porosity layer is only 1 mm (S2), more than 70% of the water flows through this layer preferentially. With an increased thickness of the high-porosity layer to 4 mm, nearly 98% of the water flows through this layer.
Flow distribution in the double layers.

The flow stratification in the double layers is expected to play a critical role in the heat transfer because Darcian velocity, or flow rate, has a great effect on the heat transfer coefficient as shown in Fig. 4.
B. Heat transfer decay across sample thickness
As a first order approximation, a single-layer porous copper attached to a hot block with forced water flow can be regarded as a one-dimensional conduction–convection problem. The porous copper sample can be simulated as an infinite fin of uniform cross-sectional area. Assuming that the increase in the temperature of the cooling water within the porous copper sample is negligible, the governing equation for temperature distribution in the porous sample can be expressed asReference Incropera, Dewitt, Bergman and Lavine17
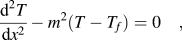 $${{{{\rm{d}}^2}T} \over {{\rm{d}}{x^2}}} - {m^2}(T - {T_f}) = 0\quad ,$$
where T is the temperature of the porous copper at distance x from the interface between the heat block and porous copper sample, T f is the temperature of the cooling water, and m is a constant depending on the local convective heat transfer coefficient, the effective thermal conductivity, and the specific surface area of the porous copper.
The solution of the above equation is
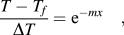 $${{T - {T_f}} \over {\Delta T}} = {{\rm{e}}^{ - mx}}\quad ,$$
 $$J = mk\Delta T\quad ,$$
where ΔT is the temperature difference between the heat block at the block-sample interface and the cooling water, k is the effective thermal conductivity of the porous copper, and J is the heat flux from the heat block to the porous copper.
From Fourier’s law, the conductive heat flux in the porous copper sample at x can be obtained by
 $${J_{{\rm{cond}}}} = - k{{{\rm{d}}T} \over {{\rm{d}}x}} = J{{\rm{e}}^{ - mx}}\quad .$$
The above equation shows that the conductive heat flux decreases exponentially with distance x, with the steepness of the decay being affected by the parameter m.
For this model to be valid as an approximation for a porous copper sample with a finite thickness t, the conductive heat transfer flux at x = t should be sufficiently small. As a first order approximation, we can assume that the conductive heat flux decays to 2% of the total heat flow at the far end of the sample, i.e., 98% of the heat has been removed by the convective heat transfer into the coolant. This assumption leads to m ≈ 4/t. The accumulative convective heat flux up to x within the porous copper sample with a thickness t is therefore
 $${J_{{\rm{conv}}}} = J - {J_{{\rm{cond}}}} = J(1 - {{\rm{e}}^{ - {{4x} \over t}}})\quad .$$
The convective contribution of a particular layer of the sample, from x = x 1 to x = x 2, to the overall heat transfer can be expressed by a weighting factor,
 $$w = {{J_{{\rm{conv}}}^{x = {x_2}} - J_{{\rm{conv}}}^{x = {x_1}}} \over J} = {{\rm{e}}^{ - {{4{x_1}} \over t}}} - {{\rm{e}}^{ - {{4{x_2}} \over t}}}\quad .$$
If a 5-mm-thick porous sample is divided into five 1-mm layers, the weighting factors for the first to the fifth layers are 0.55, 0.25, 0.10, 0.06, and 0.04, respectively. In other words, the contribution of each layer of the porous sample decreases rapidly with increasing distance from the heat source. The layer directly next to the heat source has the greatest effect on the overall heat transfer.
C. Segment model
A simple approach to model a sample composed of multilayers with different porous structures and flow conditions is to sum up the contributions of the individual layers. The overall heat transfer coefficient can be considered as a weighted average of the heat transfer coefficients of the individual layers. The heat transfer coefficient of each layer is dependent on the porosity and Darcian velocity in this layer. The weighting factor is dependent on the distance of this layer to the heat source, as demonstrated in Sec. IV. B.
Dividing the double-layer samples in this investigation into five layers, the overall heat transfer coefficient, h, can be estimated by
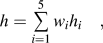 $$h = \mathop \sum\limits_{i = 1}^5 {{w_i}} {h_i}\quad ,$$
where h i is the heat transfer coefficient of the ith layer, which can be determined by Fig. 4 or calculated by Eq. (5), and w i is a weighting factor of the ith layer, which can be determined by Eq. (14). Specifically, the weighting factors of layer 1 to 5 are 0.55, 0.25, 0.10, 0.06, and 0.04, respectively.
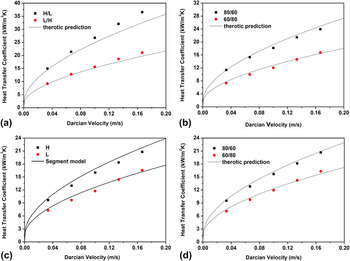
Figure 6 compares the measured heat transfer coefficients with the predictions using the segment model, Eq. (15), and shows good agreements between the measurements and predictions. Flow stratification and heat transfer decay in the double layers explain the experimental results well. As shown in Fig. 4, Darcian velocity has a great effect on the heat transfer coefficient. Because the water flow is predominantly through the high-porosity layer, the heat transfer coefficient of the high-porosity layer is significantly higher than that of the low-porosity layer. As the contribution of a layer to the heat transfer decays rapidly with the distance from the heat source, attaching high-porosity layer next to the heat block results in better performance.
Comparison between the measured heat transfer coefficients and the segment model predictions for the double-layer samples (a) S2, (b) S3, (c) S4, and (d) S5. H or L indicates that the high- or low-porosity layer, respectively, is attached to the heat block.

The segment model provides a tool for evaluating the designs of cooling devices with gradient or layered structures to optimize flow stratification and thus the overall heat transfer performance.
It should be pointed out that the heat transfer decay Eq. (14) is applicable to porous samples with a homogeneous structure. Applying this equation to a multilayer sample can result in some errors. Strictly speaking, the parameter t in Eq. (14) is the thickness of the thermal boundary layer, which is determined by the parameter m, which in turn depends on the thermal and structural properties of the porous sample and the fluid flow in the porous sample. In this paper, the thermal boundary layer is assumed to coincide with the sample thickness, regardless of the porous sample properties and flow conditions. Although this assumption seems reasonable under the present experimental conditions because the side of the porous copper sample opposite to the heat source was insulated, the simplification will undoubtedly introduce errors. Further research is needed to quantify the thermal boundary layer.
V. CONCLUSIONS
Water flow through the LCS porous copper with a homogeneous structure increased the heat transfer coefficient by 5–8 times compared with an empty channel. The heat transfer coefficient of the porous copper/water system decreased linearly with increasing sample porosity and increased nearly parabolically with increasing water flow rate. The double-layer porous copper samples generally had lower heat transfer coefficients due to flow stratification. For the same sample, placing the high-porosity layer next to the heat block resulted in much better heat transfer performance than the other way around. There was a good agreement between the experimental results and the predictions of the segment model for double-layer porous copper samples.
ACKNOWLEDGMENTS
This work was supported by the Technology Strategy Board, UK (TP/8/MAT/6/I/Q1568F). The authors would like to thank Ecka Granules Metal Powder Ltd for supplying the copper powder. Z. Xiao would like to thank the University of Liverpool and the Chinese Scholarship Council for a studentship.
NOMENCLATURE
A
cross-sectional area of sample
d
distance between T t and T b
D
Average pore size
f
thickness fraction
h
heat transfer coefficient
J
total heat flux
J cond
conductive heat flux
J conv
convective heat flux
k
thermal conductivity of porous copper
k Cu
thermal conductivity of copper
K
permeability
L
length of sample
m
constant
p
partition factor
ΔP
pressure drop
Q
fluid flux
R
correlation factor
ReD
Reynolds number based on average pore size
s
scale factor
t
thickness of sample
T
temperature of porous copper
T b
temperature of heating block, bottom
T t
temperature of heating plate, top
T f
temperature of coolant
T in
temperature of inlet water
T out
temperature of outlet water
v
Darcian velocity
w
weighting factor
x
distance from heating plate