INTRODUCTION
On subtidal soft bottoms, seagrasses form one of the most productive ecosystems worldwide, providing high-value ecosystem services such as delivery of food and habitat for a wide range of organisms (Costanza et al., Reference Costanza, d'Arge, de Groot, Farber, Grasso, Hannon, Limburg, Naeem, O'Neill, Paruelo, Raskin, Sutton and van den Belt1997; Duffy, Reference Duffy2006; Thomsen et al., Reference Thomsen, Wernberg, Engelen, Tuya, Vanderklift, Holmer, McGlathery, Arenas, Kotta and Silliman2012), support of commercial fisheries, nutrient cycling, sediment stabilization and sequestration of carbon (Duarte et al., Reference Duarte2000; Waycott et al., Reference Waycott, Duarte, Carruthers, Orth, Dennison, Olyarnik, Calladine, Fourqurean, Heck, Hughes, Kendrick, Kenworthy, Short and Williams2009). Seagrasses, and the services they provide, are, however, threatened by impacts derived from coastal development and growing human population, as well as by impacts caused by climate change (Duarte, Reference Duarte2002; Orth et al., Reference Orth, Carruthers, Dennison, Duarte, Fourqurean, Heck, Hughes, Kendrick, Kenworthy, Olyarnik, Short, Waycott and Williams2006; Waycott et al., Reference Waycott, Duarte, Carruthers, Orth, Dennison, Olyarnik, Calladine, Fourqurean, Heck, Hughes, Kendrick, Kenworthy, Short and Williams2009; Tuya et al., Reference Tuya, Hernandez-Zerpa, Espino and Haroun2013a). Conservation of these valuable habitats is, therefore, important, particularly since seagrass meadows are declining worldwide, mainly in areas of intense human activities (Hughes et al., Reference Hughes, Williams, Duarte, Heck and Waycott2009). At a global scale, the progressive disappearance of seagrasses has been concurrently accompanied by increases in the presence of opportunistic vegetation, such as green rhizophytic seaweeds (Thomsen et al., Reference Thomsen, Wernberg, Engelen, Tuya, Vanderklift, Holmer, McGlathery, Arenas, Kotta and Silliman2012).
Cymodocea nodosa (Ucria) Ascherson is a seagrass distributed across the Mediterranean Sea and adjacent areas of the Atlantic Ocean, including the Macaronesian archipelagos of Madeira and the Canary Islands (Reyes et al., Reference Reyes, Sansón and Afonso-Carrillo1995; Tuya et al., Reference Tuya, Hernandez-Zerpa, Espino and Haroun2013a). Meadows constituted by C. nodosa are the dominant vegetated communities on shallow soft substrates across the Canary Islands (Pavón-Salas et al., Reference Pavón-Salas, Herrera, Hernández-Guerra and Haroun2000; Barberá et al., Reference Barberá, Tuya, Boyra, Sanchez-Jerez, Blanch and Haroun2005; Monterroso et al., Reference Monterroso, Riera and Núñez2012), where they provide food and shelter for diverse invertebrate and fish assemblages, including a ‘nursery’ habitat for larval and juvenile fish stages (Tuya et al., Reference Tuya, Martín and Luque2006; Espino et al., Reference Espino, Tuya, Brito and Haroun2011a, Reference Espino, Tuya, Brito and Harounb). However, C. nodosa meadows are severely decreasing at local scales, mostly as a result of a range of human-mediated impacts (Martínez-Samper, Reference Martínez-Samper2011; Tuya et al., Reference Tuya, Hernandez-Zerpa, Espino and Haroun2013a). In these coastal areas, the decline of C. nodosa meadows often results in their replacement by opportunistic green algae of the genus Caulerpa, in particular Caulerpa prolifera (Forsskål) J.V. Lamouroux (Martínez-Samper, Reference Martínez-Samper2011; Tuya et al., Reference Tuya, Hernandez-Zerpa, Espino and Haroun2013a).
Caulerpa prolifera is a native seaweed in the Canary Islands (Haroun et al., Reference Haroun, Gil-Rodríguez and Wildpret de la Torre2003), forming extensive beds on soft bottoms in waters from ~5 to 50 m depth. Several Caulerpa species contain caulerpenyne, a major secondary metabolite, which varies depending on the species, locations and seasons (Jung et al., Reference Jung, Thibaut, Meinesz and Pohnert2002; Box et al., Reference Box, Sureda, Tauler, Terrados, Marbà, Pons and Deudero2010), and appears to possess toxic and feeding deterrent properties against faunal herbivores (Smyrniotopoulos et al., Reference Smyrniotopoulos, Abatis, Tziveleka, Tsitsimpikou, Roussis, Loukis and Vagias2003). Caulerpenyne may also act as an antimitotic substance, preventing settlement of most epiphytes (Sánchez-Moyano et al., Reference Sánchez-Moyano, Estacio, García-Adiego and García-Gómez2001a). In addition, the high sediment-retention capacity of Caulerpa beds induces organic enrichment (Hendriks et al., Reference Hendriks, Bouma, Morris and Duarte2010), potentially altering the distribution and abundance of associated animal populations (Sánchez-Moyano et al., Reference Sánchez-Moyano, Estacio, García-Adiego and García-Gómez2001a).
When seagrasses are replaced by seaweeds, the quantity and quality of habitat for associated faunal assemblages may be altered, as well as flows of energy and matter through the ecosystem (Thomsen et al., Reference Thomsen, Wernberg, Engelen, Tuya, Vanderklift, Holmer, McGlathery, Arenas, Kotta and Silliman2012; Tuya et al., Reference Tuya, Png-Gonzalez, Riera, Haroun and Espino2013b). In particular, epifaunal invertebrates are sensitive to changes in plant abundance and structure (e.g. through plant attributes such as plant size, biomass, shoot density and so on), so differences in the diversity, abundance and structure of invertebrate assemblages are expected between different types of vegetation within the same geographical and environmental context (Sirota & Hovel, Reference Sirota and Hovel2006). In this sense, amphipods respond to habitat alterations and can, therefore, be used as an indicator of environmental impacts on vegetated habitats (Virnstein & Howard, Reference Virnstein and Howard1987; Conradi et al., Reference Conradi, López-González and García-Gómez1997; Sánchez-Jerez et al., Reference Sánchez-Jerez, Barberá-Cebrián and Ramos-Esplá2000; Vázquez-Luis et al., Reference Vázquez-Luis, Sanchez-Jerez and Bayle-Sempere2008, Reference Vázquez-Luis, Sanchez-Jerez and Bayle-Sempere2009).
The aim of this study was to compare the diversity, abundance and structure of epifaunal assemblages between meadows dominated by the seagrass Cymodocea nodosa and the seaweed Caulerpa prolifera on shallow soft bottoms off Gran Canaria Island, determining whether patterns were temporally consistent. Particular emphasis was concentrated on amphipods, since amphipods are one of the most quantitatively abundant and important groups of invertebrates associated with coastal vegetated habitats, while they also play an important role as trophic resources for fish populations (Sánchez-Jerez et al., Reference Sánchez-Jerez, Barberá Cebrián and Ramos-Esplá1999; Vázquez-Luis et al., Reference Vázquez-Luis, Sanchez-Jerez and Bayle-Sempere2009).
MATERIALS AND METHODS
Study area and sampling design
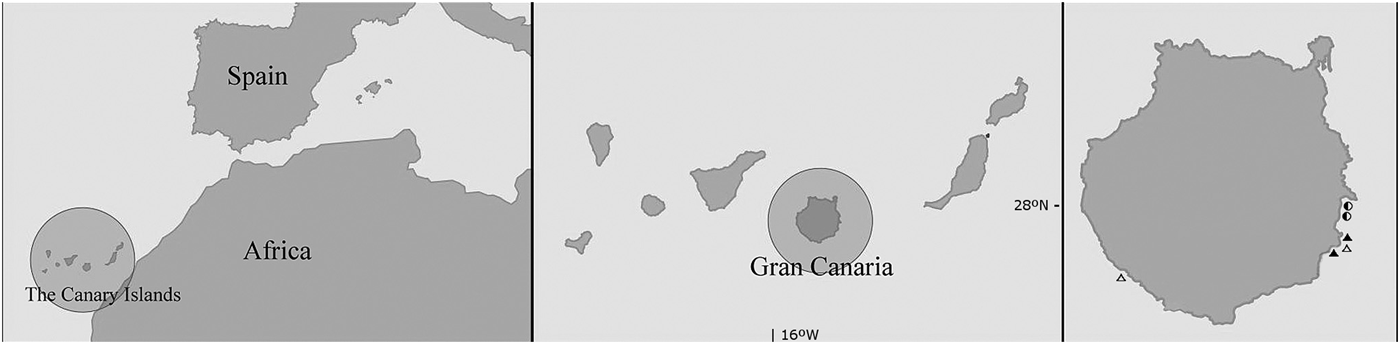
The study was carried out in Gran Canaria (Canary Islands, eastern Atlantic), at several localities (Figure 1) dominated by either subtidal mono-specific Cymodocea nodosa meadows or beds constituted by Caulerpa prolifera. Each habitat (Cymodocea nodosa vs Caulerpa prolifera-dominated beds) was randomly sampled at each of two localities, where ten replicates were collected by SCUBA divers, using a 20 × 20 cm quadrat. Macrophytes collections were performed cutting the seagrass/seaweed immediately above the sediment surface, keeping the vegetation with the associated epifauna inside unbleached woven cotton bags (Brearley et al., Reference Brearley, Kendrick and Walker2008; Gartner et al., Reference Gartner, Tuya, Lavery and McMahon2013). Sampling was repeated twice (November 2011 and October 2012) to assess whether patterns in the diversity, abundance and structure of epifaunal assemblages between beds dominated by Cymodocea nodosa and Caulerpa prolifera were temporally consistent.
Map of the study area showing the sampled localities at Gran Canaria. Triangles, Cymodocea nodosa meadows; circles, Caulerpa prolifera-dominated beds; filled symbols, November 2011; open symbols, October 2012.

Labelled samples were preserved in a freezer (−20°C) until processing. In the laboratory, samples collected were initially defrosted and subsequently sieved through a 500 μm mesh to retain macrofaunal organisms. Specimens were sorted and counted into different taxonomic groups under a binocular microscope and preserved in 70% ethanol. Four main dominant groups: Crustacea, Mollusca, worms (including Annelida and Sipuncula) and other fauna (Chelicerata, Chordata and Echinodermata) were considered. Organisms were identified to the lowest possible taxonomic level and amphipods were identified to species, in most cases. The amount of vegetated biomass (expressed as grammes wet weight per 0.04 m2) was obtained for each replicate to account for differences in the amount of habitat (vegetation) among samples. Amphipod structure was characterized using two attributes: abundance (expressed as ind m−2) and species density (expressed as number of species per 0.04 m2).
Statistical analysis
UNIVARIATE ANALYSIS
Differences in the abundance and species density of the dominant groups (here, Crustacea, Mollusca, Amphipoda, worms and other fauna) between habitats, localities within habitats and times, were tested using a three-way, permutation-based, ANCOVA, which incorporated the factors: ‘Habitat’ (fixed factor with two levels: Cymodocea nodosa vs Caulerpa prolifera), ‘Locality’ (random factor and nested within ‘Habitat’, 2 levels: L1 and L2), and ‘Time’ (fixed factor with 2 levels: November 2011 vs October 2012). ‘Vegetation biomass’ was included as a covariate to account for differences in the amount of available habitat for epifauna among samples. Data were square-root transformed prior to analysis, and analyses were based on Euclidean distances (Anderson, Reference Anderson2001a). The significance of P values was determined through 4999 permutations of the raw data. For each ANCOVA, we estimated the relative contribution of each factor to explain differences in the response variable through calculation of their corresponding variance components.
MULTIVARIATE ANALYSIS
Differences in the multivariate structure (which includes the composition and abundance) of assemblages between habitats (Cymodocea nodosa vs Caulerpa prolifera) were visualized through a non-metric multidimensional scaling (nm-MDS) ordination plot. The significance of these multivariate differences were tested by a three-way PERMANOVA (Anderson, Reference Anderson2001b), using ‘Time’, ‘Habitat’ and ‘Locality’ as factors, following the same design outlined above. The vegetation biomass of each replicate was, again, included as a covariate. Data were square-root transformed prior to analysis to downweight the relevance of the most abundant taxa and analyses were based on Bray–Curtis similarities. The individual contribution of each amphipod species to the dissimilarity between habitats was calculated by the SIMPER routine. All uni- and multivariate procedures were carried out by means of the PRIMER 6.0 & PERMANOVA statistical package.
RESULTS
Epifaunal assemblages
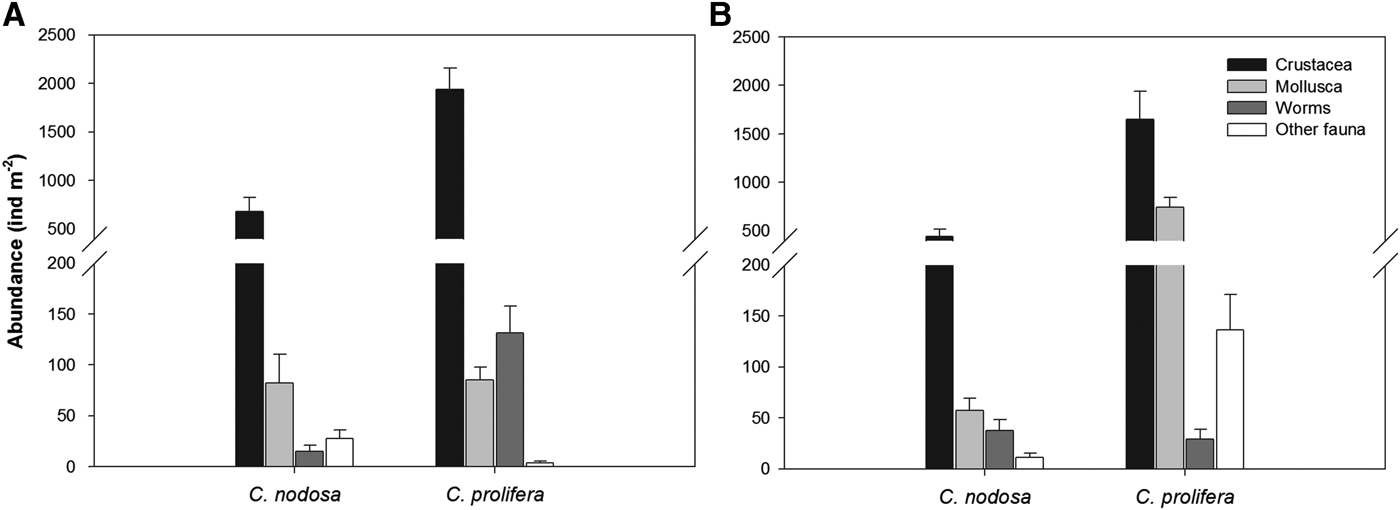
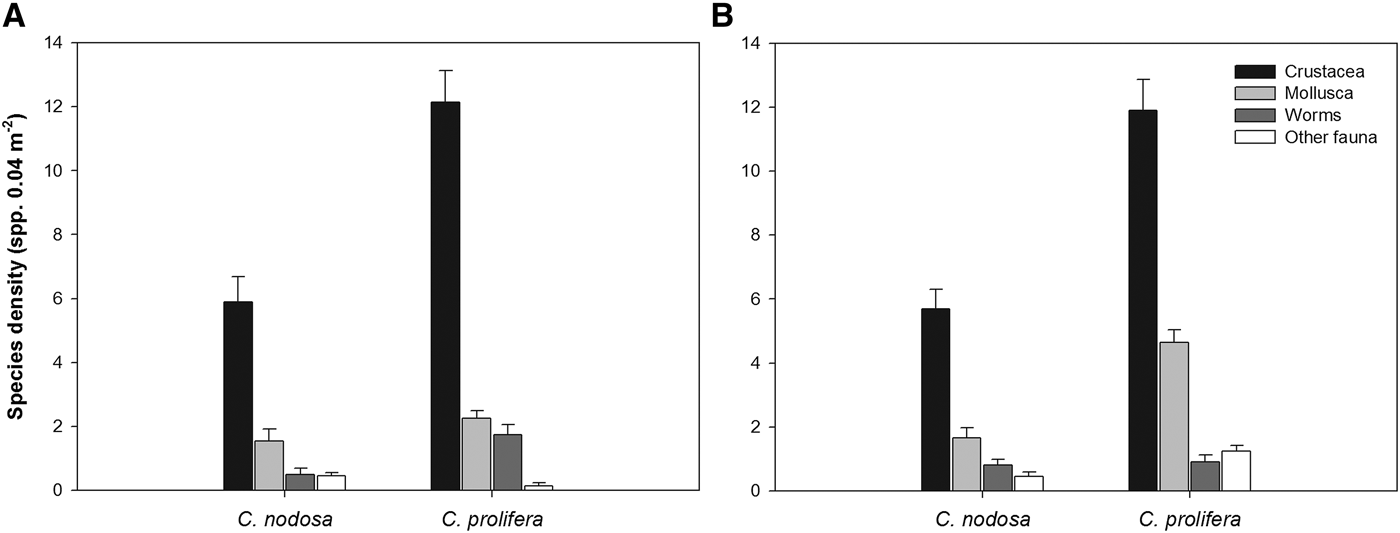
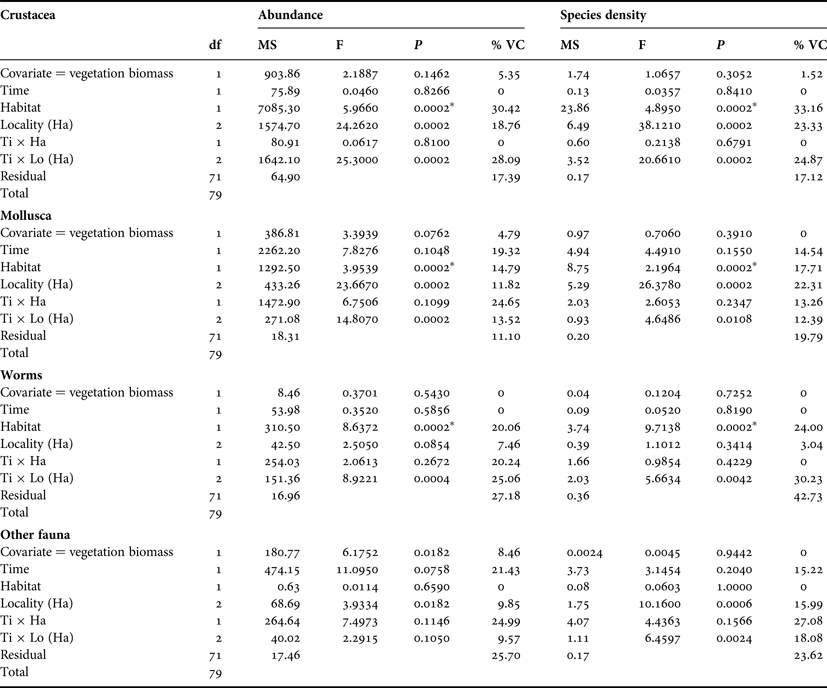
A total of 4655 epifaunal individuals, belonging to 105 taxa (Appendix), were counted, including crustaceans (3594 individuals), molluscs (777), worms (138) and other fauna (146). The abundance of crustaceans, which proved to be the dominant group (accounting for 77.2% of the total epifaunal abundance), was significantly larger in Caulerpa prolifera-dominated beds (1792.5 ± 181.18 ind m−2, mean ± SE) than in Cymodocea nodosa meadows (562.5 ± 81.92 ind m−2) at both sampling times (Figure 2; three-way ANCOVA: ‘Habitat’, P = 0.0002, Table 1). The species density of crustaceans was also larger in C. prolifera-dominated beds than in Cymodocea nodosa meadows (12.03 ± 0.52 vs 5.8 ± 0.47 spp. 0.04 m−2, respectively) (Figure 3; three-way ANCOVA: ‘Habitat’, P = 0.0002, Table 1). The abundance of molluscs was, again, significantly larger in Caulerpa prolifera-dominated beds (415.63 ± 71.4 ind m−2) than in Cymodocea nodosa meadows (70 ± 15.14 ind m−2) (Figure 2; three-way ANCOVA: ‘Habitat’, P = 0.0002, Table 1), as well as the species density of molluscs (3.45 ± 0.23 vs 1.6 ± 0.2 spp. 0.04 m−2, respectively) (Figure 3; three-way ANCOVA: ‘Habitat’, P = 0.0002, Table 1). Minor epifaunal fractions, such as worms, showed a different pattern between sampling times, but their abundance and species density were, on average, larger in Caulerpa prolifera-dominated beds (80 ± 16.32 ind m−2 and 1.33 ± 0.09 spp. 0.04 m−2, respectively) than in Cymodocea nodosa meadows (26.25 ± 6.39 ind m−2 and 0.65 ± 0.07 spp. 0.04 m−2) (Figures 2 and 3; three-way ANCOVA: ‘Habitat’, P = 0.0002, Table 1). Finally, other fauna was more abundant in Caulerpa prolifera-dominated beds (70 ± 20.16 ind m−2) than in Cymodocea nodosa meadows (19.38 ± 5.02 ind m−2), but without significant differences (Figure 2; three-way ANCOVA: ‘Habitat’, P = 0.6590, Table 1). The species density of other fauna (0.7 ± 0.12 vs 0.45 ± 0.35 spp. 0.04 m−2, respectively) (Figure 3) was not significant either (three-way ANCOVA: ‘Habitat’, P = 1.0000, Table 1).
Mean abundance (ind m−2 ±SE) of the four dominant epifaunal groups at each habitat in (A) November 2011 and (B) October 2012.
Mean species density (number of species ±SE) of the four dominant epifaunal groups at each habitat in (A) November 2011 and (B) October 2012.
Results of three-way ANCOVAs testing for differences between habitats, times and localities within habitats, for the abundance and species density of each dominant epifaunal group.
*, significant difference at P < 0.05. The amount of variance (% VC) explained by each factor is included.
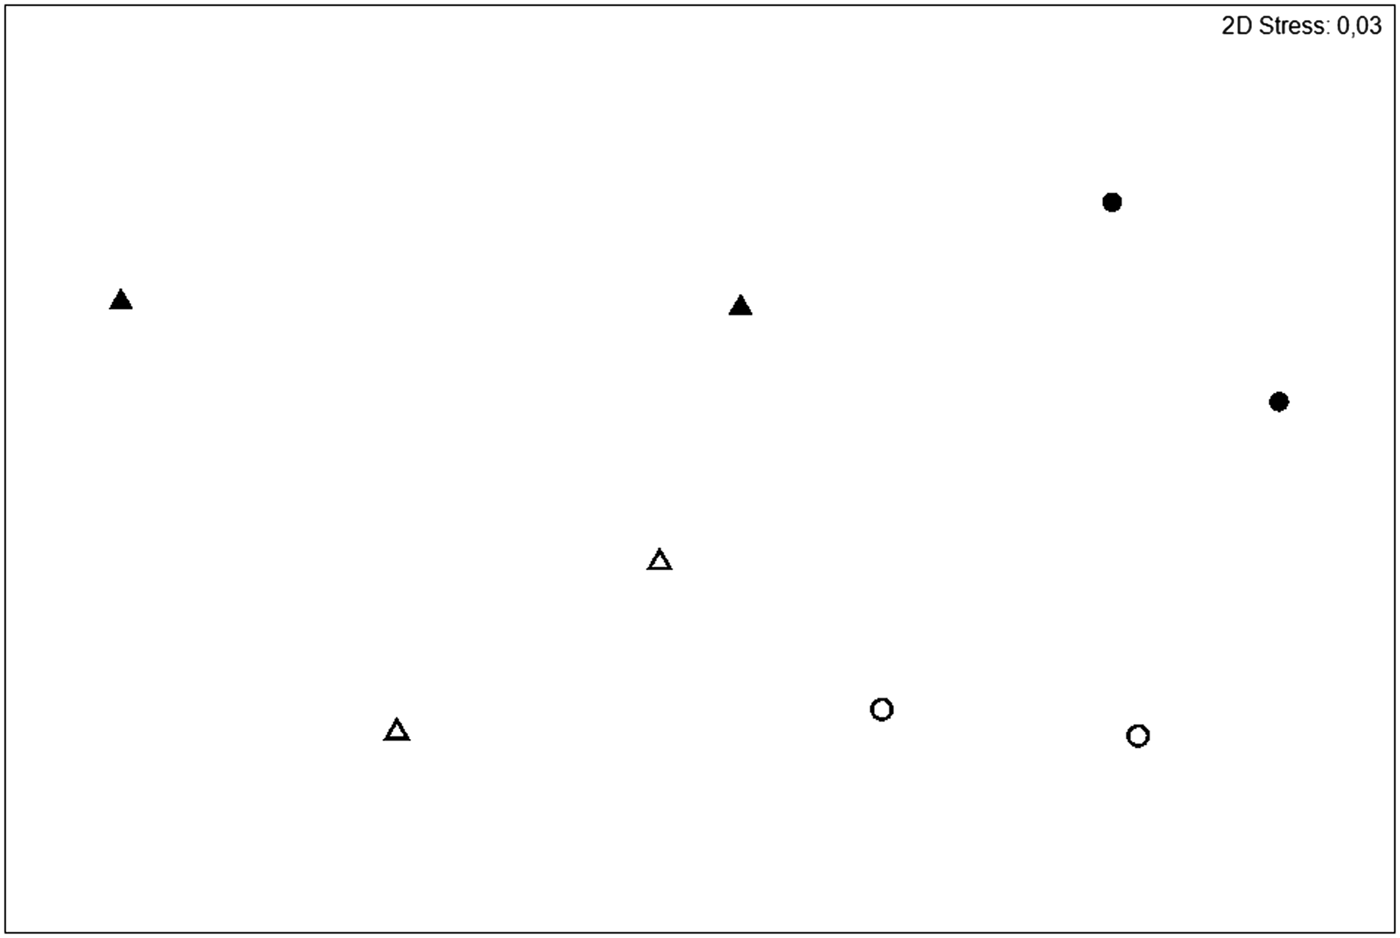
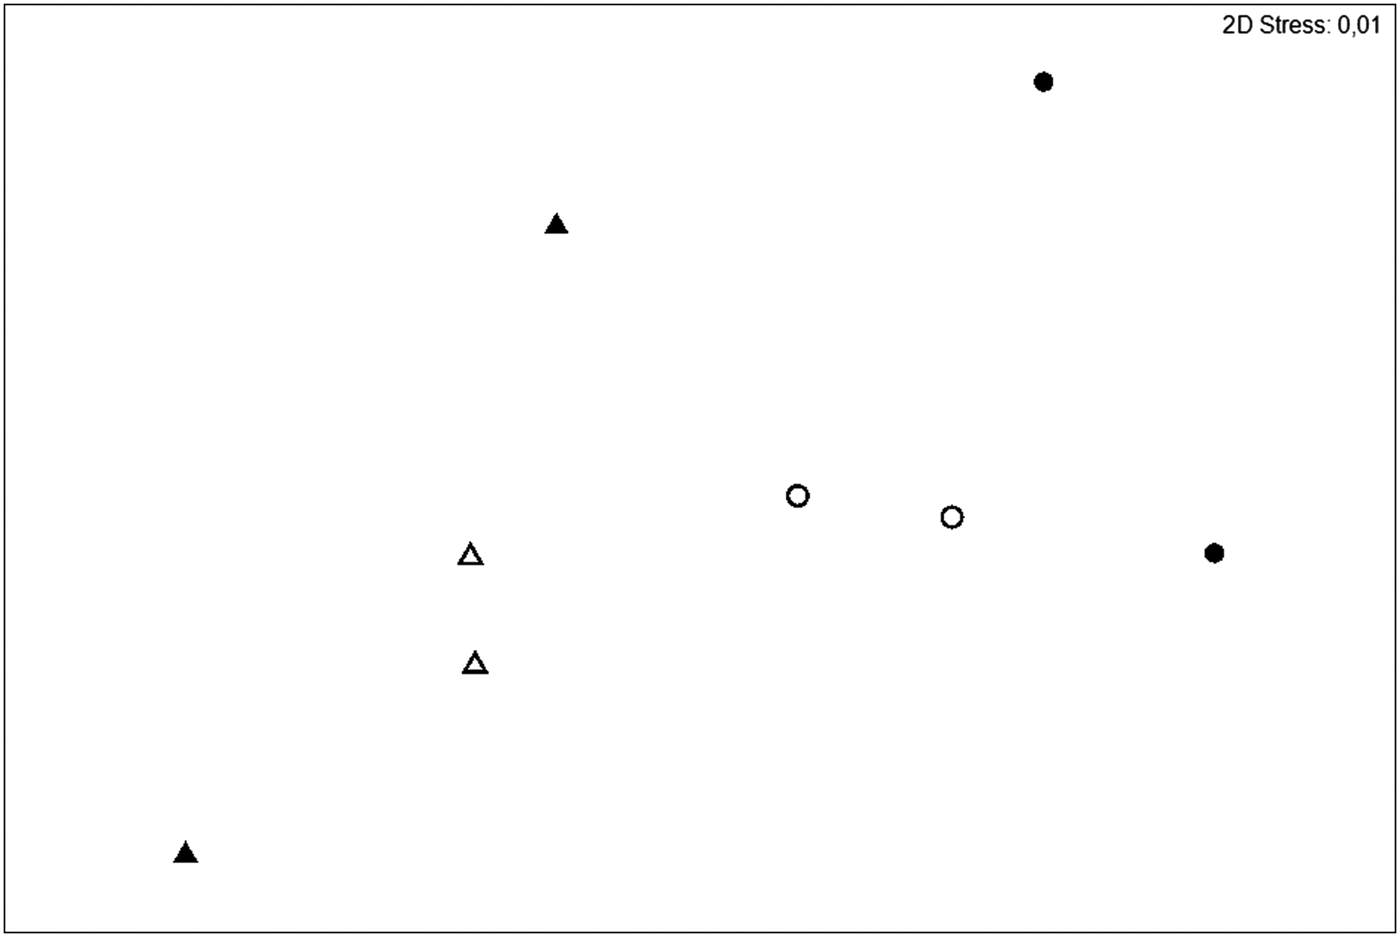
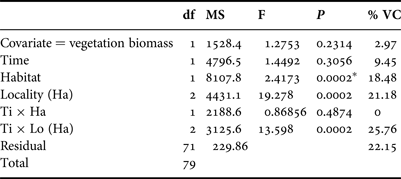
The two-dimensional MDS plot showed a separation of epifaunal assemblages by habitats and times: epifauna associated with Cymodocea nodosa meadows are in the left-hand side of the ordination space, while epifauna inhabiting Caulerpa prolifera-dominated beds are in the right-hand side of the plot. In addition, samples corresponding to November 2011 are in the top half of the plot, whereas those corresponding to October 2012 are in the bottom half (Figure 4). This multivariate response, however, was only statistically significant between habitats (three-way PERMANOVA: ‘Habitat’, P = 0.0002; Table 2).
Two-dimensional nm-MDS plot showing similarities in the epifaunal assemblage structure between habitats and times. Each symbol corresponds to a sampling locality within each habitat. Triangles, Cymodocea nodosa; circles, Caulerpa prolifera. Filled symbols, November 2011; open symbols, October 2012.
Results of three-way PERMANOVA testing for differences in the epifaunal assemblage structure between habitats, times and localities within habitats.
*, significant differences for P < 0.05. The amount of variance (% VC) explained by each factor is included.
Amphipod assemblages
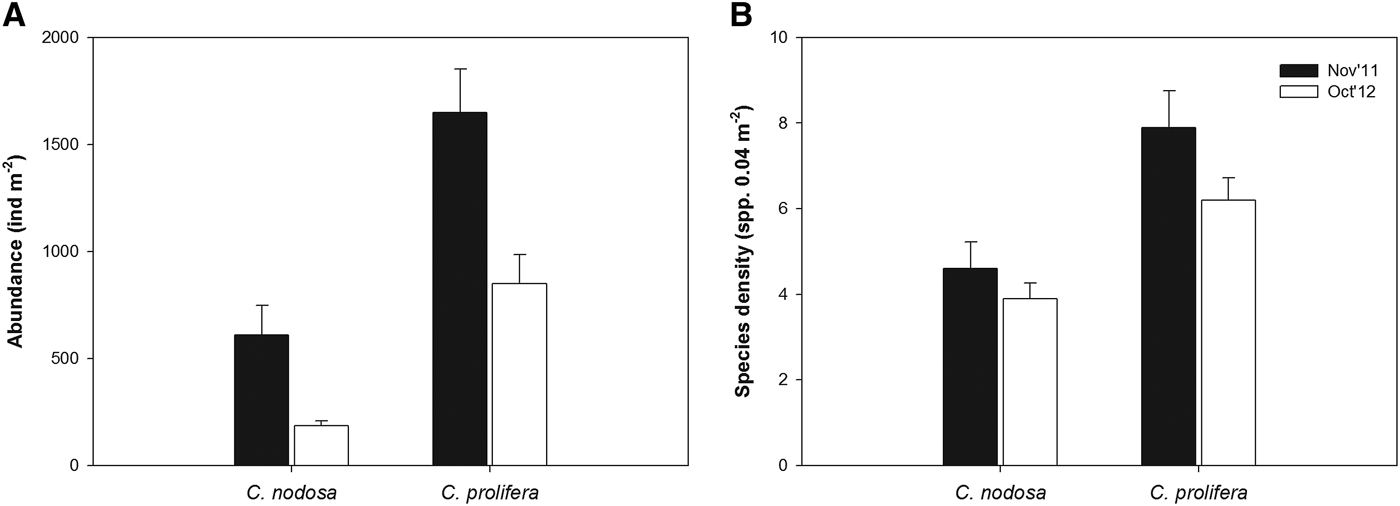
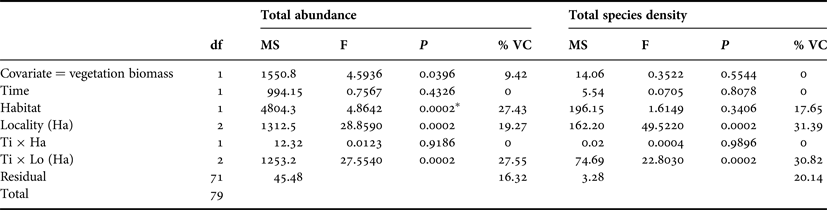
A total of 41 amphipod species, belonging to 16 families, were collected (Appendix). The abundance of amphipods constituted ~70% of total crustaceans for the overall study; amphipod abundance was significantly larger in Caulerpa prolifera-dominated beds (1248.13 ± 136.83 ind m−2, mean ± SE) than in Cymodocea nodosa meadows (396.88 ± 77.36 ind m−2) at both sampling times (Figure 5A; three-way ANCOVA: ‘Habitat’, P = 0.0002, Table 3). A similar pattern was found for amphipod species density (7.05 ± 0.47 vs 4.25 ± 0.38 spp. 0.04 m−2, respectively; Figure 5B), but differences were not statistically significant (three-way ANCOVA: ‘Habitat’, P = 0.3406, Table 3).
(A) Mean abundance (ind m−2 ±SE) and (B) mean species density (number of species ±SE) of amphipods at each habitat and time.
Results of 3-way ANCOVAs testing for differences in the total abundance and species density of amphipods between habitats, times and localities within habitats.
*, significant difference at P < 0.05. The amount of variance (% VC) explained by each factor is included.
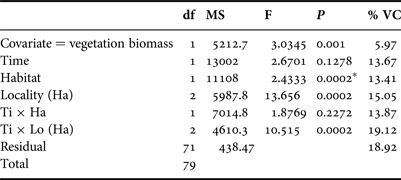
The two-dimensional MDS plot showed a clear segregation of amphipod assemblages by habitat: amphipods associated with Cymodocea nodosa meadows are in the left-hand side of the plot, while amphipods associated with Caulerpa prolifera-dominated beds are in the right-hand side. Samples collected in November 2011 were more dissimilar to each other than those obtained in October 2012 (Figure 6). However, the structure of amphipod assemblages was only significantly different between habitats (three-way PERMANOVA: ‘Habitat’, P = 0.0002, Table 4).
Two-dimensional nm-MDS plot showing similarities in the amphipod assemblage structure between habitats and times. Each symbol corresponds to a sampling locality within habitats. Triangles, Cymodocea nodosa; circles, Caulerpa prolifera. Filled symbols, November 2011; open symbols, October 2012.
Results of three-way PERMANOVA testing for differences in the amphipod assemblage structure between habitats, times and locations within habitats.
*, significant differences for P < 0.05. The amount of variance (% VC) explained by each factor is included.
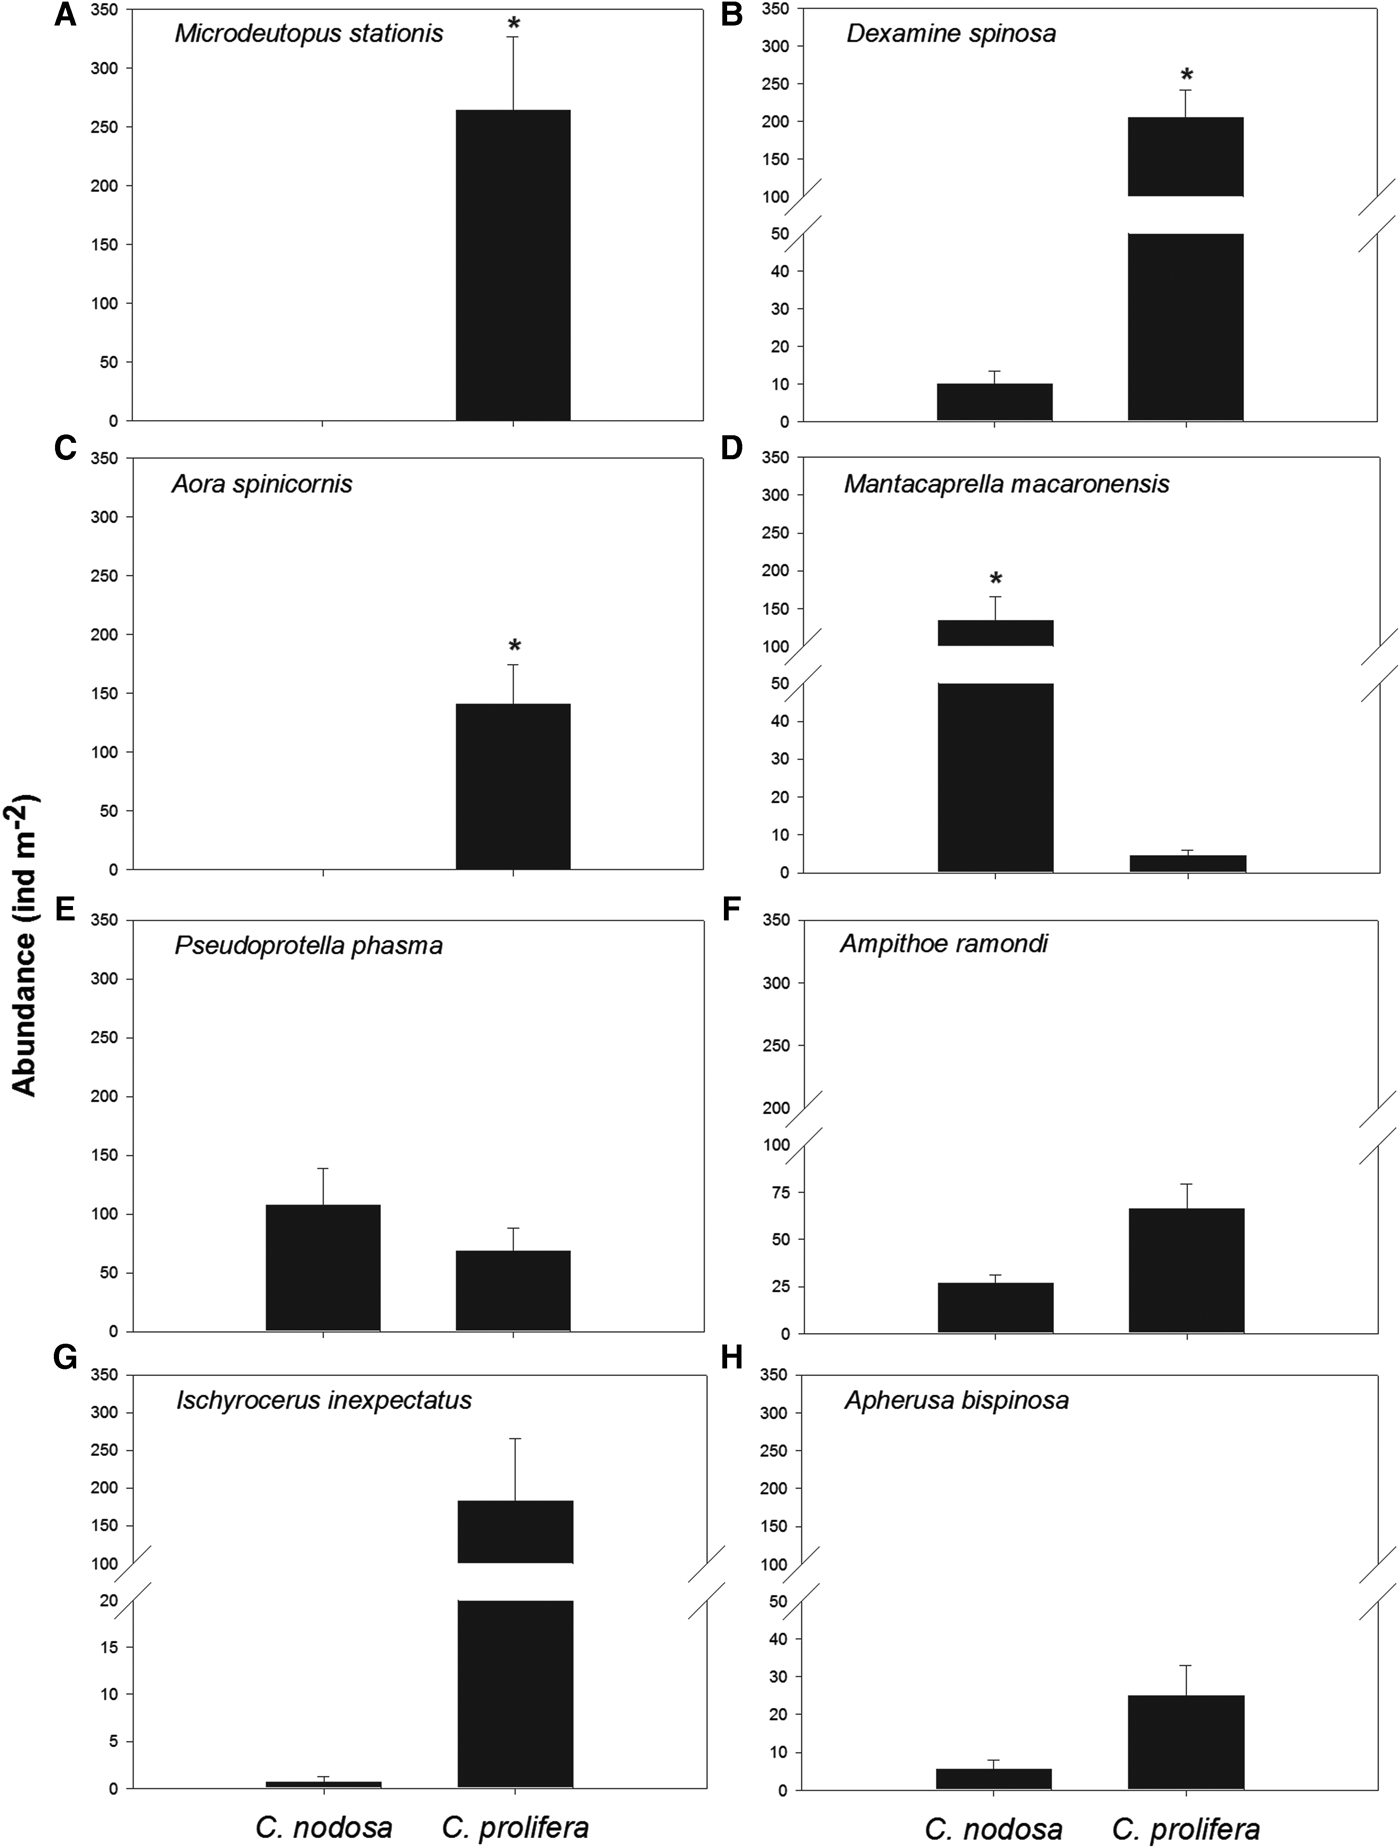
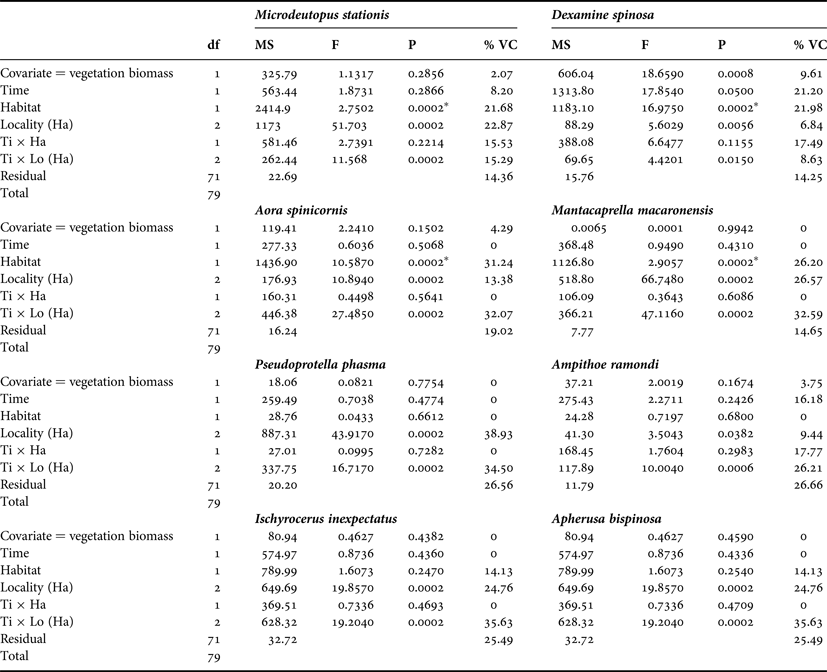
The amphipod species which most contributed to dissimilarities between habitats were: Microdeutopus stationis, Dexamine spinosa, Aora spinicornis, Mantacaprella macaronensis, Pseudoprotella phasma, Ampithoe ramondi, Ischyrocerus inexpectatus and Apherusa bispinosa. These species made up ~60% of the total abundance of amphipods. We detected species-specific affinities for the two habitats; for example, the abundance of Microdeutopus stationis, D. spinosa and A. spinicornis was significantly larger in C. prolifera-dominated beds (Figure 7A, B, C; three-way ANCOVA: ‘Habitat’, P < 0.05, Table 5), while the caprellid Mantacaprella macaronensis significantly dominated in Cymodocea nodosa meadows (Figure 7D; three-way ANCOVA: ‘Habitat’, P = 0.0002, Table 5). The other caprellid species, P. phasma, also showed larger abundances in C. nodosa meadows, although the difference with respect to Caulerpa prolifera-dominated beds was not statistically significant (Figure 7E; three-way ANCOVA: ‘Habitat’, = 0.6612, Table 5). The gammarid Ampithoe ramondi was found in both habitats, with larger abundances in C. prolifera-dominated beds, that were otherwise not statistically different (Figure 7F; three-way ANCOVA: ‘Habitat’, = 0.6800, Table 5). Finally, I. inexpectatus and Apherusa bispinosa were more abundant in C. prolifera-dominated beds, but no significant differences were detected between habitats, probably masked by the high variability between localities (Figure 7G, H; three-way ANCOVA: ‘Habitat’, >0.05, Table 5).
Mean abundance (ind m−2 ±SE) of the most important amphipod species at each habitat. *, significant differences.
Results of three-way ANCOVAs testing for differences in the abundance of the most important amphipod species between habitats, times and localities within habitats.
*, significant differences for P < 0.05. The amount of variance (% VC) explained by each factor is included.
DISCUSSION
Epifaunal assemblages
Our results have demonstrated clear differences in the multivariate structure, in terms of abundance and diversity (here quantified through the species density) of epifaunal assemblages between habitats dominated by the seagrass Cymodocea nodosa and the green seaweed Caulerpa prolifera. Larger abundances and species densities were found in C. prolifera-dominated beds; this was unexpected, since caulerpenyne seems to reduce macrophyte palatability and act as a deterrent against some herbivore species (Erickson et al., Reference Erickson, Paul, Van Alstyne and Kwiatkowski2006). In accordance with our results, previous studies have demonstrated that seabeds dominated by Caulerpa prolifera may particularly benefit crustacean assemblages (Sánchez-Moyano et al., Reference Sánchez-Moyano, García-Asencio and García-Gómez2007), revealing the importance of this vegetated habitat for the maintenance of the biodiversity in coastal areas under considerable human impacts (Sánchez-Moyano et al., Reference Sánchez-Moyano, García-Adiego, Estacio and García-Gómez2001b). A previous study conducted in the Canaries also recorded higher macrofaunal diversity in mixed bottoms of C. prolifera and Cymodocea nodosa than in mono-specific C. nodosa meadows (Monterroso et al., Reference Monterroso, Riera and Núñez2012).
Differences in the structure, abundance and diversity of epifaunal assemblages may result from changes in the structural complexity of the habitat, including host plant attributes (e.g. plant morphology, associated floral and faunal epiphytes, etc.) (Virnstein & Howard, Reference Virnstein and Howard1987; Taylor & Cole, Reference Taylor and Cole1994; Bologna & Heck Jr, Reference Bologna and Heck1999), which play an important role as space available for shelter against predators, but also due to changes in the hydrodynamic properties of the habitat. In the Mediterranean Sea, Hendriks et al. (Reference Hendriks, Bouma, Morris and Duarte2010) demonstrated that, seasonally, Caulerpa species are able to attenuate water flow, trap particles and protect the sediment from erosion even better than seagrasses (particularly C. prolifera VS Cymodocea nodosa). Hence, the replacement of C. nodosa meadows by Caulerpa prolifera may involve a significant change in the hydrodynamic properties of the sea-floor, modifying the local ecosystem functioning and affecting associated fauna compared with seagrass meadows. The high accumulation of detritus in C. prolifera-dominated beds plays an important role as a trophic resource for marine invertebrates, and can affect the overall trophic web (Vázquez-Luis et al., Reference Vázquez-Luis, Sanchez-Jerez and Bayle-Sempere2009), favouring macrofaunal assemblages mainly dominated by crustaceans and polychaetes (Hendriks et al., Reference Hendriks, Bouma, Morris and Duarte2010; Monterroso et al., Reference Monterroso, Riera and Núñez2012) and, probably, several facultative species which could also be found in infaunal environments.
Differences within invertebrate assemblages are expected between different types of vegetation within the same geographical and environmental context (Sirota & Hovel, Reference Sirota and Hovel2006). Low epifaunal abundances associated with Cymodocea nodosa meadows may be explained by space limitation; the architecture of C. nodosa is less complex for fauna that are limited by space in comparison to other seagrasses, such as Posidonia sinuosa and Amphibolis griffithii, which have a higher leaf surface area and algal epiphyte biomass (Gartner et al., Reference Gartner, Tuya, Lavery and McMahon2013). Epifaunal assemblages are also subjected to substrate competitive exclusion due to source limitation (Duffy & Harvilicz, Reference Duffy and Harvilicz2001) and to fish predatory pressure. Seagrasses play an important role in providing habitat for nearshore fish assemblages (Espino et al., Reference Espino, Tuya, Brito and Haroun2011a). In the study region, C. nodosa meadows play a ‘nursery’ role for the early stages of numerous fish species (Espino et al., Reference Espino, Tuya, Brito and Haroun2011a, Reference Espino, Tuya, Brito and Harounb). The abundance of fish is ~3–4 times larger in C. nodosa- than in Caulerpa prolifera-dominated beds (Tuya et al., Reference Tuya, Png-Gonzalez, Riera, Haroun and Espino2013b). Epifaunal organisms, particularly crustaceans, are the main constituent of diets of seagrass-associated fish (Yamada et al., Reference Yamada, Hori, Tanaka, Hasegawa and Nakaoka2010; Horinouchi et al., Reference Horinouchi, Tongnunui, Furumitsu, Nakamura, Kanou, Yamaguchi, Okamoto and Sano2012). Hence, it is worth noting that the contrasting abundance patterns of epifaunal and fish assemblages between Cymodocea nodosa and Caulerpa prolifera bottoms might fits a classical ‘predation’ model, where a large abundance of predators (here, fish) remove large quantities of prey (here, epifauna) and so explain the decreasing abundance of prey in such habitats (here, Cymodocea nodosa seagrass meadows) (Verdiell-Cubedo et al., Reference Verdiell-Cubedo, Oliva-Paterna and Torralva-Forero2007).
Amphipod assemblages
The amphipod assemblage structure differed between habitats at both sampling times, including larger abundances of amphipods (~3 times) in Caulerpa prolifera-dominated beds than in Cymodocea nodosa meadows. This outcome disagrees with amphipod abundances reported by Vázquez-Luis et al. (Reference Vázquez-Luis, Sanchez-Jerez and Bayle-Sempere2009) for the same habitats, at two different seasons (September 2004 and March 2005), in the western Mediterranean Sea (313.89 ± 75.63 ind m−2 in Caulerpa prolifera and 494.44 ± 160.17 ind m−2 in Cymodocea nodosa, mean ± SE). The variation of amphipod abundances between both studies, especially in bottoms constituted by Caulerpa prolifera, may be due to the difference in the sampling seasons or merely due to the difference between the sampling areas (Canary Islands in the Atlantic Ocean vs Alicante in the Mediterranean Sea).
The diversity of amphipods recorded in Cymodocea nodosa seagrass meadows at Gran Canaria (16 amphipod species in November 2011 and 17 in October 2012) are comparable, or even lower, than the number of amphipod species reported by several studies from the Mediterranean Sea (28 species, Sánchez-Jerez et al., Reference Sánchez-Jerez, Barberá Cebrián and Ramos-Esplá1999; 13 species in September and 21 in March, Vázquez-Luis et al., Reference Vázquez-Luis, Sanchez-Jerez and Bayle-Sempere2009). On bottoms dominated by Caulerpa prolifera, a total of 27 and 20 amphipod species (November 2011 and October 2012, respectively) were identified by our study, which contrast with 17 amphipod species recorded by Sánchez-Moyano et al. (Reference Sánchez-Moyano, García-Asencio and García-Gómez2007) in Algeciras Bay, and values of 6 and 18 species reported by Vázquez-Luis et al. (Reference Vázquez-Luis, Sanchez-Jerez and Bayle-Sempere2009), at two different seasons, also in the Mediterranean Sea. The variation within the total number of amphipod species among studies show a more diverse assemblage of amphipods in C. prolifera-dominated beds at Gran Canaria.
Several authors have stated that amphipods are able to actively select their host habitat (Hay et al., Reference Hay, Duffy and Fenical1990; Poore, Reference Poore2005; Poore & Hill, Reference Poore and Hill2006), a fact that is related to differences in palatability and food preferences by herbivores (Ortega et al., Reference Ortega, Díaz and Martín2010). However, although the active selection appears important, it is not sufficient to explain differential patterns of epifaunal distribution and abundance among host plants (Virnstein & Howard, Reference Virnstein and Howard1987). The presence of diverse amphipods on plant species may result from ecological processes unrelated to herbivore preferences or the quality of the host for growth and survival, but from variation in the risk of predation among hosts (Poore, Reference Poore2005). As reported above, the susceptibility of amphipods to fish predation commonly varies across algal species, usually decreasing with increased structural complexity of the host or with the presence of secondary metabolites that are deterrent to omnivorous fish (Poore, Reference Poore2005; Verdiell-Cubedo et al., Reference Verdiell-Cubedo, Oliva-Paterna and Torralva-Forero2007; Vázquez-Luis et al., Reference Vázquez-Luis, Sanchez-Jerez and Bayle-Sempere2010).
In the current study, some species seem to show preference for specific habitats. Overall, it is possible to distinguish between gammarids, typically associated with C. prolifera-dominated beds, and caprellids, typically associated with Cymodocea nodosa meadows. Within gammarids, individuals belonging to the family Aoridae (here, Aora spinicornis and Microdeutopus stationis) have been exclusively found in Caulerpa prolifera-dominated beds. This outcome contrasts with previous records from the Mediterranean Sea. For example, A. spinicornis has been found among hydroids, phanerogams and algae, and on sandy and muddy bottoms as well (Ruffo, Reference Ruffo1982; Conradi & López-González, Reference Conradi and López-González1999); whilst M. stationis has been almost exclusively found on fine sand, particularly among the phanerogams Cymodocea nodosa and Posidonia oceanica, with some records on coralligenous habitats (Ruffo, Reference Ruffo1998) and macrophytes (Conradi & López-González, Reference Conradi and López-González1999). However, other authors have also found large abundances of Microdeutopus spp. in Caulerpa beds and on rocky habitats (Roberts & Poore, Reference Roberts and Poore2005; Vázquez-Luis et al., Reference Vázquez-Luis, Sanchez-Jerez and Bayle-Sempere2008, Reference Vázquez-Luis, Sanchez-Jerez and Bayle-Sempere2009), with preference for environments with low hydrodynamic regimes and high sedimentation rates (Conradi et al., Reference Conradi, López-González and García-Gómez1997; Guerra-García & García-Gómez, Reference Guerra-García and García-Gómez2005). In our study, other species significantly more abundant in C. prolifera-dominated beds was the free-living, herbivore, Dexamine spinosa, which is very common within algal canopies in the shallow subtidal zone (Lincoln, Reference Lincoln1979; Ruffo, Reference Ruffo1982), but also on sandy bottoms with bio-detritus (Conradi & López-González, Reference Conradi and López-González1999). Apherusa bispinosa and Ischyrocerus inexpectatus were also collected in higher abundances in C. prolifera-dominated beds. Consistent with our results, Farlin et al. (Reference Farlin, Lewis, Anderson and Lai2010) reported that ischyrocerids, such as Ischyrocerus inexpectatus, tend to feed more on algae than on seagrasses. As with the previous gammarids, Ampithoe ramondi was, again, more abundant in C. prolifera-dominated beds than in Cymodocea nodosa meadows, although differences were not so high. Ampithoids are cosmopolitan, herbivorous amphipods, which usually occur in shallow subtidal zones amongst native seaweeds and seagrasses (Lincoln, Reference Lincoln1979; Ruffo, Reference Ruffo1982; Poore, Reference Poore2005; Vázquez-Luis et al., Reference Vázquez-Luis, Sanchez-Jerez and Bayle-Sempere2008, Reference Vázquez-Luis, Sanchez-Jerez and Bayle-Sempere2009), tending to feed more on seagrasses (Farlin et al., Reference Farlin, Lewis, Anderson and Lai2010), which contrasts with our results. The caprellid Pseudoprotella phasma has been found in both habitats, but mainly inhabiting C. nodosa meadows; this species might also be found among algae (Ruffo, Reference Ruffo1993), with a preference for environments with high hydrodynamics (Conradi & López-González, Reference Conradi and López-González2001). Finally, the caprellid Mantacaprella macaronensis has shown a clear preference for C. nodosa seagrass meadows, with few abundances occurring in Caulerpa prolifera-dominated beds. This caprellid species has also been found in rocky habitats from the Macaronesian archipelago of Cape Verde (Vázquez-Luis et al., Reference Vázquez-Luis, Guerra-García, Carvalho and Png-Gonzalez2013).
In conclusion, our study shows that Caulerpa prolifera-dominated beds have a more abundant and diverse epifaunal assemblage than Cymodocea nodosa meadows, which is also reflected on amphipod assemblages, and is temporally consistent. Therefore, C. prolifera meadows seem to be a favourable habitat for epifauna in soft vegetated habitats in the Canary Islands.
ACKNOWLEDGEMENTS
We acknowledge T. Sánchez and F. Espino for their help during fieldwork, and J. Suárez for providing help at the laboratory.
FINANCIAL SUPPORT
This study was partially supported by the UE project ECOSERVEG, within the BEST initiative (Voluntary Scheme for Biodiversity and Ecosystem Services in Territories of the EU Outermost Regions and Oversees Countries and Territories, Grant no. 07.032700/2012/635752/SUB/B2). F. Tuya was supported by the MINECO ‘Ramón y Cajal’ programme.
Appendix
Abundances (ind m−2 ± SE) of epifaunal organisms at each habitat and time. The total abundance and number of species are also included.