


I. Introduction
Outsourcing of investment advisory functions is growing across the delegated portfolio management industry. As of 2024, more than 30% of equity mutual funds, accounting for approximately 15% (U.S.$0.74 trillion) of total assets under management (AUM), delegated their investment management to an external unaffiliated advisor. The decision to outsource can be driven by the capacity constraints of mutual fund families, the ambition to gain market share by expanding their product offerings in new investment styles, or the ability to extract cost efficiencies by dividing work along the lines of specialization (Debaere and Evans (Reference Debaere and Evans2015), Massa and Schumacher (Reference Massa and Schumacher2020)). However, the growing popularity of outsourcing the investment advisory function does not necessarily imply an increase in investor welfare. Chen, Hong, Jiang, and Kubik (Reference Chen, Hong, Jiang and Kubik2013), in their seminal paper, find that outsourced funds underperform in-house managed funds by about 52 basis points a year. Chuprinin, Massa, and Schumacher (Reference Chuprinin, Massa and Schumacher2015), Moreno, Rodriguez, and Zambrana (Reference Moreno, Rodriguez and Zambrana2018), and Broman, Densmore, and Nolan (Reference Broman, Densmore and Nolan2023) also confirm this finding in different samples that use both domestic and international mutual funds.
In this article, we investigate the source of outsourced funds’ underperformance and argue that it arises from contracting frictions between two key parties: the fund family and the external investment advisor. Our central contribution is to show that the equilibrium contract incentivizes external advisors to engage in strategic mid-year risk-shifting—rather than curb risk-taking—an outcome that is inefficient from the investor’s perspective. Importantly, this risk-shifting motive differs from previously documented drivers such as performance maximization (e.g., Lee, Trzcinka, and Venkatesan (Reference Lee, Trzcinka and Venkatesan2019)) or flow incentives (e.g., Brown, Harlow, and Starks (Reference Brown, Harlow and Starks1996)).
The agency problems we examine stem from the firm boundaries between the fund family and the external advisor. These boundaries prevent the fund family from coordinating with the external advisor and controlling some of the key drivers of fund success, such as manager assignment, compensation design, and monitoring mechanisms. Chen et al. (Reference Chen, Hong, Jiang and Kubik2013) argue that, in this imperfect informational environment, offering external advisors contracts with high-powered incentives can be optimal. They empirically demonstrate the prevalence of such contracts by showing that outsourced funds are more likely to be closed for poor performance—a pattern we confirm in our sample as well.
Yet such contracts can create unintended consequences by making the advisor’s payoff option-like. Underperformance raises the likelihood of contract termination and thus drives the payoff toward 0, a risk that is especially stark given that the median advisor in our sample manages only one fund. Outperformance, by contrast, increases the likelihood of contract retention and preserves fee income tied to AUM. The steep trade-off between retention and termination makes employment risk especially salient for outsourced advisors. Although performance-based fee components such as fulcrum fees can be economically meaningful in certain sub-advisory arrangements, Elton, Gruber, and Blake (Reference Elton, Gruber and Blake2003) and Ma, Tang, and Gomez (Reference Ma, Tang and Gomez2019) report that they apply to fewer than 5% of advisors, suggesting that termination risk creates the more pervasive incentive in practice. In this environment, high-powered contracts may lead outsourced advisors to strategically increase portfolio risk in the second half of the year, conditional on mid-year performance. Specifically, advisors with returns close to the benchmark face the strongest incentive to “swing for the fences,” since their implicit asymmetric payoff structure amplifies the value of taking volatility. In other words, we expect the outsourced advisors to maximize the vega of the option embedded in the contract.Footnote 1 Importantly, this incentive dissipates once performance strays meaningfully above or below the benchmark. We refer to this channel as the retention hypothesis of risk-shifting, and argue that the resulting increase in conditional risk-taking—rather than underinvestment in risk, as in Chen et al. (Reference Chen, Hong, Jiang and Kubik2013)—helps explain why outsourced funds underperform in-house funds.
Given that a large percentage of fund families outsource fund management to advisory firms, we next consider what tools, if any, they use to complete contracts in the presence of firm boundaries and to mitigate risk-shifting. First, we look at co-branded funds. Often, fund families partner with unaffiliated external advisors and put the advisors’ names in the fund name to attract flows using the advisors’ reputations (co-branded). The reputation cost, due to co-branding, can be effective in assuaging potential conflicts of interest and reducing risk-shifting (see Moreno et al. (Reference Moreno, Rodriguez and Zambrana2018)). Second, geographical proximity matters for effective monitoring (see Kang and Kim (Reference Kang and Kim2008), Jensen, Kim, and Yi (Reference Jensen, Kim and Yi2015)). Therefore, we expect to observe less risk-shifting when we focus on funds where the fund family and the advisor(s) are located nearby (co-located). Third, we look at co-managed funds. When there are multiple advisors managing the same fund (co-managed), firm boundaries among them limit the extent of collusion and promote effective peer-monitoring (see Kandel and Lazear (Reference Kandel and Lazear1992)). Demonstrating an association between these mechanisms and reduced conditional risk-shifting would further support our central hypothesis, highlighting the prevalence of contractual arrangements to mitigate performance attrition and justify the popularity of outsourcing fund management.
To empirically test our hypotheses, we use the universe of U.S. equity mutual funds from 1999 to 2024. Our baseline results show that the distance of fund performance from the benchmark is inversely related to the risk-shifting ratio (the ratio of the second period’s return standard deviation to the first period’s return standard deviation). These findings reinforce the original conclusions of Lee et al. (Reference Lee, Trzcinka and Venkatesan2019), who report that asymmetric compensation contracts offered by the investment advisor to the portfolio manager of a fund incentivize the manager to strategically risk-shift. However, more importantly, consistent with the retention hypothesis of risk-shifting, we find that the observed inverse relationship is significantly higher for outsourced funds than for those managed in-house. In fact, outsourced funds (coeff.: −1.643) engage in about 100% more strategic risk-shifting than in-house (coeff.: −0.853) managed funds when the fund performance is close to the benchmark returns. Given that, on average, risk-shifting leads to poor fund performance (see Huang, Sialm, and Zhang (Reference Huang, Sialm and Zhang2011)), the nearly twofold increase in the coefficient is clearly economically very significant.
On account of firm boundaries and weaker monitoring by the outsourcing fund family, the portfolio managers hired by advisors of outsourced funds could exploit the asymmetry in the compensation contract more than managers of in-house funds. We refer to the combined effect of managerial compensation and weaker monitoring as the nexus hypothesis of risk-shifting. To further support the retention hypothesis of risk-shifting and rule out the role of portfolio manager compensation, we exploit the heterogeneity in the portfolio manager’s compensation contracts (using hand-collected data) and show that outsourced funds with performance-based compensation do not change their portfolio risk materially differently from those without performance-based compensation. Additionally, we utilize the variation in scale and scope of external advisors’ operations and show that advisors who care about their reputation, measured by a total pool of AUM and the number of client accounts managed, engage in significantly lower risk-shifting. We also confirm that our main results are robust to the use of alternative holdings-based measures of risk-shifting and to other empirical specifications.
Next, we consider the possibility that the fund’s outsourcing status might be endogenous to its risk choice. To address this issue, we use an instrumental variable (IV) approach to establish a causal relation between outsourcing and mid-year risk-shifting. Following Chen et al. (Reference Chen, Hong, Jiang and Kubik2013), we instrument for a fund’s outsourcing status based on the number of funds a family offered at its inception, controlling for family size. The idea is that fund complexes have a limited span of control, and as they offer more funds, they reach their capacity constraint and are more likely to outsource fund management. Results from our IV approach confirm our earlier findings as we continue to find higher risk-shifting in outsourced funds. To further examine the causal effect of a fund’s management status on its risk choice, we match outsourced funds (treated) to funds managed in-house (control) on observable characteristics that plausibly affect the funds’ assignment to either one of these two groups. When we assess the difference between the two groups, we find that outsourcing status, along with mid-year fund performance, has a causal effect on the risk-shifting decision. Additionally, we document that the underperformance (11 bps per quarter) of outsourced mutual funds, on average, can be explained by those funds that engage in excessive conditional risk-shifting.
Finally, we test the efficacy of alternative mechanisms that help align incentives in incomplete contracting environments. More specifically, we test whether the three arrangements, co-branding, co-location, and co-management, have any moderating effect on the intrinsic risk-shifting behavior of the outsourced advisor. Over two-thirds of our sample uses at least one of these three mechanisms. Among these, co-branding and co-location reduce risk-shifting unconditionally, while the mitigating effect of co-management is concentrated in periods when outsourced funds underperform. Although it does not fully eliminate agency friction, we find that when a fund complex takes at least one of these additional measures, there is a 62% decrease, on average, in the level of risk-shifting. The existence of these mitigating factors helps explain why the use of external advisors is still increasing, even though the average outsourced fund is underperforming.Footnote 2
Our article makes several contributions to the literature. First, in the context of outsourcing, we identify a new incentive for external advisors to engage in conditional risk-taking: contract retention. This mechanism is conceptually distinct from prior literature that focuses on flow-based (e.g., Brown et al. (Reference Brown, Harlow and Starks1996)) or performance-based incentives (e.g., Lee et al. (Reference Lee, Trzcinka and Venkatesan2019)). Unlike portfolio managers, whose compensation is often explicitly tied to short-term performance, external advisors typically earn asset-based fees and face a binary outcome: contract renewal or termination, depending on annual fund performance. This creates a convexity in their payoff structure, where the marginal benefit of increasing volatility peaks when fund performance is close to the benchmark.
While we are not the first to link employment risk with risk-shifting, our setting is distinct in important ways. For instance, in Kempf, Ruenzi, and Thiele (Reference Kempf, Ruenzi and Thiele2009), employment risk is balanced against compensation incentives, and managers often reduce risk even under poor mid-year performance, when job loss is the dominant concern. Importantly, the managers in their study operate within the boundaries of the fund family, where monitoring and alternative performance metrics can temper extreme behavior. By contrast, outsourced advisors in our setting face much sharper convexity in their payoff: termination of the advisory contract is more sensitive to performance, and weaker monitoring due to firm boundaries limits the principal’s ability to intervene. As a result, retention incentives dominate, and outsourced advisors near the benchmark have a strong motivation to increase risk—regardless of the portfolio manager’s own compensation structure. Our empirical results confirm this explanation and help us separate employment-driven risk-shifting from performance- or flow-motivated behavior.
Second, we shed new light on the outsourcing literature that investigates the various aspects of contract design. It is well understood that the presence of firm boundaries in outsourcing arrangements creates agency frictions. Chuprinin et al. (Reference Chuprinin, Massa and Schumacher2015) showcase an example of such a friction and show that international outsourced advisors, who simultaneously manage their own fund(s) (side-by-side management), tend to favor their own fund(s) in allocations of initial public offerings and use of privileged information and rely on the outsourced fund to support abnormal cross-trading activities during times of liquidity needs. Chen et al. (Reference Chen, Hong, Jiang and Kubik2013) suggest offering high-powered incentive contracts as a solution. However, we demonstrate that this contract is still incomplete and show that some fund families, perhaps aware of frictions, adopt costly organizational mechanisms to “complete” these contracts and mitigate agency problems. Moreno et al. (Reference Moreno, Rodriguez and Zambrana2018) also argue that specific contractual arrangements can mitigate outsourcing-related agency conflicts and diminish fund underperformance. Our work complements their findings by identifying an important mechanism behind underperformance—excessive conditional risk-shifting—and empirically validating how specific arrangements are effective. We document how co-branding and co-location reduce risk-shifting unconditionally, while co-management attenuates risk-shifting specifically when outsourced funds underperform. To our knowledge, we are the first to quantify the efficacy of these arrangements in directly moderating risk-taking behavior, providing a possible explanation for why outsourcing remains prevalent despite the average underperformance.
Finally, our study contributes to the broader literature on the contractual structures that shape fund management outcomes. The return an investor receives is the result of a complex chain of delegation. This process involves multiple parties—such as fund families, trustees, investment advisors, and portfolio managers—with each link in the chain governed by a separate contractual arrangement. While we do not attempt to model the full dynamics across all these layers, our evidence highlights how incentive misalignments can emerge in unexpected ways within multi-layered contracting environments. For example, prior work (Lee et al. (Reference Lee, Trzcinka and Venkatesan2019), Ma et al. (Reference Ma, Tang and Gomez2019), Evans, Prado, and Zambrana (Reference Evans, Prado and Zambrana2020), Evans, Gómez, Ma, and Tang (Reference Evans, Gómez, Ma and Tang2024)) shows that portfolio manager compensation design significantly influences outcomes such as risk-taking, performance, and intra-family allocations. In contrast, we find that outsourced advisors often exhibit muted responses to performance-based incentives, regardless of how portfolio managers are compensated. These findings underscore the importance of adopting a holistic perspective, where contract design is evaluated not only at the individual level but also in terms of how incentive structures interact across layers, offering broader lessons for both theory and practice in delegated asset management.
II. Hypotheses Development
In the United States, a substantial portion of mutual funds is managed by advisors external to the fund family to which investors allocate their capital. These outsourced advisors are responsible for portfolio management and are compensated with a fixed fee or a small fraction of the AUM (see Elton et al. (Reference Elton, Gruber and Blake2003)).Footnote 3 However, it is very uncommon for investment advisors to have performance-based compensation. We discuss this in greater detail in Section IA.A of the Supplementary Material.
By definition, the outsourced advisors are outside the firm boundaries of the fund family. Therefore, given the difficulty in monitoring and coordinating tasks, Chen et al. (Reference Chen, Hong, Jiang and Kubik2013) argue that the optimal solution for the fund family is to offer a contract with high-powered incentives. They empirically verify their assertion by estimating the probability of fund closure conditional on the past 12 months’ performance. An outsourced fund is 78% more likely to be closed after poor performance compared to in-house managed funds (see Chen et al. (Reference Chen, Hong, Jiang and Kubik2013), Table VIII). In our sample, we find the incremental probability of an outsourced fund’s closure after poor performance to be 60% higher than in-house funds. Arnold, Chambers, Saffi, and Zheng et al. (Reference Arnold, Chambers, Saffi and Zheng2025) also show that sub-adviser turnover decisions are driven by underperformance, which reinforces the notion that termination risk is a central disciplinary mechanism in outsourced advisory relationships. Their difference-in-differences analysis finds that replacing poorly performing sub-advisers improves funds’ risk-adjusted returns and net flows.Footnote 4
The regulations governing the hiring and firing of sub-advisors also facilitate the easy execution of high-powered incentive contracts. Section 15(a) of the Investment Company Act of 1940 distinguishes between appointment and termination: appointing a new adviser requires both board and shareholder approval, while termination does not. Rule 15a-4 further allows interim advisory contracts (up to 150 days) without shareholder approval. More importantly, in practice, most fund families operate under a “manager of managers” exemptive order (“Proposed Rule 15a-5”) issued by the Securities and Exchange Commission (SEC) that allows the fund family to hire, terminate, or materially amend sub-advisory agreements without shareholder approval, subject only to board oversight and ex post disclosure via an information statement (Kirsch (Reference Kirsch2011)).
The risk of termination creates a highly convex payoff structure for outsourced advisors, as they earn nothing if their contract is terminated. Importantly, according to our estimation, each contract is highly valuable as more than 90% of the advisors have three advisory contracts or less. The convexity makes their payoff akin to holding a digital (“binary”) call option on fund returns, where the benchmark return acts as the strike price. This is true even when the external advisor earns an AUM-based fee, as the winner-takes-all (convex) flow-performance relationship in equity mutual funds (e.g., Sirri and Tufano (Reference Sirri and Tufano1998)) ensures that funds near the middle of the benchmark-adjusted performance distribution do not experience material AUM gains. In Section IA.C of the Supplementary Material, we show that the vega of a digital option peaks when the underlying asset’s price is in the neighborhood of the strike price. Therefore, outsourced advisors have a strong incentive to maximize expected payoffs by increasing portfolio risk when the fund’s benchmark-adjusted return hovers around 0. That agents with higher vega in their payoff employ riskier strategies aligns with Khorana (Reference Khorana2001), who demonstrates that career concerns drive managers toward risk-shifting in fund portfolios when faced with the threat of replacement. Similarly, Bollen and Pool (Reference Bollen and Pool2009) find hedge fund returns exhibit discontinuity around 0, as managers, to avoid career concerns or limit excessive capital withdrawals, often avoid reporting small losses, leading to a disproportionately low number of funds with slight losses compared to similar gains.
The incomplete contracting environment complicates efforts to prevent risk-shifting, as advisors’ signals about future returns are non-verifiable, and, crucially, advisors have several tools at their disposal to manipulate portfolio risk. Huang et al. ((Reference Huang, Sialm and Zhang2011), Sec 5) identify some of these methods, including altering cash balances, adjusting tracking error volatility, and increasing exposure to varied risk factors. The problem is magnified by the presence of firm boundaries, which weakens the effectiveness of traditional monitoring mechanisms. Therefore, we believe that the outsourced advisors who are close to their benchmark return have the motive, means, and opportunity to engage in strategic risk-shifting.
Hypothesis 1a. Conditional on the fund performance being close to the benchmark return, advisors of outsourced mutual funds increase their portfolio risk to minimize their employment risk, thereby maximizing their expected future payoff (retention hypothesis).
The compensation contracts offered by investment advisors to portfolio managers—the employees responsible for day-to-day portfolio decisions—differ significantly from those offered by fund families to investment advisors (see Lee et al. (Reference Lee, Trzcinka and Venkatesan2019), Ma et al. (Reference Ma, Tang and Gomez2019)). Unlike investment advisors, portfolio managers often receive compensation tied asymmetrically to fund performance. In our sample, 73% of portfolio managers have bonus components linked to the upside of fund returns.
These asymmetric contracts protect managers from penalties when the fund underperforms its benchmark, creating incentives for risk-taking. Specifically, portfolio managers with asymmetric contracts are more likely to increase portfolio risk later in the year, especially when a fund’s excess return relative to its benchmark hovers near 0 (Lee et al. (Reference Lee, Trzcinka and Venkatesan2019)). While all portfolio managers with performance contracts have both the motive and means to engage in risk-shifting, outsourced fund arrangements, where weaker monitoring is common due to firm boundaries, may offer even greater opportunities for such behavior.
However, outsourced fund advisors are typically small, “owner-manager” firms handling a minimal number of accounts.Footnote 5 In our sample, the median investment advisor has only one mutual fund in their advisory portfolio. This high dependence on retaining each advisory contract makes the marginal benefit of contract renewal very significant. Considering the retention hypothesis of risk-shifting, we expect outsourced funds—regardless of whether portfolio managers have performance-based contracts—to exhibit risk-shifting behavior based on mid-year performance.
Hypothesis 1b. The incentive to retain the advisory contract (retention hypothesis) is binding for the outsourced advisor, regardless of the portfolio manager’s explicit contractual incentives. Consequently, the contract type offered to portfolio managers has no incremental impact on the outsourced advisor’s propensity to engage in risk-shifting (nexus hypothesis).
Although higher risk can correlate with higher returns, excessive risk-taking tends to be sub-optimal, leading to lower risk-adjusted returns. Huang et al. (Reference Huang, Sialm and Zhang2011) confirm that, on average, such sub-optimal increases in mutual fund portfolio risk result in fund underperformance. We empirically test this relation.
Hypothesis 2. Outsourced funds that engage in excessive risk-shifting have a lower risk-adjusted return than other outsourced funds.
While explicit contractual clauses limiting risk-shifting may not be enforceable by third parties, such as courts, fund families have a strong incentive to curb risk-shifting, as it can lead to poor portfolio returns. Moreover, replacing the advisor ex post is expensive due to search costs, relationship-building efforts, and the need for investor communication. Consequently, fund families are likely to take preemptive actions to mitigate risk-shifting. We identify three mechanisms from the literature that are likely effective in “completing” contracts.
Co-branding is a contractual arrangement in which a fund family collaborates with an external advisor to jointly market and manage a fund. Typically, this includes incorporating the outsourced advisor’s name into the fund’s title, leveraging the advisor’s reputation to enhance the fund’s appeal (e.g., Klein and Leffler (Reference Klein and Leffler1981)). This approach not only capitalizes on the advisor’s brand but also aligns the advisor’s incentives with those of the fund family, as the external advisor bears reputational costs for poor performance or deviations from the prescribed strategy (see Moreno et al. (Reference Moreno, Rodriguez and Zambrana2018)).
Hypothesis 3a. Risk-shifting in outsourced funds is diminished when the fund is co-branded.
Hong, Kubik, and Stein (Reference Hong, Kubik and Stein2005) emphasize the role of geographic proximity in facilitating information transmission among professional investors. They find that mutual fund managers located in the same city are more likely to share information through word-of-mouth channels, leading to greater portfolio similarity compared to managers residing in different cities. Pool, Stoffman, and Yonker et al. (Reference Pool, Stoffman and Yonker2015) extend this insight by showing that portfolio overlap is significantly higher among fund managers who are not only in the same city but also in the same neighborhood. They further document that many managers who live in the same city share social networks, and they “frequently” or “sometimes” share investment ideas with other fund managers, including those from different fund families. These findings illustrate how geographic separation can increase the costs of governance and monitoring. Distance between the principal and the agent may reduce the scope for oversight and weaken informal information flows through social and professional networks (see Kang and Kim (Reference Kang and Kim2008), Jensen et al. (Reference Jensen, Kim and Yi2015)). Given that outsourced advisors operate outside the fund company’s internal organizational structure, we expect that the physical distance between the fund company and the advisor will significantly hinder effective monitoring.
Hypothesis 3b. Risk-shifting in outsourced funds is diminished by lower geographical proximity between the fund family and the advisor (co-located).
Our sample includes many outsourced funds co-managed by multiple external advisors. Theory offers competing predictions about how co-management affects risk-shifting. On the one hand, peer monitoring among co-managers can enhance productivity and curb excessive risk-taking (Kandel and Lazear (Reference Kandel and Lazear1992)), address the return disadvantage of sub-advised funds (Moreno et al. (Reference Moreno, Rodriguez and Zambrana2018)), broaden stock holdings, improve performance, and reduce illegal practices such as portfolio pumping (Patel and Sarkissian (Reference Patel and Sarkissian2017), (Reference Patel and Sarkissian2021)). On the other hand, co-managed funds typically adopt a decentralized, sleeve-based structure in which each sub-advisor independently manages a distinct portfolio segment. In such arrangements, the prerequisites for effective peer monitoring—shared information, mutual observability, and joint accountability—are largely absent. Drawing on Sah and Stiglitz (Reference Sah and Stiglitz1988), Csaszar (Reference Csaszar2012) shows that funds with decentralized structures accept more “projects” and commit more errors of commission relative to centralized ones. Cross-firm boundaries further impede information sharing and weaken incentive alignment. Whether co-management mitigates or amplifies risk-shifting, therefore, depends critically on the registrant’s structural choice.
This tension may be resolved by the degree of principal advisor involvement. Greater engagement by the principal advisor can limit risk-shifting by coordinating sub-advisors and preventing style conflicts (Dass, Nanda, and Wang (Reference Dass, Nanda and Wang2013), Broman et al. (Reference Broman, Densmore and Nolan2023)). However, such oversight is costly and unlikely to be uniform across funds. On balance, we predict:
Hypothesis 3c. Risk-shifting in outsourced funds is diminished by the presence of multiple advisors (co-managed).
III. Data and Summary Statistics
We construct our sample from several data sources. Our first source is the Morningstar Direct Mutual Fund database, which covers U.S. domestic equity mutual funds and includes mutual funds’ name, style category, and benchmark. The benchmark is the self-designated index disclosed in each fund’s prospectus. Our sample period begins in January 1999 and ends in December 2024. Data regarding the daily returns of benchmark portfolios also comes from Morningstar. We next match the Morningstar data to the Center for Research in Security Prices (CRSP) Mutual Fund database using the CUSIP number, ticker, or both. The CRSP Mutual Fund database includes fund characteristics, net asset values (NAVs), and returns for each share class at a daily frequency. We use a name-matching algorithm for the remaining unmatched observations. We exclude index funds from the sample using their names and CRSP index fund identifiers. A share class should have at least 200 daily return observations in a year to be included in the sample for the given year.
For funds with multiple share classes, we aggregate across the different share classes to compute fund-level variables using MFLINKS data.Footnote 6 More specifically, we calculate the sum of assets across all share classes and compute the value-weighted average of fund characteristics across share classes. We use the Thomson Reuters Mutual Fund database to compute holding-based measures.
We use N-SAR filings and the new N-CEN filings (post-2017) to collect information on fund advisors and sub-advisors. The information collected includes their name, address, fund family name, and SEC advisor number. We then look up the Form ADV, filed by investment advisory firms, to check the affiliation of the advisor with the fund registrant and that of the sub-advisor(s) with the registrant and the advisor. If the names match or if our review of the Form ADV shows affiliation, we identify the fund as managed in-house; otherwise, we identify it as outsourced. Funds seldom have multiple advisors, but conditional on being sub-advised, it is common that they have multiple sub-advisors. Additionally, following Chen et al. (Reference Chen, Hong, Jiang and Kubik2013), a fund is considered outsourced if at least one of its advisors is external to the fund family. Note that, by our definition, not all sub-advised funds are outsourced. In addition, the lack of a sub-advisor does not preclude it from being outsourced, as the principal advisor could be unaffiliated with the fund family.
Mutual funds disclose the compensation structure of the fund manager(s) in the Statement of Additional Information (SAI). We retrieve the SAI of each fund in our sample from the SEC Electronic Data Gathering, Analysis, and Retrieval (EDGAR) database and classify the contracts into various categories. More precisely, we record whether an incentive bonus exists and whether the bonus is tied to the fund’s investment performance. In addition, by reading the SAI, we can identify the compensation structure of sub-advisors if fund management is outsourced.
Table 1 provides a summary of the key variables. The average in-house fund is 13.4 years old, while the average outsourced fund is 8.9 years old. The expense ratio charged by the two fund types is very similar. Outsourced funds are typically smaller. On average, in-house funds are roughly two times larger than their counterparts. Consequently, the proportion of total industry AUM managed by outsourced funds is relatively modest. Over the past two decades, the number of outsourced funds has steadily increased. By the end of our sample period, over 30% of funds had delegated portfolio management to external advisors.

Table 1 Long description
The table titled Summary of Fund Variables contains nine rows of data across three categories.
* Number of funds: 4,010 for All Funds.
* Number of fund-year observations: 30,573 for In-House; 12,216 for Outsourced; 42,789 for All Funds.
* Turnover ratio percentage: 110.8 for In-House; 61.4 for Outsourced; 92.1 for All Funds.
* Expense ratio percentage: 1.11 for In-House; 1.12 for Outsourced; 1.11 for All Funds.
* Age in years: 13.4 for In-House; 8.9 for Outsourced; 11.83 for All Funds.
* Total net assets T N A in millions: 292.6 for In-House; 150.4 for Outsourced; 239.5 for All Funds.
* Semi-annual return in excess of benchmark percentage: minus 0.357 for In-House; minus 0.407 for Outsourced; minus 0.371 for All Funds.
* Risk adjustment ratio R A R: 0.968 for In-House; 0.976 for Outsourced; 0.970 for All Funds.
* Past year return percentage: 10.54 for In-House; 10.58 for Outsourced; 10.55 for All Funds.
Furthermore, to assess the significance of these advisory contracts, we plot the distribution of the average number of mutual funds managed annually by each external advisor. For each advisor, this value represents the time-series average of the number of funds they manage over our sample period. Figure 1 plots the percentage of advisors in the six non-equal bins. Clearly, bin “1” includes more than 50% of the sample of advisors, indicating that the median advisor manages no more than one outsourced fund. Additionally, more than 90% of advisors manage no more than three funds.
Figure 1 plots the histogram of the average number of funds managed by an advisor of outsourced fund(s) in a given year. The average for any given advisor is the time-series average of the funds such an advisor manages. Bin “1” contains advisors with an average less than or equal to 1; Bin “2” contains advisors with an average greater than 1 but less than or equal to 2; Bin “3” contains advisors with an average greater than 2 but less than or equal to 3; Bin “4” contains advisors with an average greater than 3 but less than or equal to 4; Bin “5” contains advisors with an average greater than 4 but less than or equal to 5; Bin “5–10” contains advisors with an average greater than 5 but less than or equal to 10; and Bin “Above 10” contains advisors with an average greater than 10.

FIGURE 1 Long description
The vertical Y axis is labeled Percent and ranges from 0 to 50 in increments of 10. The horizontal X axis is labeled # of Funds Managed (Custom Bins) and contains seven categories. The data shows a right-skewed distribution with the following values labeled atop each bar:
* Bin 1: 54.137 percent
* Bin 2: 27.305 percent
* Bin 3: 9.6927 percent
* Bin 4: 3.7825 percent
* Bin 5: 2.2459 percent
* Bin 5-10: 2.0095 percent
* Bin Above 10: 0.8274 percent
The frequency decreases significantly from the first bin to the last, with over half of the advisors managing only one fund on average.
IV. Outsourcing and Mutual Fund Risk-Shifting
A. Variable Construction
We quantify risk-shifting by comparing the relative volatility or the volatility of the tracking error. Given that fund performance is judged relative to a benchmark and considering the importance of asymmetric performance bonuses in portfolio manager compensation, if managers attempt to beat the benchmark by increasing portfolio risk, they have to increase the risk of the portfolio relative to the benchmark. To capture changes in portfolio volatility, following Lee et al. (Reference Lee, Trzcinka and Venkatesan2019), we define the risk adjustment ratio
$ RAR $
 as follows:

where
$ {\sigma}_1\left({r}_{j,t}-{b}_{j,t}\right) $
 and
$ {\sigma}_2\left({r}_{j,t}-{b}_{j,t}\right) $
 are the standard deviations of fund
$ j $
 ’s return over the benchmark return for the first 6 months and the second 6 months of the year, respectively. These standard deviations are computed using daily returns and hence provide a much more reliable estimate of the manager’s actions regarding fund volatility. We believe that using higher-frequency data (daily) to measure portfolio risk choices helps alleviate concerns about unobserved managerial actions within the quarter (e.g., Kacperczyk, Sialm, and Zheng (Reference Kacperczyk, Sialm and Zheng2008), Elton, Gruber, Blake, Krasny, and Ozelge (Reference Elton, Gruber, Blake, Krasny and Ozelge2010)). In addition, fund return data is more complete, and using it helps avoid sample attrition due to missing holdings or variation in fund reporting frequencies. Chen, Hughson, and Stoughton (Reference Chen, Hughson and Stoughton2025) also strongly advocate for using such a return-based risk measure. However, for completeness, we also estimate a holdings-based measure of risk-shifting (e.g., Kempf et al. (Reference Kempf, Ruenzi and Thiele2009)) and present those results in the Supplementary Material.
We compute the excess return (
$ Exret $
 ) of each fund over its respective benchmark as the difference between the compounded daily returns of the fund and its benchmark for the duration of the first 6 months. After computing
$ Exret $
 , we measure the distance of the fund’s return from its benchmark return as the square of
$ Exret $
 , giving equal importance to returns above and below the benchmark. Note that
$ RAR $
 is not the ratio of standard deviations first analyzed by Brown et al. (Reference Brown, Harlow and Starks1996). Instead, this is the ratio of tracking errors relative to the fund’s self-selected benchmark. In Figure 2, we partition the excess return distribution and plot the average
$ RAR $
 values for the different regions by fund type. This simple univariate plot showcases one of the central insights of our article. All fund types, on average, increase their portfolio risk the most when their mid-year performance is close to the benchmark. However, in that interval, the outsourced funds (solid line) increase their portfolio risk much more than the in-house managed funds (dotted line).
Figure 2 plots the average
$ RAR $
 value for the different partitions of the excess return distribution. The variable
$ RAR $
 is the ratio of the tracking error, as in equation (1). Excess return is the difference between a fund’s return and its self-reported benchmark. Funds are grouped into one of nine bins. Funds are grouped under the <−2.5
$ \sigma $
 category if their mid-year returns are more than 2.5 standard deviations below 0. Funds with mid-year returns between 2.5 standard deviations and 1 standard deviation below 0 are grouped under −2.5
$ \sigma $
 ; between 1 standard deviation and 0.25 standard deviations below 0 are under −1
$ \sigma $
 ; between 0.25 standard deviations below the benchmark and 0 are under −0.25
$ \sigma $
 ; between 0 and 0.5 standard deviations above the benchmark are under the bin 0; between 0.5 standard deviations and 1 standard deviation are in 0.5
$ \sigma $
 ; between 1 standard deviation and 1.75 standard deviations are in 1
$ \sigma $
 ; between 1.75 standard deviations and 2.5 standard deviations are in 1.75
$ \sigma $
 ; and those above 2.5 standard deviations are in 2.5
$ \sigma $
 . The average value for each bin, by management type, is plotted.

FIGURE 2 Long description
The x-axis represents Excess Return, divided into nine bins: less than -2.5 sigma, -2.5 sigma, -1 sigma, -0.25 sigma, 0, 0.5 sigma, 1 sigma, 1.75 sigma, and 2.5 sigma. The y-axis represents Average R A R by Group, ranging from 0.85 to 1.1. A horizontal green reference line is set at 1.0.
Two data series are plotted:
* In-House funds (dashed line): Starts at approximately 0.84 for the lowest bin, rises steadily to a peak of nearly 1.1 at the 0 bin, and then declines to approximately 0.88 at the 2.5 sigma bin.
* Outsourced funds (solid line): Starts higher than in-house at approximately 0.89, follows a similar upward trajectory to peak slightly above 1.1 at the 0 bin, and then declines more sharply than the in-house line, ending lower at approximately 0.85 at the 2.5 sigma bin.
Both lines exhibit an inverted U-shape, peaking at the 0 bin where excess return is neutral, and falling as returns move further from the benchmark in either direction.
B. Panel Regressions
1. Retention Hypothesis
We now examine the risk-shifting behavior of in-house and outsourced funds using a regression approach. Following Lee et al. (Reference Lee, Trzcinka and Venkatesan2019), we begin by estimating the following pooled ordinary least square (OLS) model:

The dependent variable,
$ {RAR}_{j,t} $
 , is the change in fund risk relative to a benchmark between the first and second halves of year
$ t $
 . The key explanatory variable in equation (2),
$ Distance $
 , is given as the square of the excess return (
$ Exret $
 ) and captures how far the excess return lies from 0. The additional control variables are the expense ratio (
$ Exp\hskip0.1em ratio $
 ), the turnover ratio (
$ Turn\ \ ratio $
 ), the percentage of flows into the fund during the first 6 months of the year (
$ Flows $
 ), the log of the number of years since fund inception (
$ Log\hskip0.22em age $
 ), the compounded return of the fund for the previous calendar year (
$ Past\ Return $
 ), and the log of total AUM (
$ Log\hskip0.22em size $
 ). These variables are all evaluated at the beginning of the calendar year. Kempf et al. (Reference Kempf, Ruenzi and Thiele2009) argue that managerial risk-taking changes as a function of the state of the economy. To account for this temporal variation, all of the specifications include time-fixed effects.
Most mutual fund managers are compensated based on performance relative to a benchmark, and these contracts are typically asymmetric: managers are not penalized for underperformance, which incentivizes greater risk-taking. Lee et al. (Reference Lee, Trzcinka and Venkatesan2019) show that, consistent with this asymmetry, risk-shifting in the second half of the year is inversely related to the distance between portfolio return and the benchmark return. We expect the coefficient
$ {c}_1 $
 to be negative and statistically different from 0.
$ {I}_{Outsourced} $
 is a dummy variable which takes the value of 1 if the fund is outsourced, and 0 otherwise. The retention hypothesis of risk-shifting predicts that outsourced funds, if anything, would strategically take on more risk as the trade-offs from retaining or losing the advisory contract are very large. Therefore, we expect the interaction coefficient of
$ Distance $
 and
$ {I}_{Outsourced} $
 ,
$ {c}_2 $
 , to have a negative sign.
Table 2 presents the results from the pooled OLS regression, with standard errors clustered by fund to account for correlation in the error terms. In column 1, the negative
$ Distance $
 coefficient confirms the main finding of Lee et al. (Reference Lee, Trzcinka and Venkatesan2019) that risk-shifting is strongest in the region in which the fund’s return is close to the benchmark’s return. In column 2, we examine the key hypothesis of this article by adding the interaction term between
$ Distance $
 and management outsourcing dummy (
$ {I}_{outsourced} $
 ). The negative coefficient on the interaction term indicates that the outsourced funds, when compared to the in-house funds, strategically increase portfolio risk more in the second half of the year to maximize the value of their payoff. Interestingly, the magnitude of the coefficient on the interaction term is almost as large as the point estimate on
$ Distance $
 . This suggests that the outsourced funds risk-shift almost twice as much as in-house managed funds. The magnitude of the reported coefficients is dampened by the inclusion of the COVID-19 pandemic year, 2020, which had one of the lowest
$ RARs $
 in our sample. For robustness, in Section IA.D of the Supplementary Material, we also provide results excluding this period. The evidence supports the interpretation that the attenuation is concentrated only in the initial pandemic year rather than reflecting a persistent structural change.

Table 2 Long description
The table presents regression results for R A R sub i, t across six columns. Columns 1 and 2 use O L S. Columns 3 and 4 use Quantile Regression Q t l. Column 5 focuses on Outsourced funds, and Column 6 on In-House funds.
Key variables and coefficients include:
* Distance: Values range from -0.686 to -1.805, all significant at the 1 percent or 5 percent level.
* Distance times I sub outsourced: -0.790 in column 2 and -0.501 in column 4, both significant at 5 percent.
* Distance times I sub performance: 0.480 in column 5 and -0.801 in column 6 (significant at 5 percent).
* I sub outsourced: Coefficients are near zero and statistically insignificant across columns 1 through 4.
* Exret: Positive coefficients ranging from 0.096 to 0.164, mostly significant at the 1 percent level.
* Exp ratio: Positive coefficients, significant in columns 1 through 4 (0.473 to 0.515).
* PastReturn: Significant positive correlation for outsourced funds (0.091) and significant negative correlation for in-house funds (-0.036).
Bottom rows show:
* Observations: 41,112 for columns 1-4; 8,428 for column 5; 19,022 for column 6.
* Adjusted or Pseudo R-squared: Values range from 0.37 to 0.59.
Standard errors are provided in parentheses below each coefficient. Significance levels are indicated by asterisks: * for 10 percent, ** for 5 percent, and *** for 1 percent.
In columns 3 and 4 of Table 2, we present the results from a quantile regression model (at the median) with bootstrapped standard errors as an alternative to the OLS specification. The robustness of quantile regression to any potential outliers merits its use. The coefficient of
$ Distance $
 is statistically significant and negative, suggesting that for the median manager, the portfolio risk in the second half of the year will decrease as the portfolio’s return deviates from the benchmark’s return. More importantly, the coefficient on the interaction term is still negative and highly significant. Also, consistent with the OLS results, the magnitude of the interaction term is similar to the main effect. These results clearly establish that managers of outsourced firms strategically engage in incremental risk-shifting.
To further highlight variation in managers’ risk-shifting responses, we estimate a piecewise linear specification. In Section IA.E of the Supplementary Material, we partition the support of the performance distribution into four regions and allow for region-specific slopes. The results in Table IA.2 in the Supplementary Material reinforce the interpretation that outsourced managers respond strategically to convex incentive structures: they do not uniformly increase risk, but instead shift risk selectively in regions where the marginal value of doing so is greatest.
2. Nexus Hypothesis
We next evaluate whether the nexus hypothesis of risk-shifting, which relies on the explicit compensation incentive of portfolio managers and weaker monitoring due to the presence of firm boundaries, plays any role in explaining the aforementioned results. Note that the two incentives, advisory contract retention and compensation maximization, are not mutually exclusive. To test this hypothesis, we hand-collect information on the portfolio manager compensation structure from 2005 to 2024 and capture the cross-sectional variation in compensation by segmenting our sample into two contract types. The first type is a group of funds that clearly state that portfolio manager compensation is not tied to fund performance. The second type includes funds whose managers are paid based on fund performance. Mostly, the second group consists of funds that clearly specify that the manager’s compensation is based on performance relative to a specific benchmark.
$ {I}_{performance} $
 is a dummy variable that takes the value of 1 when the manager has a performance-based contract, and 0 otherwise. Consistent with Lee et al. (Reference Lee, Trzcinka and Venkatesan2019), about 27% of our sample do not have performance-based compensation.
In columns 5 and 6 of Table 2, we focus on the subsample of outsourced and in-house funds, respectively. The interaction between Distance and
$ {I}_{performance} $
 is our main variable of interest as it helps ascertain whether explicit compensation incentives are associated with incremental risk-shifting decisions. For the outsourced sample, the coefficient on the interaction term is statistically indistinguishable from 0. In other words, their explicit risk-shifting incentives arising from the compensation contracts do not dictate the portfolio risk choice. On the other hand, in column 6, managers of the in-house managed funds, who do not face high-powered incentive contracts and the related employment risk, appear to maximize the vega of the option explicit in their compensation contract. The coefficient on the interaction term is negative, suggesting that those with performance-based incentives engage in more strategic mid-year risk-shifting.
Overall, our results support the hypothesis that the implicit optionality introduced by the high-powered incentive contract has a significant impact on the strategic actions of external advisors. In the case of an outsourced advisor, the motivation to retain the contract is more binding than the incentive to exploit the convexity in the compensation contract.
C. Causal Effect of Outsourcing
Our results thus far do not claim a causal impact of outsourcing on fund risk-shifting. It is possible, although unlikely, that the fund family’s decision to outsource the fund management is endogenous to the portfolio manager’s decision to increase the portfolio risk. If true, this could bias the coefficient estimates. Below, we present two different approaches to get around the potential endogeneity and establish that, indeed, the outsourcing status of the fund has a causal impact on the strategic risk-taking.
1. Instrumental Variables Analysis
We begin with the instrumental variable methodology. Our approach is well motivated by Chen et al. (Reference Chen, Hong, Jiang and Kubik2013), who propose an instrument for whether a fund is outsourced based on the number of other funds that the fund family offered at the time of inception of the fund (
$ {LogFamFunds}_{i,0} $
 ), controlling for family asset size. The basic idea behind this approach is that, as fund families increase their product offerings relative to their family size, they are more likely to hit the capacity constraints and hire external advisors.
We begin our empirical test by running the first-stage regression. We intend to establish that the number of funds in the fund family at the time of inception is highly correlated with the outsourcing status of the fund. Given that the unit of analysis in the second stage is at the fund-year level, we run the following specification using a similar level of data:

where
$ {Outsourced}_{i,t} $
 is a dummy variable that equals 1 if fund
$ i $
 is outsourced in year,
$ t $
 and 0 otherwise,
$ {LogFamFunds}_{i,0} $
 is the natural log of 1 plus the number of funds in the family at the inception of the fund, and
$ {LogFamFunds}_{i,t} $
 is the natural log of 1 plus the number of funds in the family in year
$ t $
 . The subscript 0 is used to denote the time when the fund was started. In addition, we include percentile dummies for the size of the fund family when the fund was launched (
$ {FamSizeDummies}_{i,0} $
 ), and the natural log of family size (AUM) for year
$ t $
 (
$ {LogFamSize}_{i,t} $
 ). Other fund-level control variables (
$ {X}_{i,t} $
 ) are also included along with the dummies for each year in our sample. We use the conditional logit estimator to precisely account for unobserved time-invariant heterogeneity and estimate the conditional probability that the fund will be outsourced.
$ \Gamma (.) $
 in equation (3) represents the logistic distribution function.
The results of the first-stage regression are presented in Table 3. In column 1, the positive coefficient on
$ {LogFamFunds}_{i,0} $
 confirms our earlier expectation and is consistent with what Chen et al. (Reference Chen, Hong, Jiang and Kubik2013) also find. Families that have to manage a higher number of funds do outsource more. In fact, this is not just true of the number of funds at inception but, based on the coefficient of
$ {LogFamFunds}_{i,t} $
 , also true of the number of funds currently managed. Furthermore, the statistical significance of the coefficient estimate rules out any concerns regarding the suitability of the instrument.

Table 3 Long description
A table presenting logit regression results across three columns.
Column 1: Dependent variable is Outsourced.
Column 2: Dependent variable is Derivative Use.
Column 3: Dependent variable is Broader Constraints.
Key independent variables and their coefficients (standard errors in parentheses):
- Log Fam Funds At Inception: 0.220*** (0.015) in Col 1; -0.003 (0.024) in Col 2; 0.017 (0.031) in Col 3.
- Log Fam Fund: 0.188*** (0.070) in Col 1; -0.337*** (0.068) in Col 2; -0.231*** (0.061) in Col 3.
- Log Fam Size: 0.007 (0.015) in Col 1; 0.096*** (0.030) in Col 2; 0.002 (0.026) in Col 3.
- Log size: 0.013*** (0.009) in Col 1; 0.056*** (0.016) in Col 2; 0.110*** (0.012) in Col 3.
- Log age: -0.078*** (0.027) in Col 1; 0.145*** (0.043) in Col 2; 0.094** (0.045) in Col 3.
- Exp ratio: 2.565*** (0.747) in Col 1; -13.654*** (4.474) in Col 2; 25.788*** (4.512) in Col 3.
- Turn ratio: 0.003*** (0.001) in Col 1; -0.001*** (0.001) in Col 2; 0.001** (0.001) in Col 3.
- Past Return: 0.038 (0.028) in Col 1; -0.126 (0.128) in Col 2; -0.132 (0.197) in Col 3.
- Flows: -0.019*** (0.023) in Col 1; -0.020 (0.036) in Col 2; -0.069 (0.038) in Col 3.
Summary Statistics:
- Observations: 32,561 (Col 1); 28,498 (Col 2); 22,592 (Col 3).
- Pseudo R super 2: 0.02 (Col 1); 0.07 (Col 2); 0.09 (Col 3).
Significance levels: * p < 0.10, ** p < 0.05, *** p < 0.01.
For
$ {LogFamFunds}_{i,0} $
 to be a valid instrument, it must also satisfy the exclusion restriction—that is, it must affect
$ {RAR}_{i,t} $
 only through the fund’s outsourcing status (the endogenous regressor), with no direct influence. It is unlikely that a fund family’s past decision (i.e.,
$ {LogFamFunds}_{i,0} $
 ) would directly influence a portfolio manager’s incremental risk-taking today. However, it is possible that
$ {LogFamFunds}_{i,0} $
 proxies for deeper family-level organizational design choices—such as latent monitoring structures—that may affect portfolio oversight regardless of outsourcing status.Footnote 7 While the exclusion restriction is fundamentally untestable, to strengthen the validity of our instrument, we perform a falsification test using a fund characteristic plausibly associated with monitoring but unlikely to be affected by the outsourcing decision: derivative use. Specifically, we regress a fund’s use of derivatives on the instrument, controlling for a rich set of fund characteristics. If the instrument had a direct effect on risk-taking through this alternative channel, we would expect a statistically significant relationship between these variables.
We obtain data on derivative use from NSAR filings, where funds report whether they use financial derivatives such as options or futures. Since responses are binary (“Yes” or “No”), we choose logistic regression design. We estimate the same model as in equation (3), with
$ Derivative\;{Use}_{i,t} $
 as the dependent variable—an indicator equal to 1 if the fund uses any derivatives (options, futures, or both), and 0 otherwise. These results are reported in column 2 of Table 3. Some observations are lost due to a lack of within-family variation in derivative use, but overall we find no statistically significant relationship between
$ {LogFamFunds}_{i,0} $
 and derivative use.
We also leverage additional information from the NSAR forms to construct a broader indicator variable, capturing whether a fund uses derivatives, engages in short selling, buys on margin, or invests in restricted shares. This extended outcome is also binary and serves as the dependent variable in column 3 of Table 3. Again, we find no evidence of a significant association. These falsification tests bolster our interpretation that the past number of funds in a family affects risk-shifting only through outsourcing decisions. That is, fund families with more funds at inception do not appear to differ systematically in their approach to risk management or future risk-taking, except through their decision to outsource.
After establishing the first-stage regression result, we move on to the next step by implementing a two-stage residual inclusion (2SRI) approach. This is the ideal approach since we use a nonlinear estimation in the previous stage. We use the following specification for the second stage:

where
$ FirstStageResiduals $
 is the residuals from the estimation of equation (3). We include all explanatory variables from the first stage in our second-stage regression except for our instrument,
$ {LogFamFunds}_{i,0} $
 .
Table 4 reports the second-stage results from the 2SRI approach. After controlling for the first-stage residuals, the coefficient on
$ Distance $
 remains negative and statistically significant, as does its interaction with the outsourcing indicator, consistent with our baseline findings. Importantly, the magnitude of these coefficients remains largely unchanged when instrumenting for outsourcing. The coefficients on the
$ FirstStageResiduals $
 and the interaction with
$ Distance $
 are statistically insignificant, suggesting that unobserved factors influencing outsourcing have a limited impact on funds’ risk-taking decisions, thereby alleviating endogeneity concerns. Overall, the 2SRI estimates support a causal effect of outsourcing on risk-shifting behavior.

Table 4 Long description
The table compares two models: O L S: R A R sub i, t and Q T L: R A R sub i, t. For each variable, the point estimate is listed first, followed by the standard error in parentheses below it.
* Distance: -0.786*** (0.094) for O L S; -0.662*** (0.103) for Q T L.
* Distance times I sub outsourced: -1.179** (0.502) for O L S; -0.653** (0.319) for Q T L.
* I sub outsourced: 0.001 (0.078) for O L S; 0.001 (0.003) for Q T L.
* Exret: 0.098*** (0.030) for O L S; 0.064*** (0.020) for Q T L.
* Turnratio: 0.001 (0.001) for O L S; 0.001 (0.001) for Q T L.
* Expratio: 0.300** (0.144) for O L S; 0.402 (0.297) for Q T L.
* Flows: -0.001* (0.001) for O L S; -0.001 (0.001) for Q T L.
* Log age: 0.007 (0.006) for O L S; 0.001 (0.001) for Q T L.
* PastReturn: 0.023 (0.023) for O L S; 0.013*** (0.001) for Q T L.
* Log size: -0.001 (0.002) for O L S; -0.001 (0.001) for Q T L.
* LogFamFund: -0.009 (0.009) for O L S; -0.001 (0.002) for Q T L.
* LogFamSize: 0.004 (0.003) for O L S; -0.001 (0.001) for Q T L.
* FirstStageResiduals: -0.009 (0.076) for O L S; -0.001 (0.006) for Q T L.
* Distance times FirstStageResiduals: 0.834 (0.553) for O L S; 0.169 (1.045) for Q T L.
* Observations: 32,558 for both models.
* Adjusted or Pseudo R-squared: 0.49 for O L S; 0.35 for Q T L.
2. Matching Analysis
To strengthen the causal interpretation and overcome any selection issues, we use a matching approach and pair each outsourced fund (treated) to an observationally similar non-outsourced fund (control), based on size, age, expense ratio, turnover, flows, and prior-year returns. We further require that the treated fund and the matched control fund are in the exact same year and have the same fund style, as this creates a more precise match. Figure IA.1 in the Supplementary Material demonstrates that the matching procedure achieves strong covariate balance, with the two groups becoming highly similar along observable dimensions. While we cannot rule out the possibility that treated funds are different from controls along some unobserved dimensions, we can reasonably assume that, conditional on these important observable characteristics, assignments to the treatment and control groups are random. Thus, the only difference between the two groups is the outsourcing status.
We repeat the earlier regression analysis on the matched sample to test whether the treated (outsourced) funds in fact shift risk significantly more. In column 1 of Table 5, we use a greedy matching algorithm to match the treated with the control sample. In column 2, we use an optimal matching algorithm (nearest-neighbors) with replacement. As in the previous regression results, the coefficient on the interaction term is negative and statistically significant in the greedy matching analysis. The statistical significance of the coefficient from the optimal matching analysis, however, is somewhat weaker. Overall, these results confirm our hypothesis that, on average, outsourcing status, along with mid-year performance, has a causal effect on the mutual fund risk-shifting decision.

Table 5 Long description
The table presents pooled regression results for a matched sample where the dependent variable is R A R sub i, t. It compares two matching methods: Column 1 (Greedy Match) and Column 2 (Replace Match).
* Distance: -0.765 (standard error 0.091) in Column 1; -0.816 (standard error 0.093) in Column 2. Both significant at 1 percent.
* Distance times I sub outsourced: -0.725 (standard error 0.305) in Column 1, significant at 5 percent; -0.616 (standard error 0.328) in Column 2, significant at 10 percent.
* I sub outsourced: 0.001 (standard error 0.004) in both columns.
* Exret: 0.109 (standard error 0.069) in Column 1; 0.096 (standard error 0.070) in Column 2.
* Turnratio: 0.001 (standard error 0.001) in both columns.
* Expratio: 0.313 (standard error 0.143) in Column 1, significant at 5 percent; 0.529 (standard error 0.154) in Column 2, significant at 1 percent.
* Flows: -0.001 (standard error 0.001) in both columns, significant at 5 percent.
* Log age: -0.001 (standard error 0.002) in both columns.
* PastReturn: 0.024 (standard error 0.018) in Column 1; 0.028 (standard error 0.018) in Column 2.
* Log size: -0.004 (standard error 0.001) in both columns, significant at 1 percent in Column 1 and 5 percent in Column 2.
* Observations: 25,462 in Column 1; 26,871 in Column 2.
* R super 2: 0.53 in both columns.
3. Employment Risk: Explaining the Variation in Risk-Shifting
In this section, we use the variation in the scale and scope of external advisors’ operations to highlight further the role of the retention hypothesis on mid-year risk-shifting. Debaere and Evans (Reference Debaere and Evans2015) document that the limited access to mutual fund investment dollars through marketing and distribution channels leads the outsourced advisors to manage an external fund rather than starting their own fund. The limited visibility in the retail space (i.e., due to a specialty in managing institutional accounts) may incentivize external advisors to manage funds through sub-advising for large fund families. This observation motivates us to examine the extent of risk-shifting across the different types of external advisors. If the external advisor already enjoys a superior reputation in the management outsourcing industry, maintaining a less volatile track record will create a positive spillover effect in attracting fund flows (Nanda, Wang, and Zheng (Reference Nanda, Wang and Zheng2004)). Furthermore, this can lead to a reputation-stretching strategy in terms of future outsourcing arrangements (Chen and Lai (Reference Chen and Lai2010)).
We introduce two variables to capture the variation in advisor attributes. First,
$ AdvSize $
 is defined as the log demeaned total AUM of the advisor. Second, we create a dummy variable,
$ {I}_{AdvCount} $
 , which takes the value of 1 when the total number of funds under the management of the advisor is greater than the median number, and 0 otherwise. Our expectation is that advisors who have higher AUM and advisors who manage a higher number of funds should care less about losing an advising contract as the marginal utility of the payoff from that contract is lower to them. In addition, such advisors would also care more about reputation building and maintaining a smooth track record.
Columns 1 and 2 of Table 6 report estimates of the three-way interactions,
$ \left( Distance\ast {I}_{outsourced}\ast AdvSize\right) $
 and
$ \left( Distance\ast {I}_{outsourced}\ast {I}_{AdvCount}\right) $
 , which capture how risk-shifting varies with advisor characteristics. The results indicate that more established advisors engage in less risk-shifting. The count-based measure of advisor scale yields more robust results than the AUM-based measure. This contrast is economically intuitive, as the number of accounts an advisor manages more directly captures the diversification of their business across clients, thereby weakening the retention incentive for that contract. Given the skewness in fund sizes, advisors with large AUM, by contrast, may concentrate their aggregate AUM in a small number of relationships, making the count measure a cleaner proxy for the marginal cost of losing one contract. Overall, this evidence provides strong support for the retention hypothesis, as proxies for lower employment risk and reputational concerns reduce the incentive to take on excessive risk.

Table 6 Long description
The table presents regression results for two specifications. The dependent variable is the ratio of the standard deviation of tracking error.
Key variables and their coefficients (standard errors in parentheses) for Model 1 and Model 2 respectively:
* Distance: -0.850*** (0.121) and -0.767*** (0.083).
* Distance times I sub outsourced: -0.971** (0.386) and -1.406*** (0.446).
* Distance times I sub outsourced times AdvSize: 0.095* (0.053) in Model 1 only.
* Distance times I sub outsourced times I sub AdvCount: 2.595*** (0.718) in Model 2 only.
* I sub outsourced times AdvSize: 0.001 (0.001) in Model 1.
* I sub outsourced times I sub AdvCount: -0.006 (0.011) in Model 2.
* Distance times AdvSize: -0.013 (0.027) in Model 1.
* Distance times I sub AdvCount: -2.017*** (0.391) in Model 2.
* I sub outsourced: 0.001 (0.008) and 0.002 (0.009).
* Exret: 0.121*** (0.029) and 0.126*** (0.028).
* Turnratio: 0.001 (0.001) for both.
* Expratio: 0.490*** (0.174) and 0.488*** (0.177).
* Flows: -0.001 (0.001) for both.
* Log age: 0.008 (0.005) and 0.007 (0.005).
* PastReturn: 0.019 (0.023) and 0.020 (0.023).
* Log size: 0.001 (0.001) for both.
* AdvSize: 0.001 (0.002) in Model 1.
* I sub AdvCount: 0.002 (0.006) in Model 2.
Summary statistics for both models:
* Observations: 32,611.
* R super 2: 0.52.
Significance levels: * p < 0.10, ** p < 0.05, *** p < 0.01.
D. Outsourcing, Risk-Shifting, and Fund Performance
Thus far, we have demonstrated that advisors strategically choose to manipulate portfolio risk as it is optimal from their perspective of maximizing payoff. However, excessive risk-taking can be suboptimal for the fund investors. Huang et al. (Reference Huang, Sialm and Zhang2011) show that, on average, mutual funds that increase risk perform worse than funds that keep risk levels stable over time. Therefore, we now test whether increased risk-shifting is related to the poor performance of outsourced mutual funds.
For each quarter, we compute the fund’s quarterly alpha by compounding the monthly alpha. The monthly alphas are computed using factor betas estimated over a rolling 12-month window. We estimate the alpha using both the Fama–French 3-factor and the Carhart 4-factor models. We closely follow the specification used in Chen et al. (Reference Chen, Hong, Jiang and Kubik2013) and first evaluate how the fund’s outsourcing status and other characteristics are related to its next quarter’s performance. Table 7 reports the estimates from Fama–Macbeth regression where the standard errors are adjusted for serial correlation using the Newey-West approach with lags of order 3.

Table 7 Long description
The table presents Fama-MacBeth estimates for quarterly fund alphas. The columns are divided into Alpha 3-factor (Columns 1 and 2) and Alpha 4-factor (Columns 3 and 4).
Key variables and their coefficients (standard errors in parentheses):
* I sub outsourced: -0.066*** (0.021) in Col 1; -0.037* (0.022) in Col 2; -0.056*** (0.019) in Col 3; -0.035* (0.020) in Col 4.
* High R A R times I sub outsourced: -0.152*** (0.053) in Col 2; -0.114** (0.046) in Col 4.
* High R A R: 0.082 (0.066) in Col 2; 0.047 (0.051) in Col 4.
* Turn ratio: 0.001 (0.001) across all columns.
* Exp ratio: -0.298*** (0.059) in Col 1; -0.293*** (0.059) in Col 2; -0.303*** (0.065) in Col 3; -0.301*** (0.066) in Col 4.
* Flows: 0.200 (0.161) in Col 1; 0.185 (0.172) in Col 2; 0.201 (0.140) in Col 3; 0.197 (0.147) in Col 4.
* Log age: -0.019 (0.019) in Col 1; -0.018 (0.019) in Col 2; -0.011 (0.021) in Col 3; -0.011 (0.021) in Col 4.
* Log size: -0.005 (0.012) in Col 1; -0.004 (0.012) in Col 2; -0.011 (0.011) in Col 3; -0.010 (0.011) in Col 4.
* Past Return: 2.848*** (0.770) in Col 1; 2.864*** (0.772) in Col 2; 2.191*** (0.649) in Col 3; 2.179*** (0.653) in Col 4.
Summary statistics:
* Observations: 154,345 for Cols 1 and 3; 152,419 for Cols 2 and 4.
* R-squared: 0.05 for Cols 1 and 2; 0.04 for Cols 3 and 4.
Significance levels: * p < 0.10, ** p < 0.05, *** p < 0.01.
Columns 1 and 3 present the results for the 3-factor and the 4-factor models, respectively. Consistent with previous literature, funds that performed well over the last 12 months continue to outperform in the next quarter. Also, funds that have a higher expense ratio tend to have lower alphas. However, importantly, consistent with the findings in Chen et al. (Reference Chen, Hong, Jiang and Kubik2013), we find that outsourced funds underperform in-house funds by about 6.6 basis points a quarter. To test the impact of risk-shifting on the performance of outsourced funds, we introduce a new variable,
$ HighRAR $
 . This dummy variable takes the value of 1 if the fund’s quarterly RAR is in the top quintile of the cross-sectional RAR distribution. The variable
$ HighRAR $
 takes the value of 0 otherwise. In columns 2 and 4, when we interact the
$ HighRAR $
 dummy variable with the outsourcing dummy variable, we find that the effect of outsourcing on performance diminishes both statistically and economically. Instead, the interaction term now accounts for most, but not all, of the underperformance. This is consistent with the interpretation that excessive risk-shifting is one of the primary drivers of outsourced fund underperformance, while a modest residual performance gap may reflect other frictions associated with the outsourcing arrangement. Overall, the economic magnitude of underperformance is quite significant as these funds underperform their peer group, funds that are managed in-house and do not risk-shift excessively, by 15.2 (11.4) basis points per quarter when using the 3-factor (4-factor) evaluation model.
V. Management Arrangement and Risk-Shifting
Our analysis reveals that the presence of firm boundaries, combined with the implicit optionality in the payoff structures of outsourced funds, often leads to suboptimal portfolio choices and poor fund performance. The severity of the distortion in risk choice can be both accentuated and mitigated by the presence of various contractual features. As a next step, we leverage variation in the outsourcing environment to examine whether proposed contractual arrangements are statistically associated with attenuated principal-agent frictions.
A. Co-Branding of Fund Names
Co-branding is a form of contractual arrangement where the fund family partners with an outside advisor to market and manage the fund jointly. A typical arrangement is one where the name of the outsourced advisor is included in the name of the fund. Often, this is done to extract value from the reputation of the external advisor. An advisor’s reputation can be essential to their identity, influence future capital raising, or both. In addition, such a mechanism acts as an effective tool to align the incentive of the external advisor to that of the fund family, as there are reputation costs borne by the external advisor for poor performance or for any deviation from the prescribed strategy (see Klein and Leffler (Reference Klein and Leffler1981), Moreno et al. (Reference Moreno, Rodriguez and Zambrana2018)). Therefore, we expect co-branded funds to engage in significantly less risk-shifting.
To test Hypothesis 3a, we create a new dummy variable,
$ {I}_{\left\{ Co- brand\right\}} $
 , that takes the value of 1 if the fund is co-branded, and 0 otherwise. The fund is classified as co-branded when at least part of the external advisor’s name is included in the fund name. In our sample, 36% of the outsourced funds are co-branded.
In Table 8, the point estimate on
$ Distance $
 (−2.875) clearly indicates that outsourced funds risk-shift. However, importantly, the coefficient on the two-way interaction term,
$ Distance $
 *
$ {I}_{\left\{ Co- brand\right\}} $
 , is positive and statistically significant. The magnitude of the interaction coefficient suggests that a co-branded fund engages in 63% less risk-shifting than the average outsourced fund. Overall, this is consistent with our hypothesis that co-branding, as a contractual mechanism, mitigates risk-shifting incentives.

Table 8 Long description
The table presents results from a pooled O L S regression where the dependent variable is R A R sub i, t. The data column contains point estimates with standard errors in parentheses below them.
* Distance: -2.875*** (0.572)
* Distance times I sub Co-brand: 1.831** (0.737)
* I sub Co-brand: -0.012 (0.013)
* Exret: 0.059 (0.055)
* Turnratio: -0.001 (0.001)
* Expratio: 0.387*** (0.117)
* Flows: -0.001 (0.001)
* Log age: 0.008 (0.011)
* PastReturn: 0.063* (0.033)
* Log size: 0.001 (0.003)
* Log SubAdvisor: -0.004 (0.011)
* Observations: 9741
* R-squared: 0.51
Significance levels are indicated by asterisks: * for 10%, ** for 5%, and *** for 1%.
B. Co-Location of Fund Advisor and Registrant
The impact of geography on agency costs is fairly well-established in the literature (see Kang and Kim (Reference Kang and Kim2008), Jensen et al. (Reference Jensen, Kim and Yi2015)). Hypothesis 3b relates to this idea and argues that when fund families outsource to geographically proximate advisors, the extent of risk-shifting is attenuated. To empirically test this, we compute the geospatial distance (
$ GeoDistance $
 ) between the legal addresses of the fund registrant and the advisor. When there are multiple advisors, we use the distance to the closest advisor to measure the spatial distance.
Using our aforementioned empirical model, we test whether the geospatial distance exacerbates risk-shifting among outsourced funds. To make the interpretation of our analysis easier, we define two dummy variables,
$ {I}_{\left\{ High- GeoDistance\right\}} $
 and
$ {I}_{\left\{ In- State\right\}} $
 . First,
$ {I}_{\left\{ High- GeoDistance\right\}} $
 takes the value of 1 if the distance between the registrant and the fund advisor is above the median, and 0 otherwise. In addition to using the distance, we create the second dummy variable
$ {I}_{\left\{ In- State\right\}} $
 , which takes the value 1 if the registrant and the fund advisor are located in the same state. Approximately 26% of the outsourced funds have their external advisor in the same U.S. state as the fund is registered.
Consistent with our expectations, in Table 9, we find that geographical proximity also matters. While we observe that outsourced funds risk-shift, the negative coefficient on the two-way interaction term in column 1 shows that when fund advisors, the agent, are located farther than the median distance from the fund registrant, the principal, they strategically take more risk.Footnote 8 Results in column 2 are also consistent with this finding. When the advisors are located out of state, the extent of the risk-shifting is heightened.

Table 9 Long description
The table presents regression results for the dependent variable R A R sub i, t across three specifications.
* Column 1 (Model 1): Distance has a coefficient of -1.754 (standard error 0.431, significant at 1%). The interaction of Distance and I sub High-GeoDistance is -1.476 (standard error 0.633, significant at 5%). I sub High-GeoDistance is 0.006 (0.012).
* Column 2 (Model 2): Distance is -3.004 (0.468, significant at 1%). The interaction of Distance and I sub In-State is 1.320 (0.684, significant at 10%). I sub In-State is -0.009 (0.011).
* Column 3 (Model 3): Distance is -2.241 (0.468, significant at 1%). The interaction of Distance and I sub High-GeoDistance is -1.754 (0.687, significant at 5%). The triple interaction of Distance, I sub High-GeoDistance, and I sub StyleCohort is 2.274 (2.292).
Control variables across all models include:
* Exret: 0.145 (Model 1), 0.142 (Model 2), 0.102 (Model 3).
* Turnratio: 0.001 (significant at 5% in all models).
* Expratio: 0.212 (Model 1), 0.203 (Model 2), 0.254 (Model 3).
* Flows: -0.001 in all models.
* Log age: 0.013 (Model 1 and 2), 0.011 (Model 3).
* PastReturn: 0.061 (Model 1), 0.062 (Model 2 and 3), all significant at 10%.
* Log size: -0.002 (Model 1), -0.001 (Model 2), 0.001 (Model 3).
Summary statistics:
* Observations: 9709 for Models 1 and 2; 7278 for Model 3.
* R-squared: 0.52 for Models 1 and 2; 0.51 for Model 3.
While our data do not allow us to isolate the precise mechanism through which co-location improves monitoring, we view it as one of several heterogeneous channels through which fund families can maintain control over outsourced advisors. Effective monitoring can also emerge from other organizational features. We test one such feature: the presence of a “cohort fund”—an in-house fund operated by the fund family that shares the same investment style as the outsourced fund. We hypothesize that the presence of a style cohort reduces the importance of geographic proximity by providing fund families with a direct internal benchmark for evaluating the relative performance of their outsourced advisors. In column 3 of Table 9, we introduce a new dummy variable,
$ {I}_{\left\{ StyleCohort\right\}} $
 , which equals 1 if, for a given outsourced fund, there exists another fund in the same family, in the same year, with the same CRSP style code, but managed internally. While our main findings remain robust, the three-way interaction term is positive, consistent with the idea that the presence of style cohort funds mitigates the need for potential monitoring via co-location. However, the coefficient is not statistically significant. Although we cannot reject the null, we emphasize that co-location itself is not a direct monitoring mechanism. Rather, we interpret it as a proxy for a broader capacity for oversight—one that operates by facilitating communication and enabling informal supervision through social and professional networks (Pool et al. (Reference Pool, Stoffman and Yonker2015)).
C. Co-Management by Fund Advisors
Co-management describes an arrangement in which a fund is managed by multiple external advisors. Its effect on risk-shifting is theoretically ambiguous. Besides the expected direct influence through peer monitoring, co-management arrangements enable broader investment mandates, stimulate greater idea generation, and enhance informational diversity, leading to more novel or liquid stock positions, thereby reducing portfolio volatility through diversification effects.Footnote 9 However, in practice, this decentralized, sleeve-based structure under which multiple subadvisors operate does not foster peer monitoring of risk-shifting (Csaszar (Reference Csaszar2012)). Under normal operating conditions, each subadvisor’s portfolio decisions are not routinely visible to the others. While the principal fund advisor must monitor the overall fund-level portfolio composition and harmonize strategies across subadvisors (Broman et al. (Reference Broman, Densmore and Nolan2023)), such multi-party coordination and active intervention are costly (Dass et al. (Reference Dass, Nanda and Wang2013)) and are typically absent in co-managed funds on a day-to-day basis. Therefore, consistent with our discussion of Hypothesis 3c, the mitigating effect of co-management is contingent on the degree of principal advisor involvement. We identify one such scenario where the gains from active advisor intervention exceed the costs of collective action: fund underperformance. We begin our analysis by documenting differences in portfolio composition between single- and co-managed funds before turning to the central question of mitigating risk-shifting. Subsequently, we test whether co-managed funds unconditionally engage in lower risk-shifting and, if not, whether the threat of fund underperformance generates the expected gains from co-management.
Using the mutual fund holdings data, we introduce three new metrics:
$ NewStocks $
 ,
$ UniqueStocks $
 , and
$ RareStocks $
 .
$ NewStocks $
 is defined as the number of stocks held by a fund in a given quarter that were not held by the same fund at any time during the preceding year.
$ UniqueStocks $
 counts the number of stocks held by a fund that are not held by any other funds within the same style category in the same quarter.
$ RareStocks $
 measures the number of stocks held by a fund that are held by no more than 10% of funds in its style category. Additionally, following the method outlined in Kacperczyk, Sialm, and Zheng (Reference Kacperczyk, Sialm and Zheng2005), we compute the Industry Concentration Index (
$ ICI $
 ) for each fund. To measure the level of fund diversification, we follow the methodology proposed by Pástor, Stambaugh, and Taylor (Reference Pástor, Stambaugh and Taylor2020). A portfolio is considered well-diversified if it holds a substantial fraction of the benchmark’s stocks (
$ Coverage $
 ) and if its portfolio weights are close to market capitalization weights (
$ Balance $
 ). The benchmark portfolio is constructed as the union of all stocks held by funds within the same style category in a given quarter. Following Pástor et al. ((Reference Pástor, Stambaugh and Taylor2020), equation 23),
$ Diversification $
 is computed as the product of
$ Coverage $
 and
$ Balance $
 .
We conduct a series of two-sample t-tests (assuming unequal variances) on a range of portfolio characteristics. The results in Panel A of Table 10 indicate that co-managed funds hold new, unique, and rare stocks significantly more relative to their single-managed counterparts. These findings support the idea that co-management is associated with greater idea generation or informational diversity, leading to more novel and less commonly held portfolio positions. We also find that co-managed funds exhibit significantly lower ICI values, suggesting broader sectoral diversification and less emphasis on concentrated industry bets. Moreover, co-managed funds display significantly higher overall diversification, with the difference driven primarily by substantially greater
$ Coverage $
 —that is, co-managed funds tend to hold a larger fraction of the benchmark universe.

Table 10 Long description
Panel A compares sample means for single-managed and co-managed funds across eight variables.
* New Stocks: 21.39 for single versus 55.43 for co-managed, difference of minus 34.04.
* Unique Stocks: 2.001 for single versus 2.31 for co-managed, difference of minus 0.314.
* Rare Stocks: 37.44 for single versus 96.06 for co-managed, difference of minus 58.62.
* I C I percentage: 10.94 for single versus 9.17 for co-managed, difference of 1.77.
* Coverage percentage: 3.33 for single versus 8.12 for co-managed, difference of minus 4.79.
* Balance: 0.41 for single versus 0.42 for co-managed, difference of minus 0.01.
* Diversification percentage: 1.45 for single versus 3.30 for co-managed, difference of minus 1.85.
* Portfolio Liquidity: 0.053 for single versus 0.099 for co-managed, difference of minus 0.045.
All differences are statistically significant at the 1 percent level except Unique Stocks and Balance.
Panel B presents pooled O L S regression results for risk-shifting behavior R A R sub i,t across three models.
* Distance: Coefficients range from minus 2.145 to minus 2.750, all significant.
* Distance multiplied by I advisor greater than 1: Minus 1.494 in model 1 and minus 3.568 in model 2.
* Distance multiplied by Log Sub Advisor: Minus 1.998 in model 3.
* Interaction terms with I Below: Distance multiplied by I advisor greater than 1 multiplied by I Below is 3.339; Distance multiplied by Log Sub Advisor multiplied by I Below is 2.752.
* Control variables include Exret, Turn ratio, Exp ratio, Flows, Log age, Past Return, and Log size.
* Statistics: All models have 10,057 observations and an R-squared of 0.52. Standard errors are provided in parentheses below estimates.
While the aforementioned portfolio differences confirm broader investment mandates and informational diversity, they do not, by themselves, imply risk-shifting is mitigated. We now test whether risk-shifting diminishes in the presence of multiple advisors and report our results in Panel B of Table 10. About 22% of the outsourced funds in our sample have more than one external advisor. Column 1 presents the results of our baseline regression, where
$ {I}_{\left\{ advisor>1\right\}} $
 is a dummy variable with a value of 1 when the number of external fund advisors is greater than 1. Statistically, the coefficient of our key variable of interest, the interaction between
$ Distance $
 and
$ {I}_{\left\{ advisor>1\right\}} $
 is no different than 0. Therefore, we fail to reject the null hypothesis (Hypothesis 3c) that risk-shifting in co-managed funds is unconditionally no different from that in single-managed funds. We now test whether the benefits of co-management materialize under specific conditions, previously identified, where the gains from coordination exceed the costs. To test this hypothesis, we create a dummy variable,
$ {I}_{\left\{ Below\right\}} $
 , which takes the value of 1 if the fund return is below the benchmark, and 0 otherwise. In column 2, when we include
$ {I}_{\left\{ Below\right\}} $
 to our earlier specification, we observe the varied effects of co-management on the different regions of the performance distribution. Importantly, when outsourced funds underperform, the heightened engagement of the principal advisor and the peer monitoring appear to constrain risk-shifting behavior in co-managed settings. Since the effects could vary by the number of advisors, in column 3, we reestimate the specification using
$ Log\hskip0.1em SubAdvisor $
 . The results are qualitatively similar.
Taken together, these findings suggest that while co-managed funds do exhibit portfolio characteristics consistent with expanded mandates and greater diversification, these differences do not by themselves attenuate risk-shifting. Under normal circumstances, the costs of coordination across firm boundaries may offset the benefits of collective action. However, when fund performance deteriorates, the benefits from the principal advisor’s intervention exceed the cost of coordination, the multiple sub-advisors’ propensity to collaborate increases, and the mitigating effect of co-management is realized.
VI. Robustness
We perform several robustness checks to support our results further. First, we use an alternative measure of portfolio risk-shifting. Instead of relying on fund returns, we use the fund’s portfolio composition to measure risk choices. Second, we conduct a falsification test to assess whether managers are actually tracking fund performance against the designated benchmark. Finally, we examine whether our results are driven by the fund distribution channel—broker-sold versus direct-sold—rather than by outsourcing status.
For brevity, we present these results in Section IA.G of the Supplementary Material. The holdings-based measure yields evidence of risk-shifting similar to that in Table 2; external advisors do not adjust risk in response to deviations from randomly selected benchmarks; and we find no evidence that the distribution channel drives our results. Overall, these findings are consistent with our main results.
VII. Conclusion
We investigate the effects of contractual arrangements on the portfolio risk choice of outsourced mutual funds. We first document that the advisors of outsourced mutual funds, who are offered high-powered incentives, engage in mid-year risk-shifting significantly more than advisors of in-house managed funds. Using an instrumental variable approach and matching analysis, we establish a causal relationship between outsourcing and strategic risk-shifting. This behavior can be explained by the implicit optionality in the advisors’ payoff structures. We find that concerns regarding retention of the management contract or potential termination drive excessive risk-shifting in outsourced funds. Importantly, performance-based asymmetric contracts of portfolio managers do not determine the risk choices in outsourced funds. Lastly, we examine mechanisms that mitigate agency problems and find that contractual arrangements—such as co-location, co-branding, and co-managing—help reduce excessive risk-shifting by outsourced funds and support the efficient expansion of outsourcing as an emerging form of industrial organization.
Supplementary Material
To view supplementary material for this article, please visit http://doi.org/10.1017/S0022109026103287.
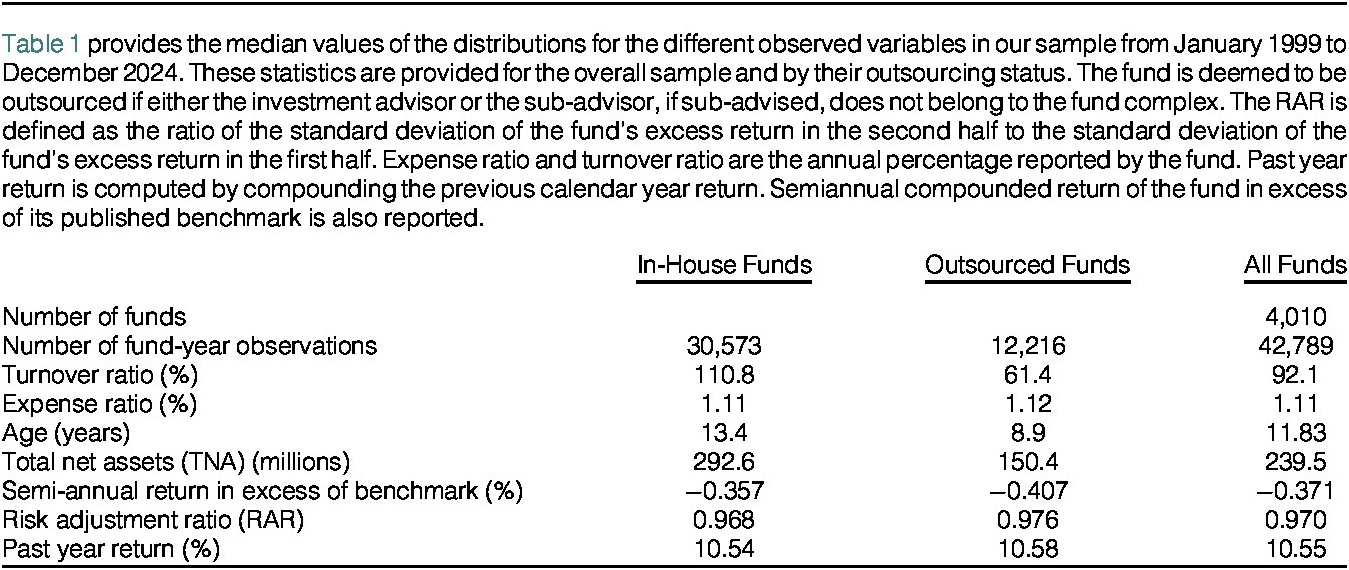
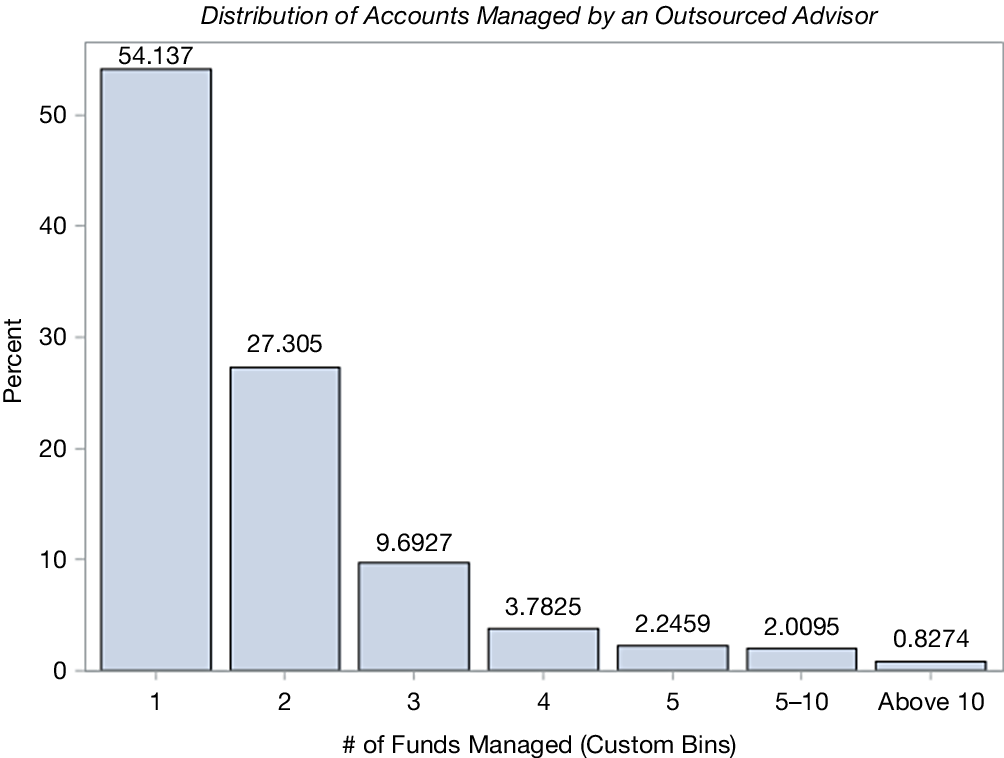
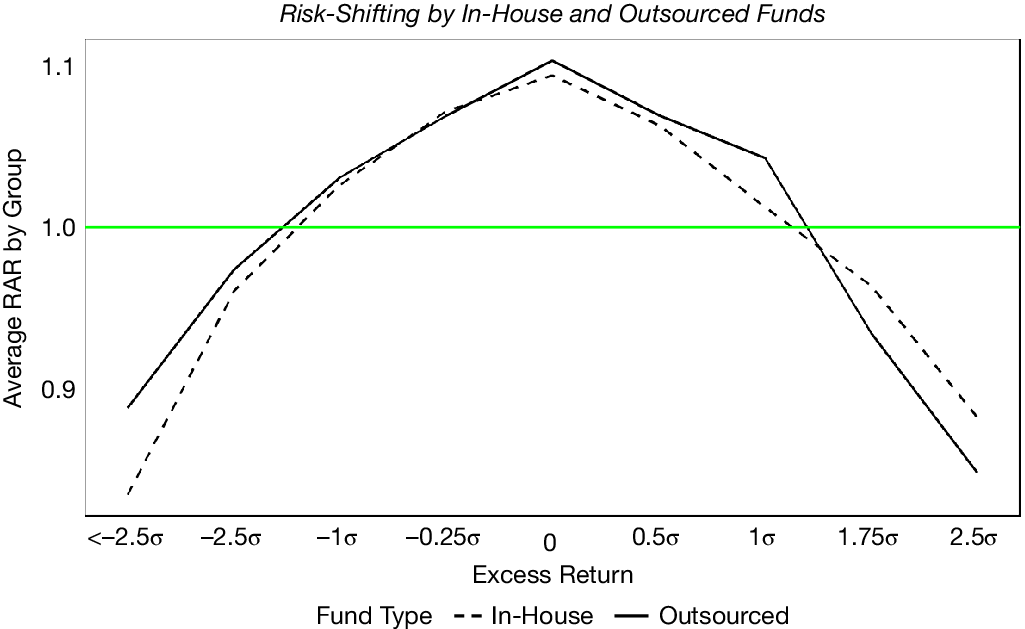


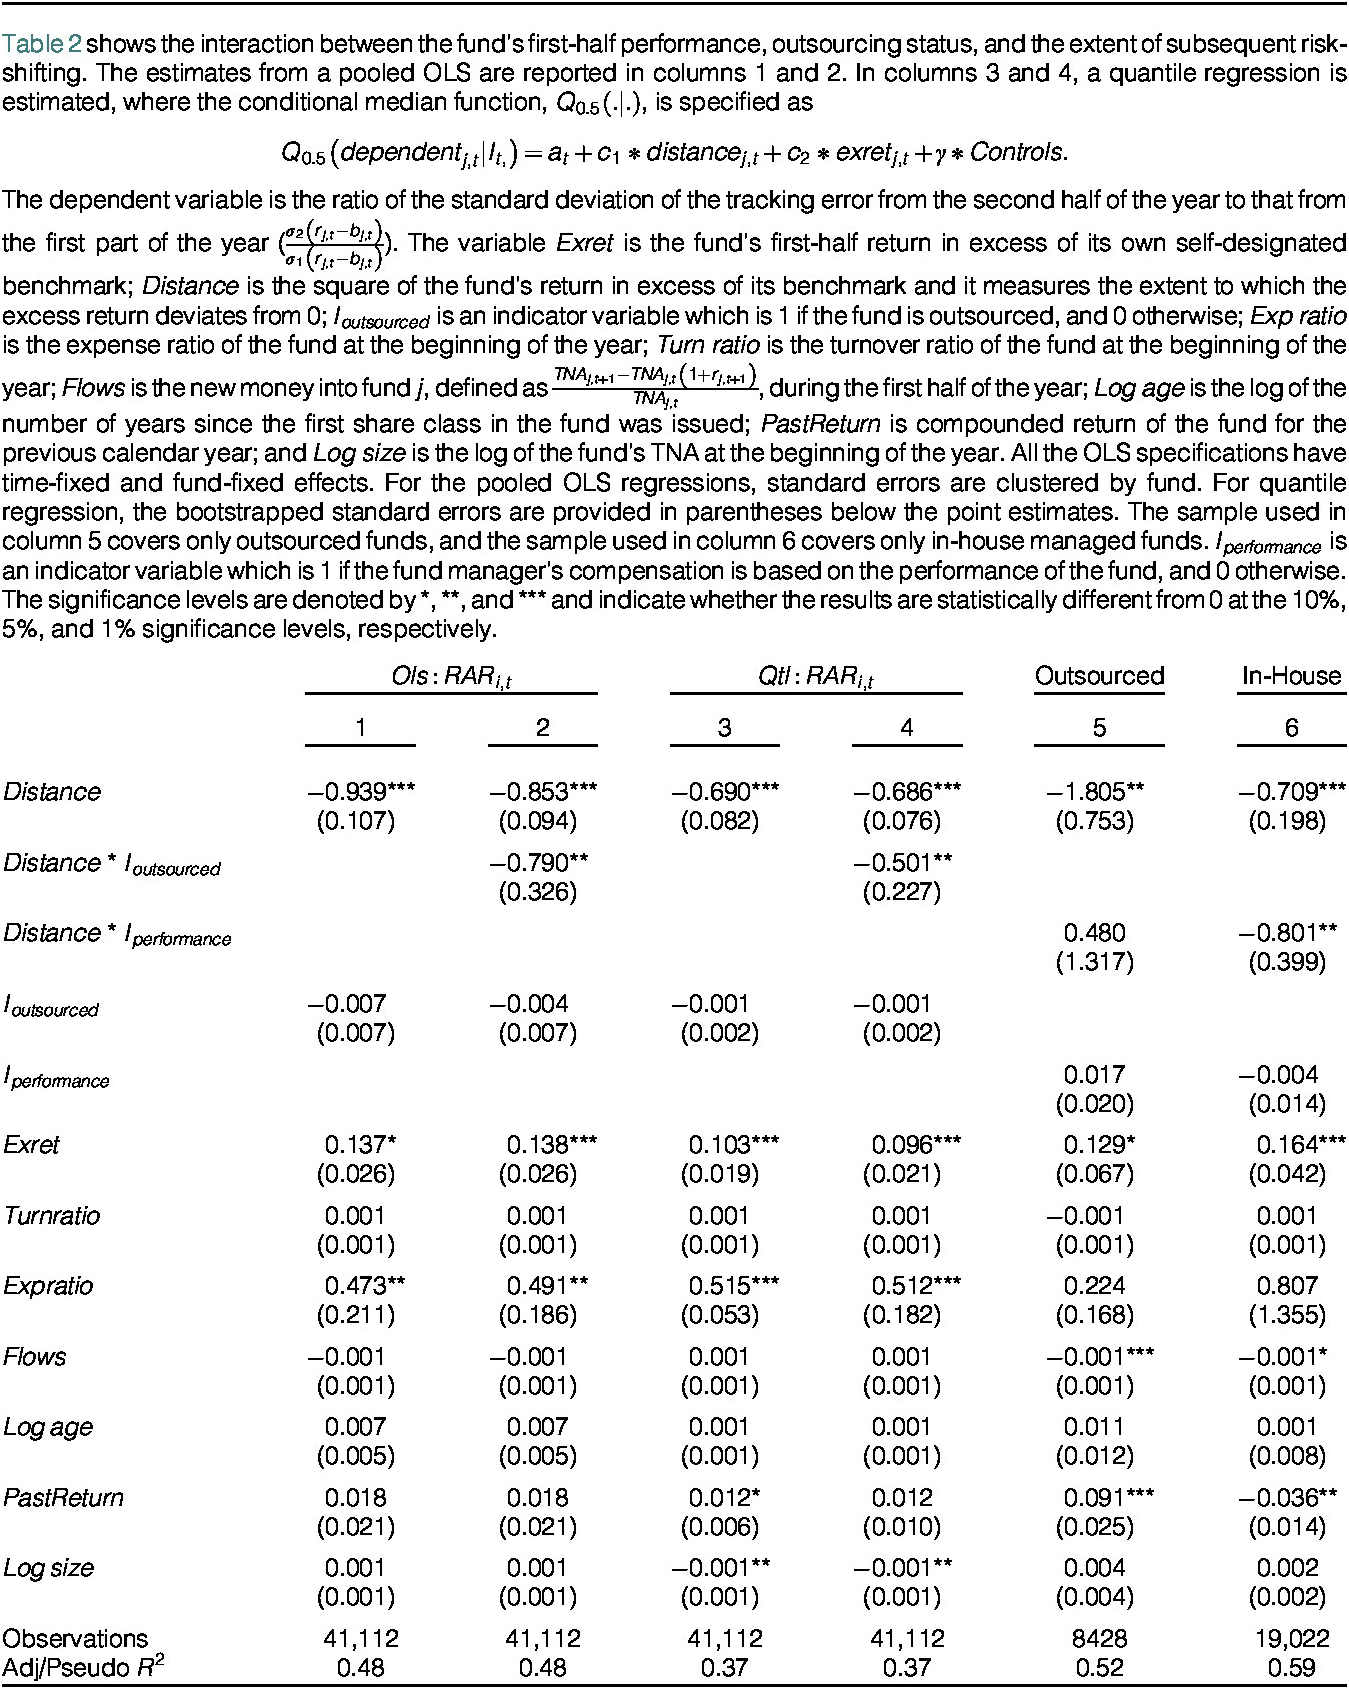
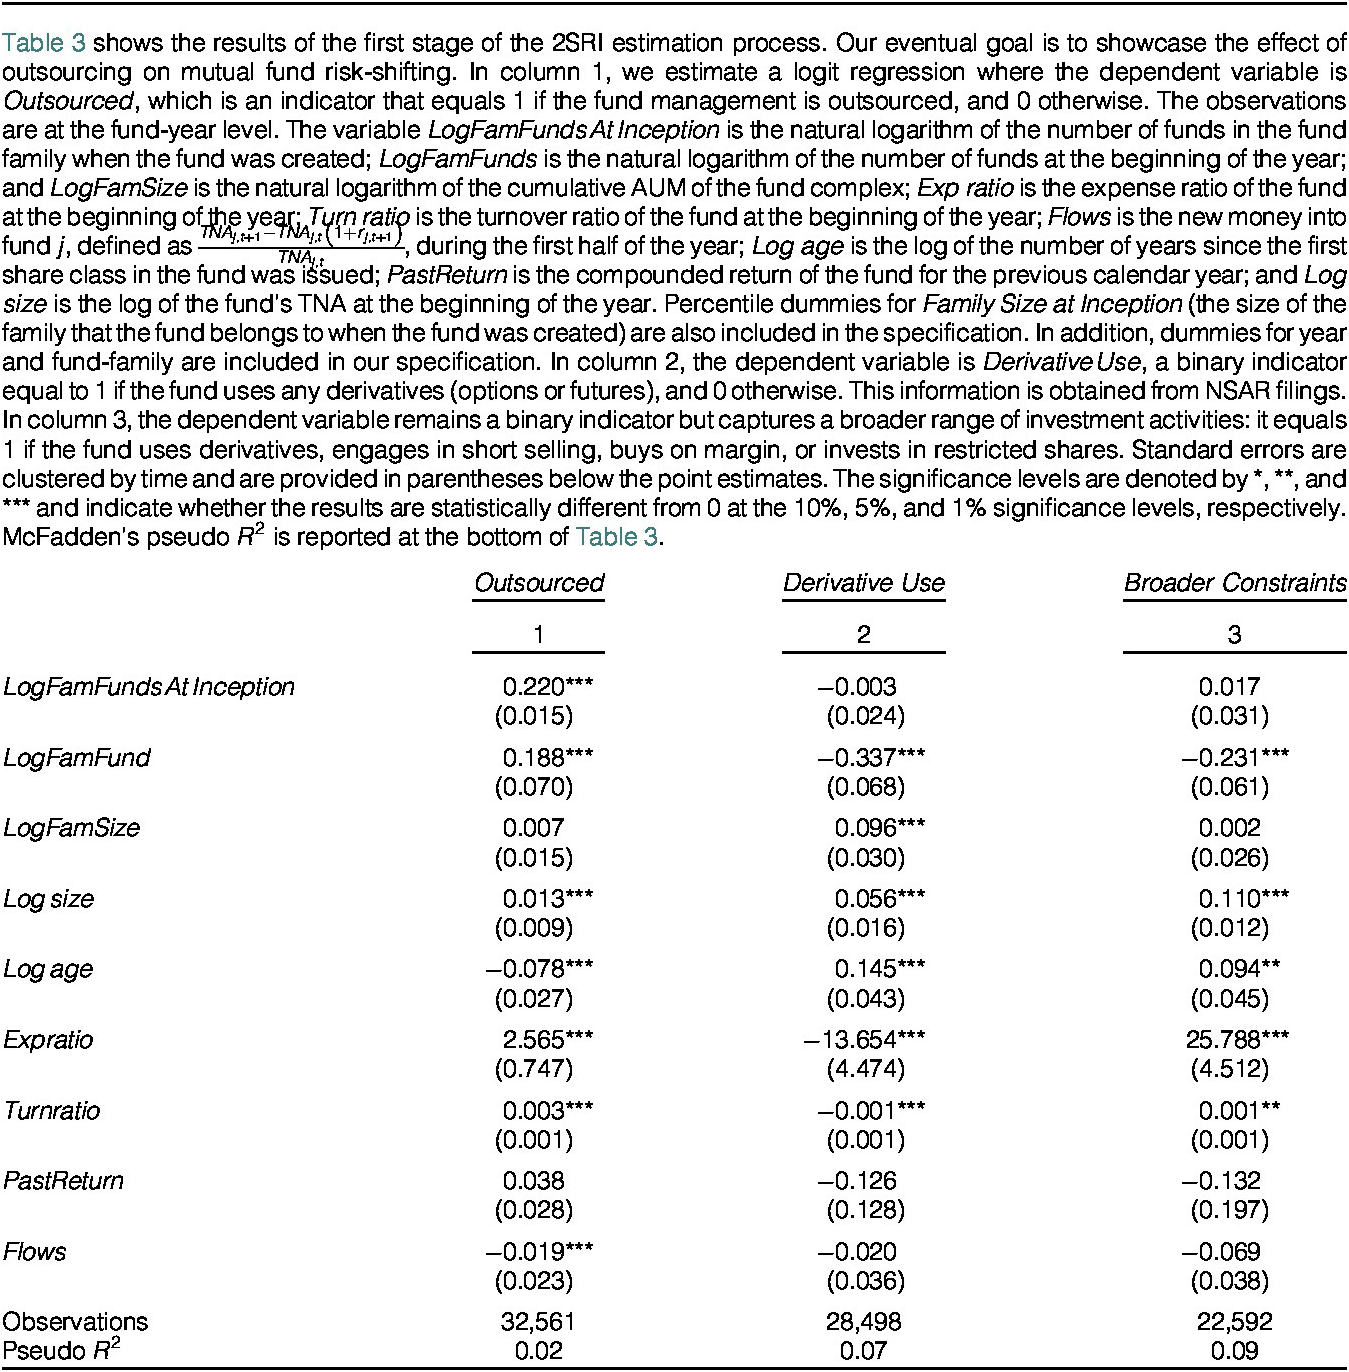
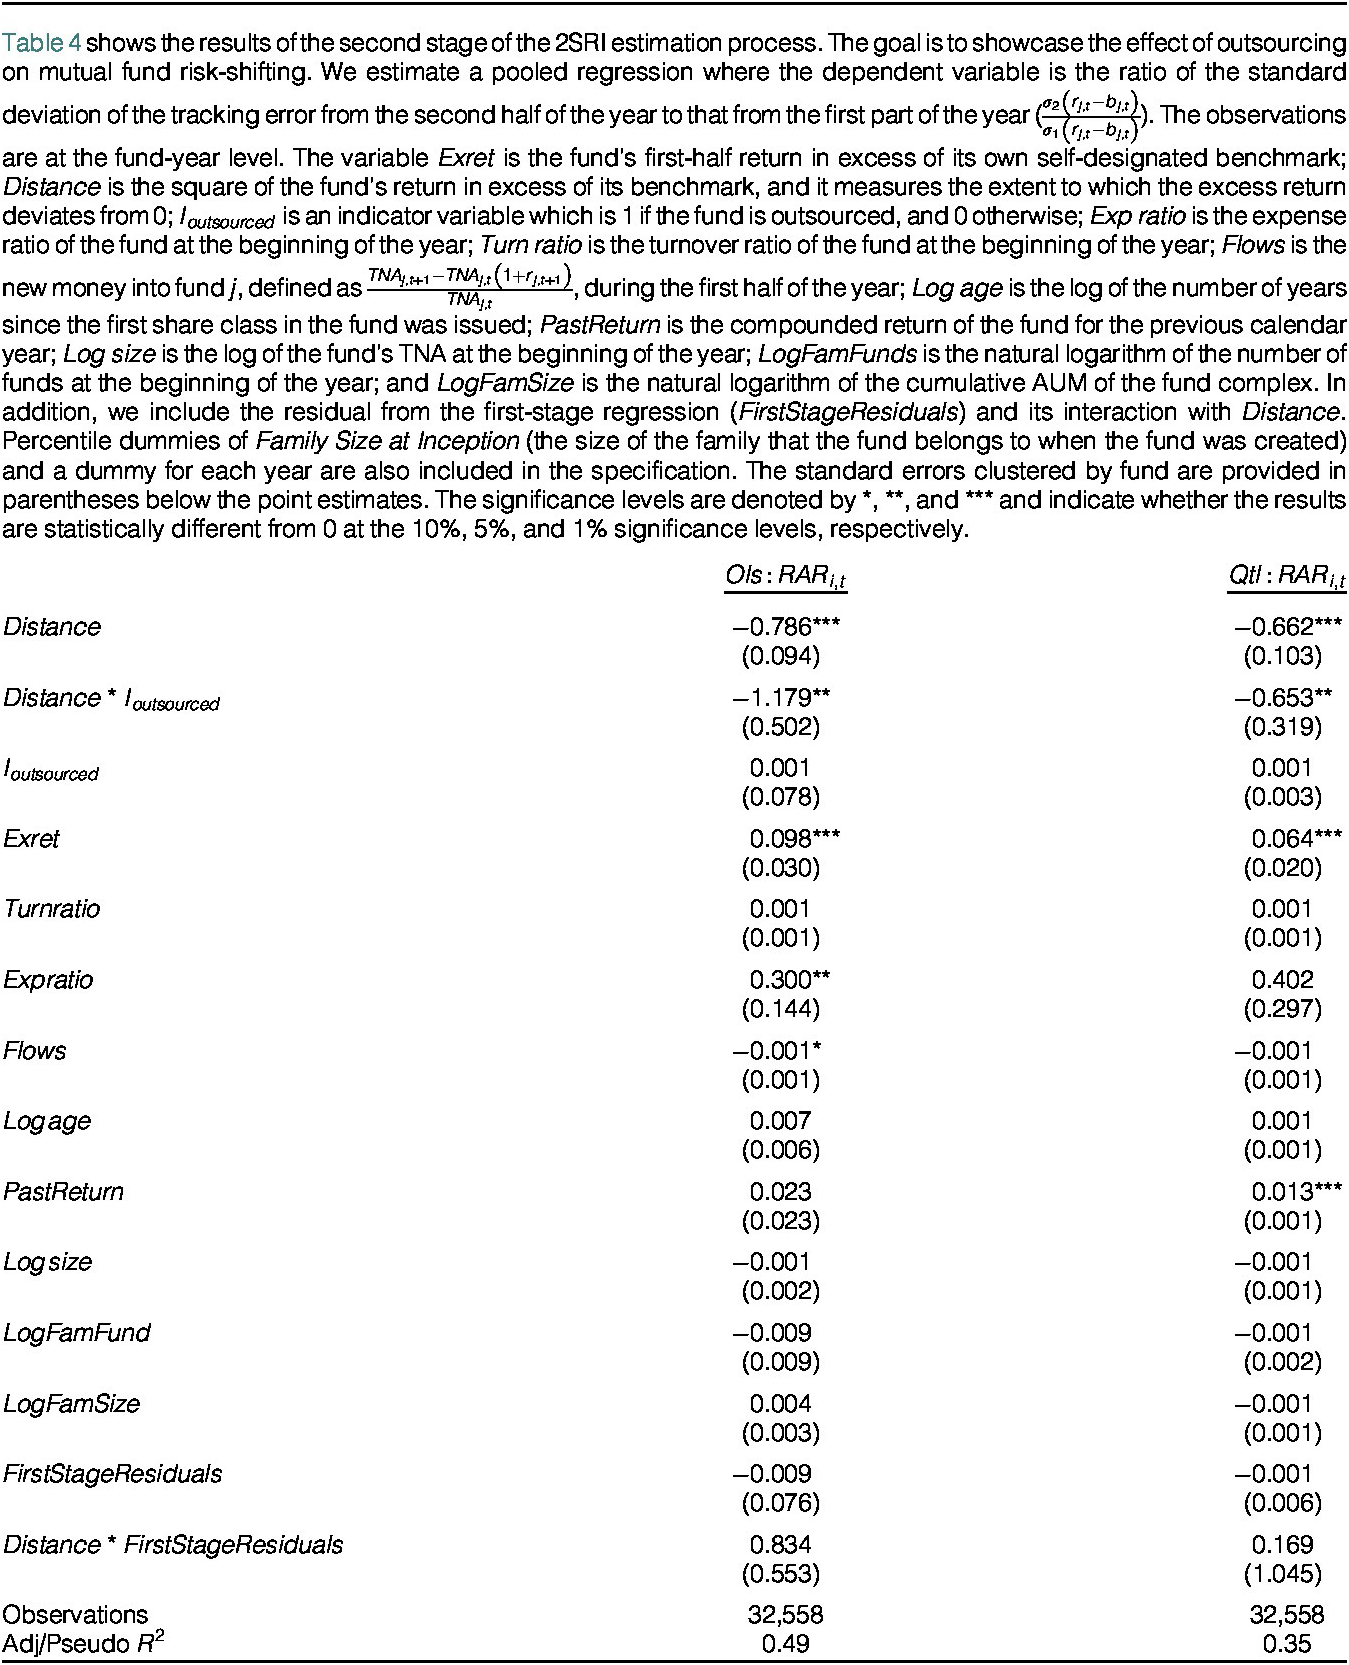
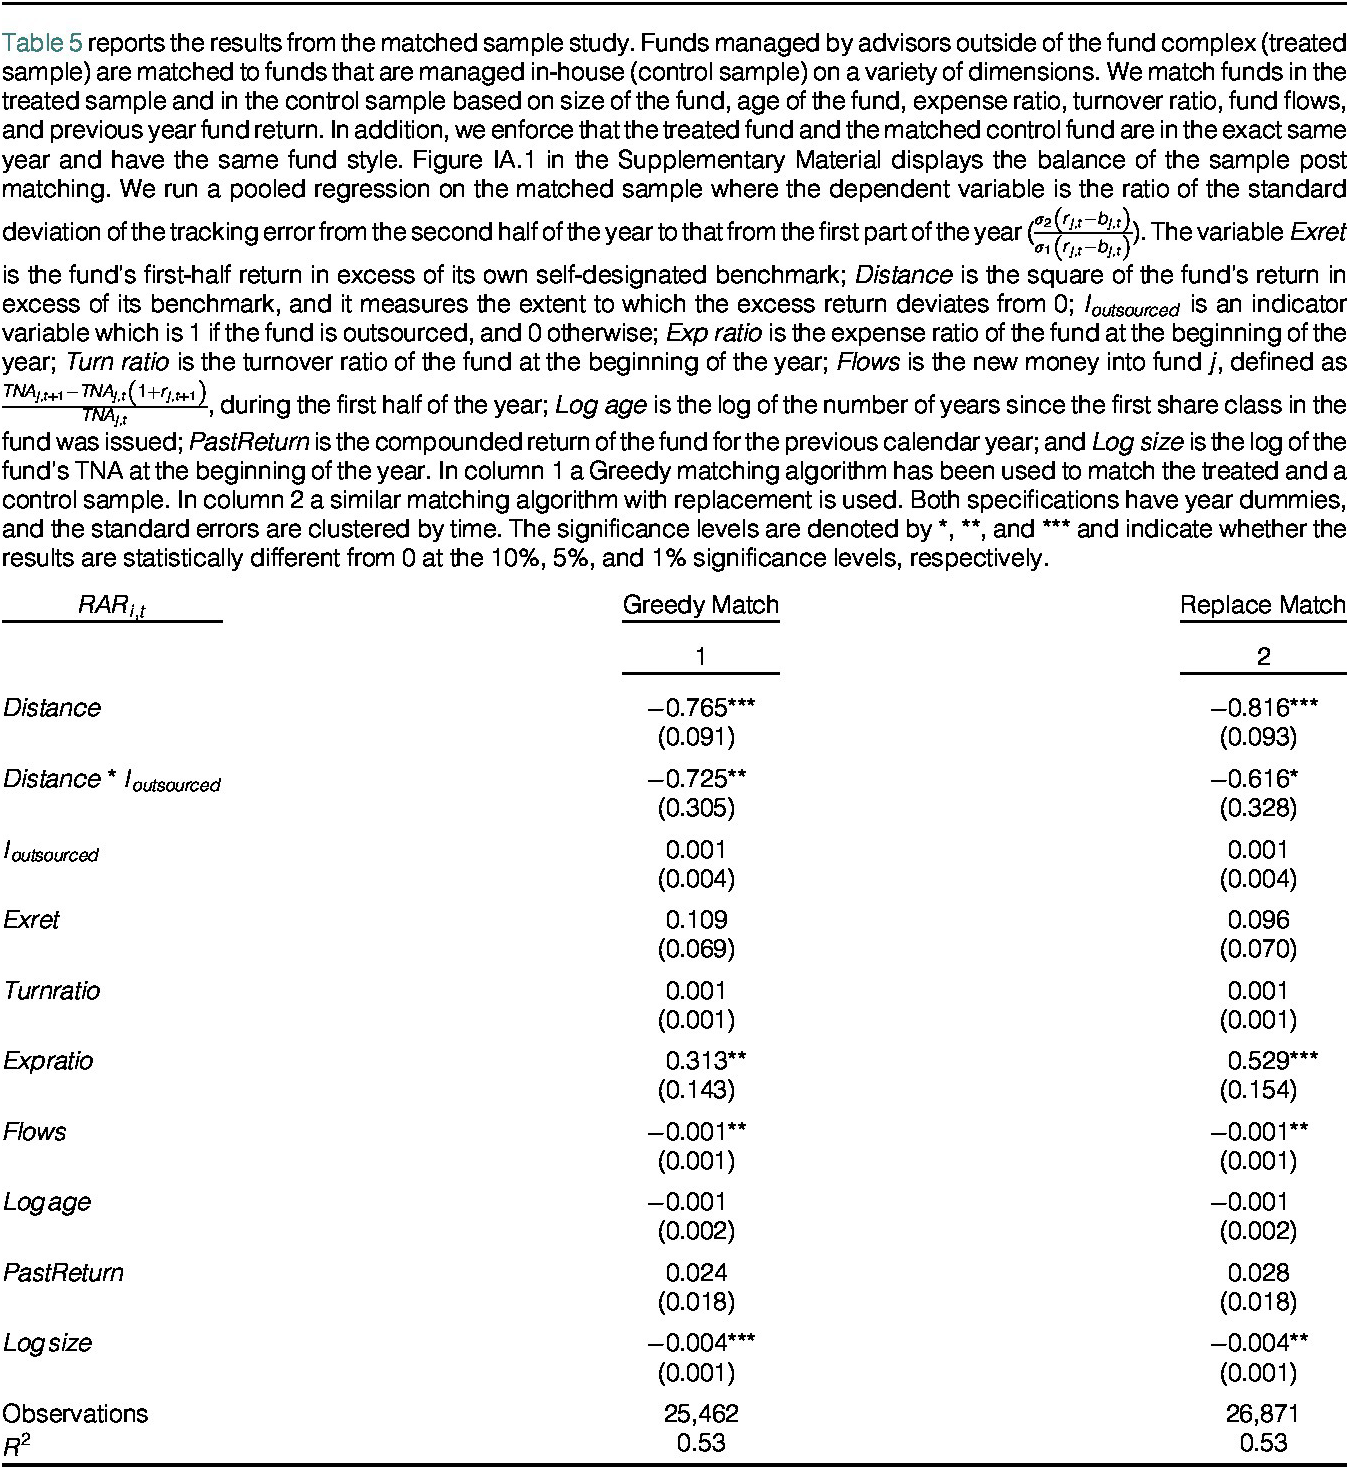
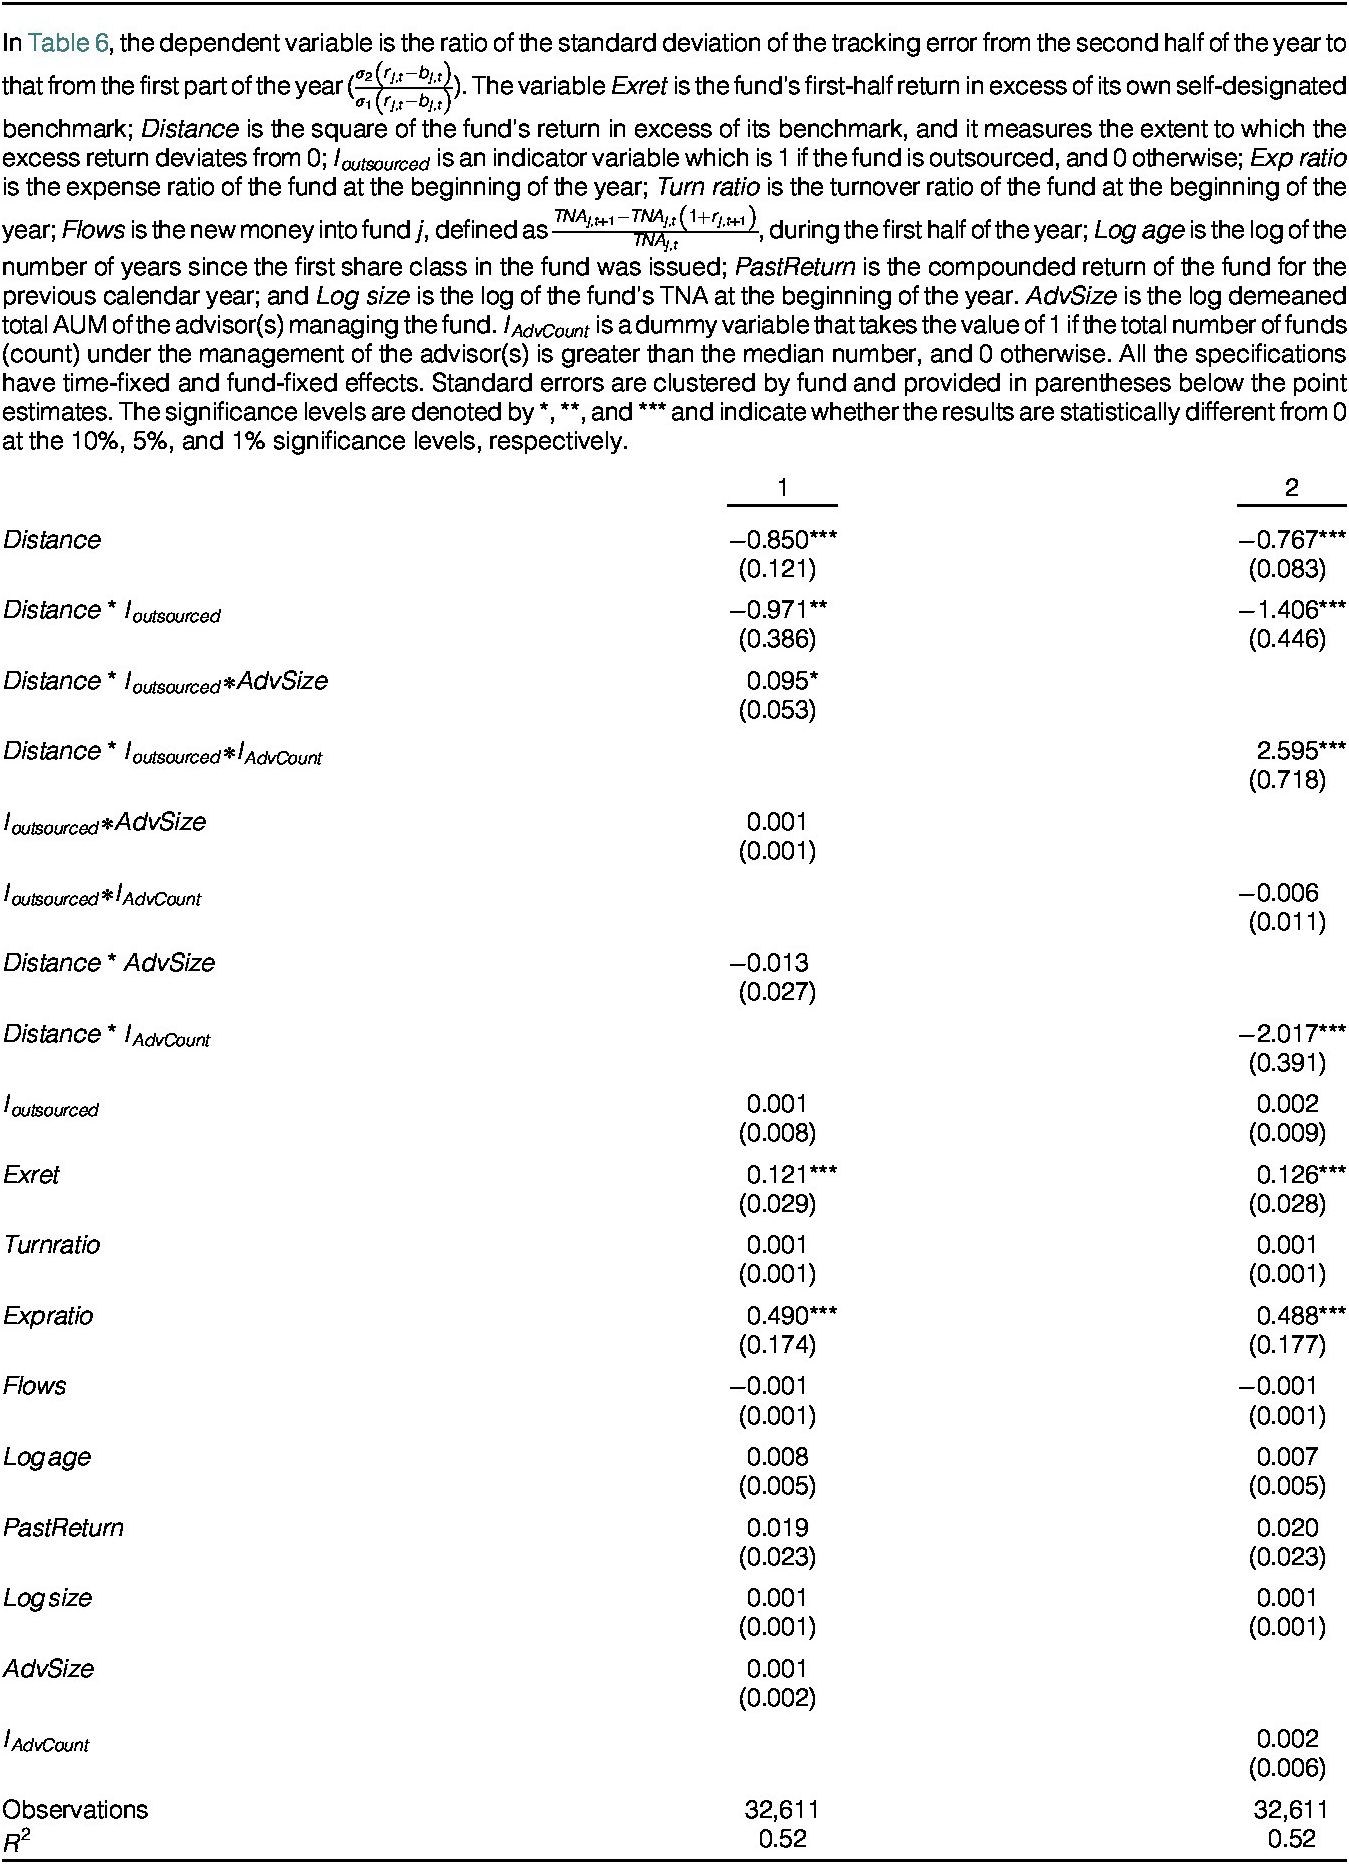
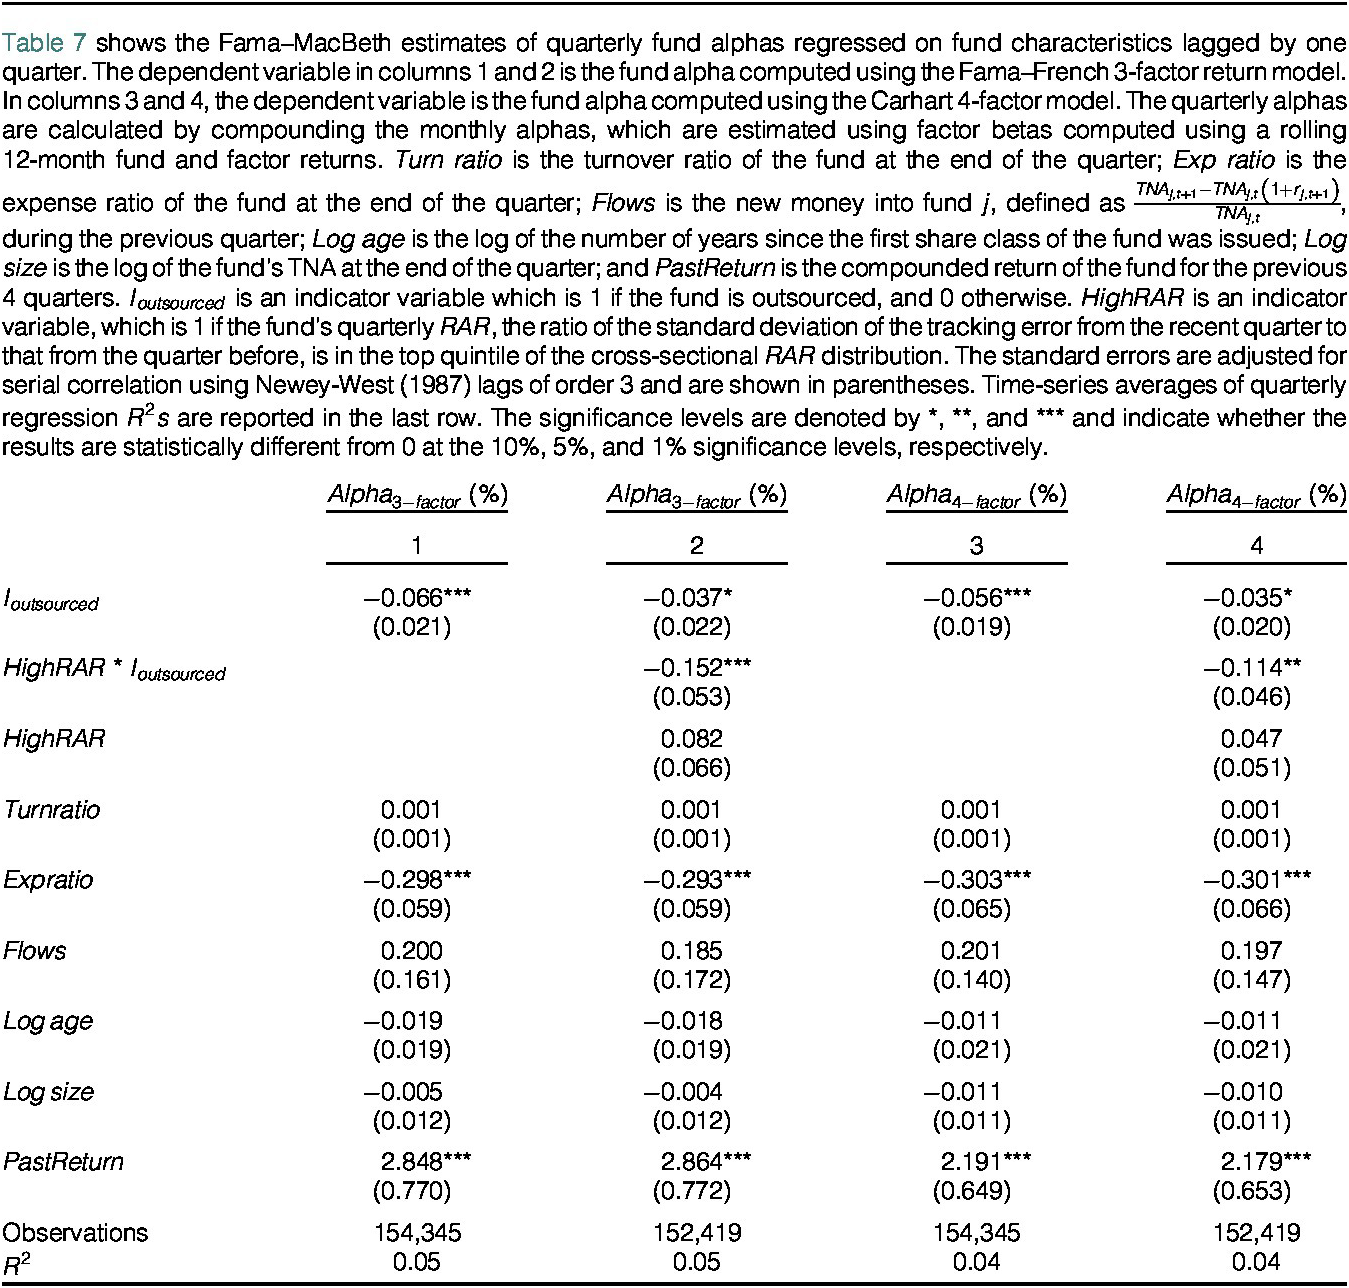
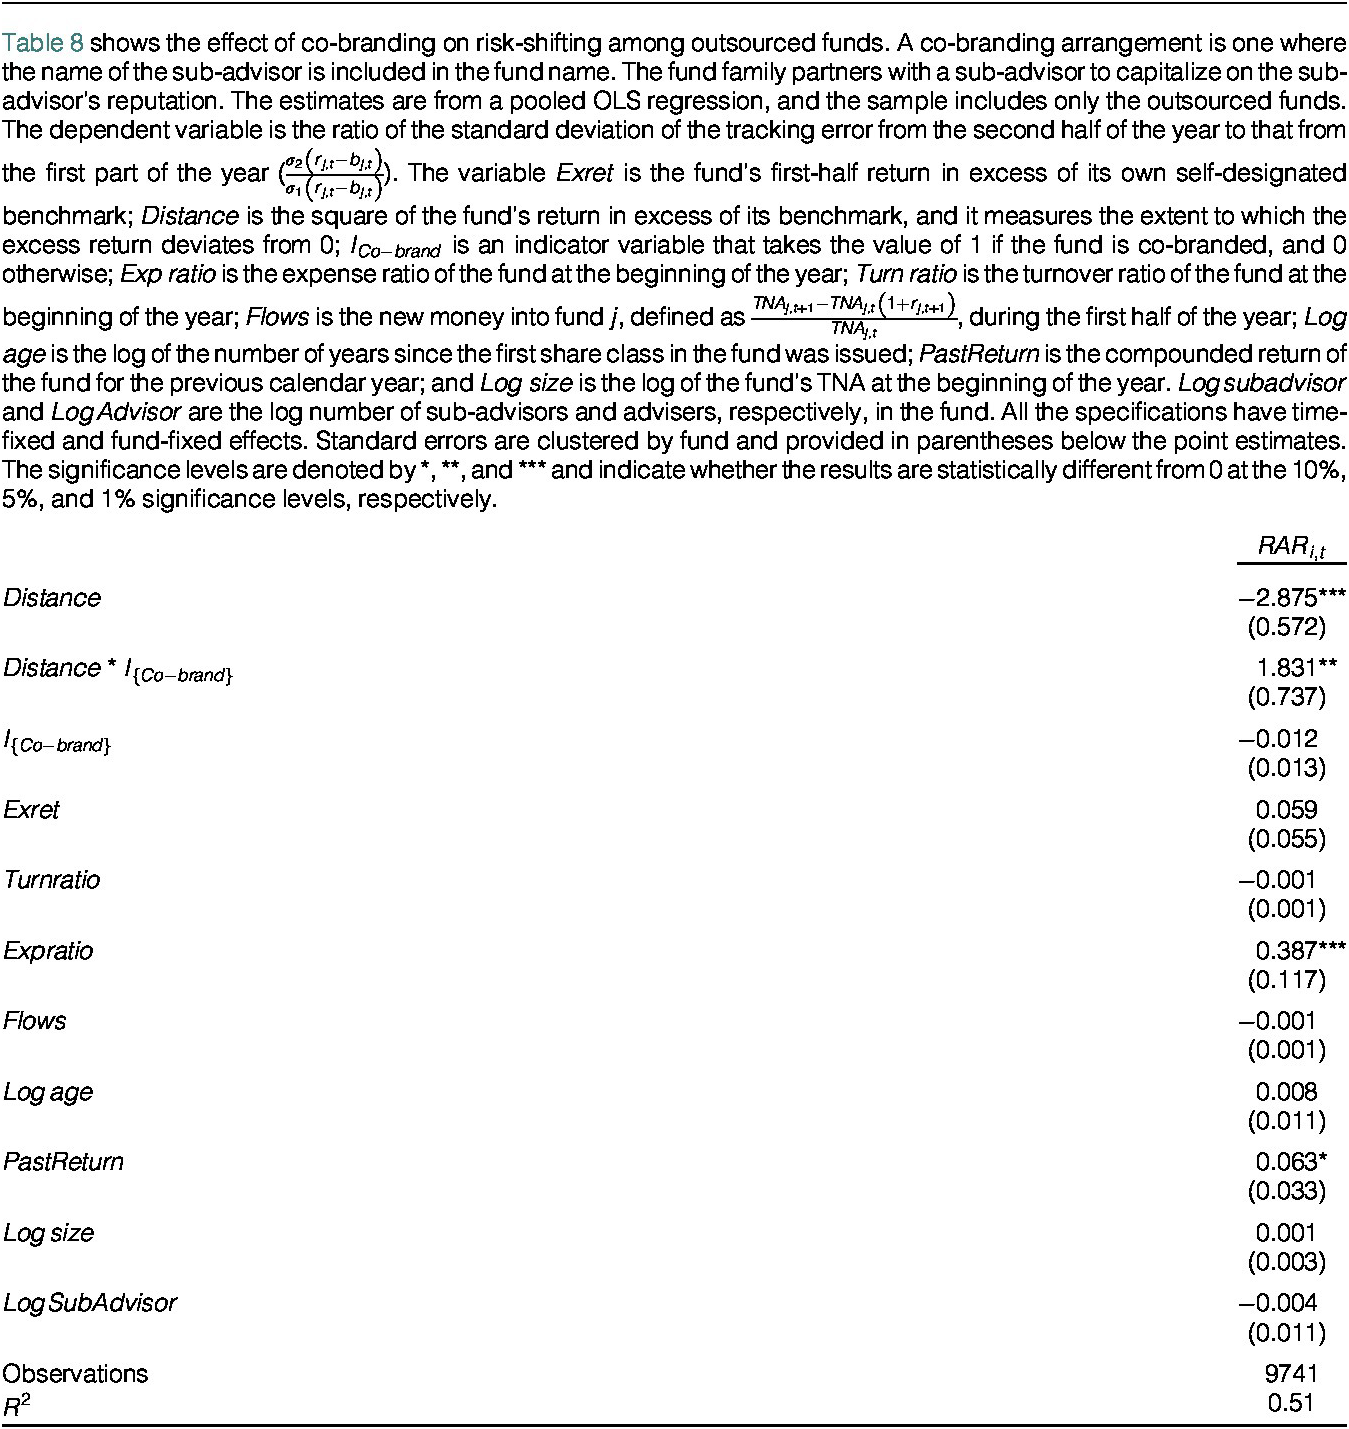
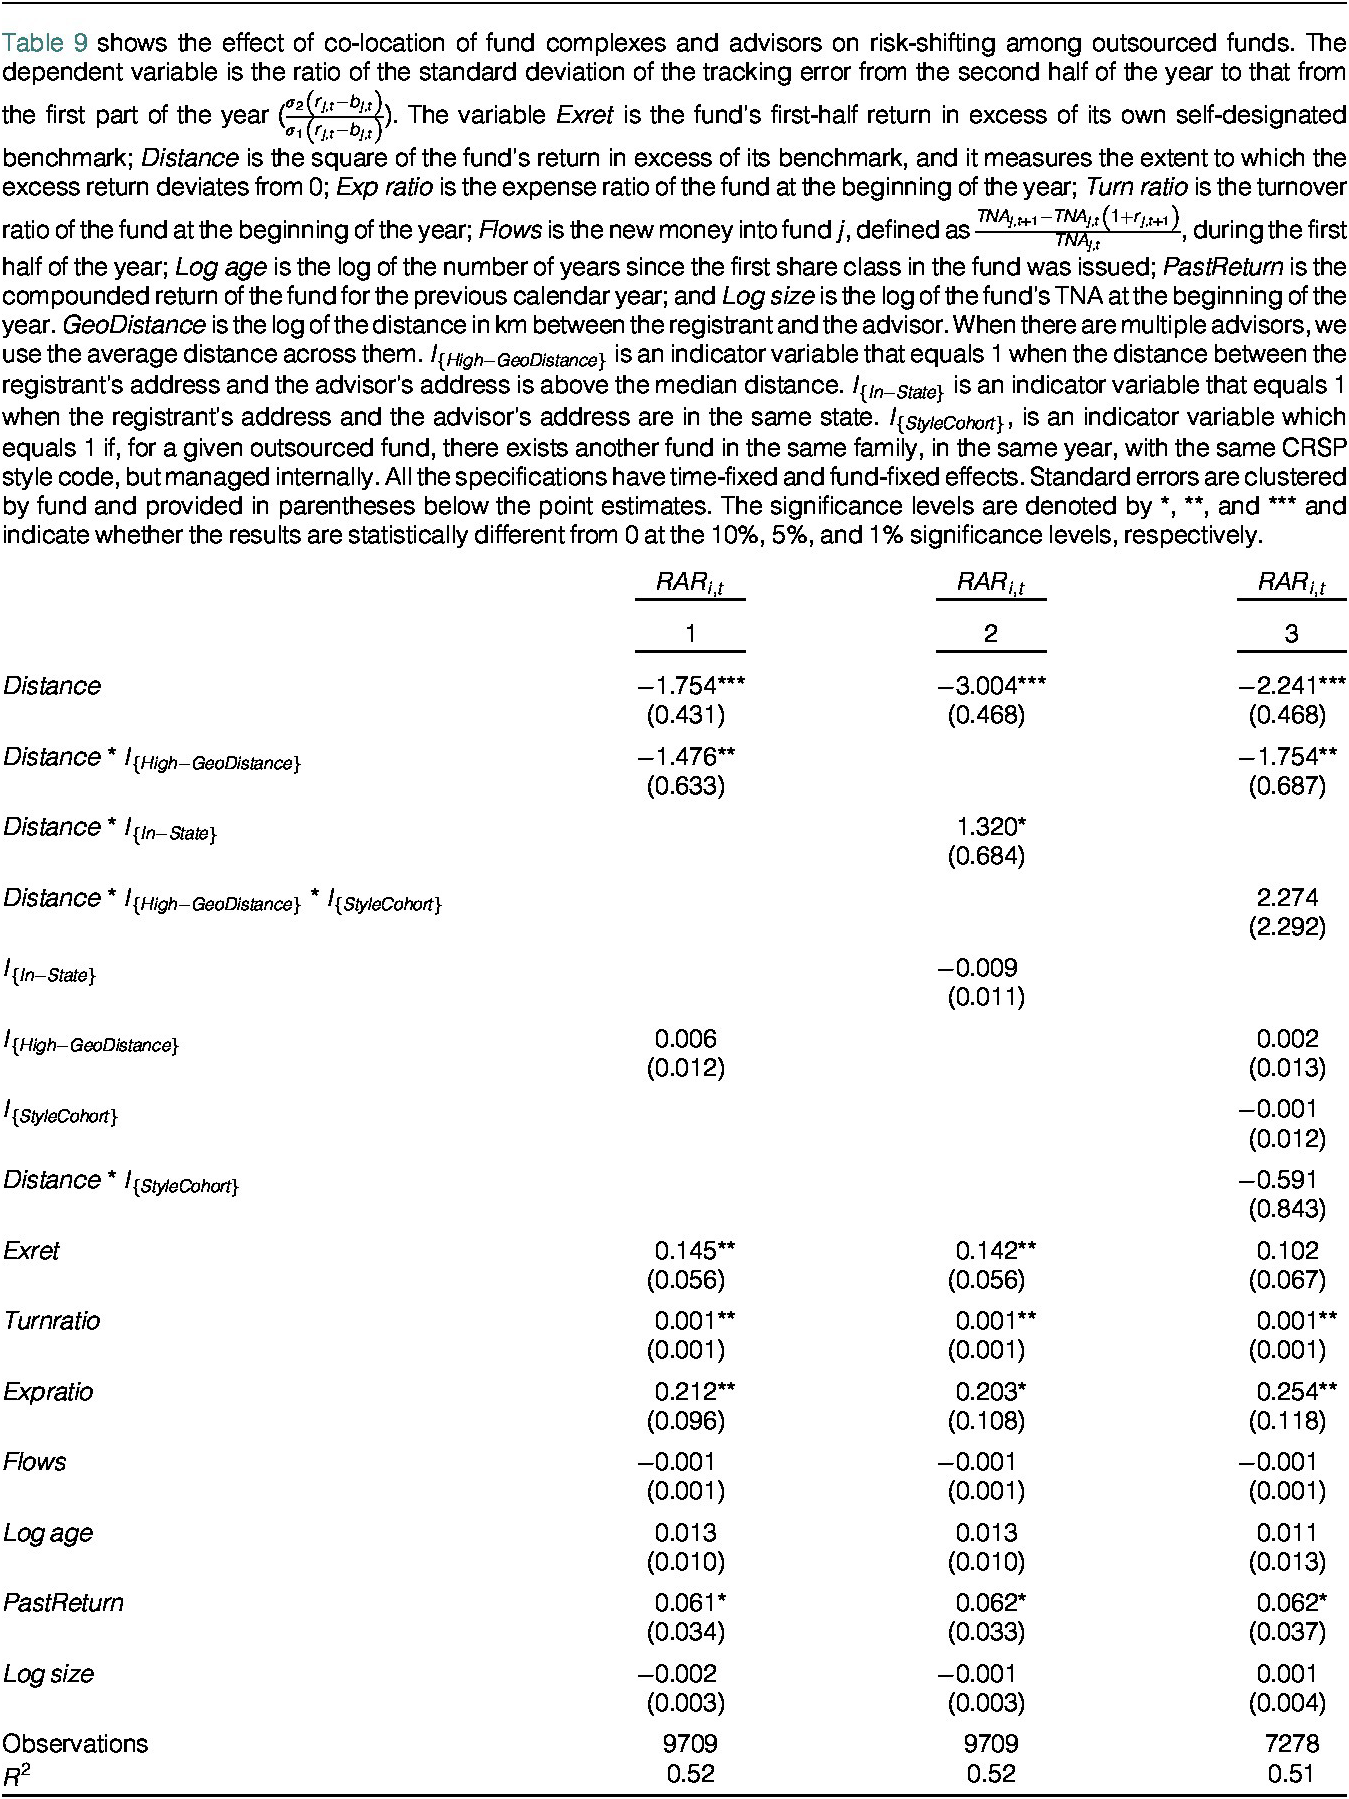
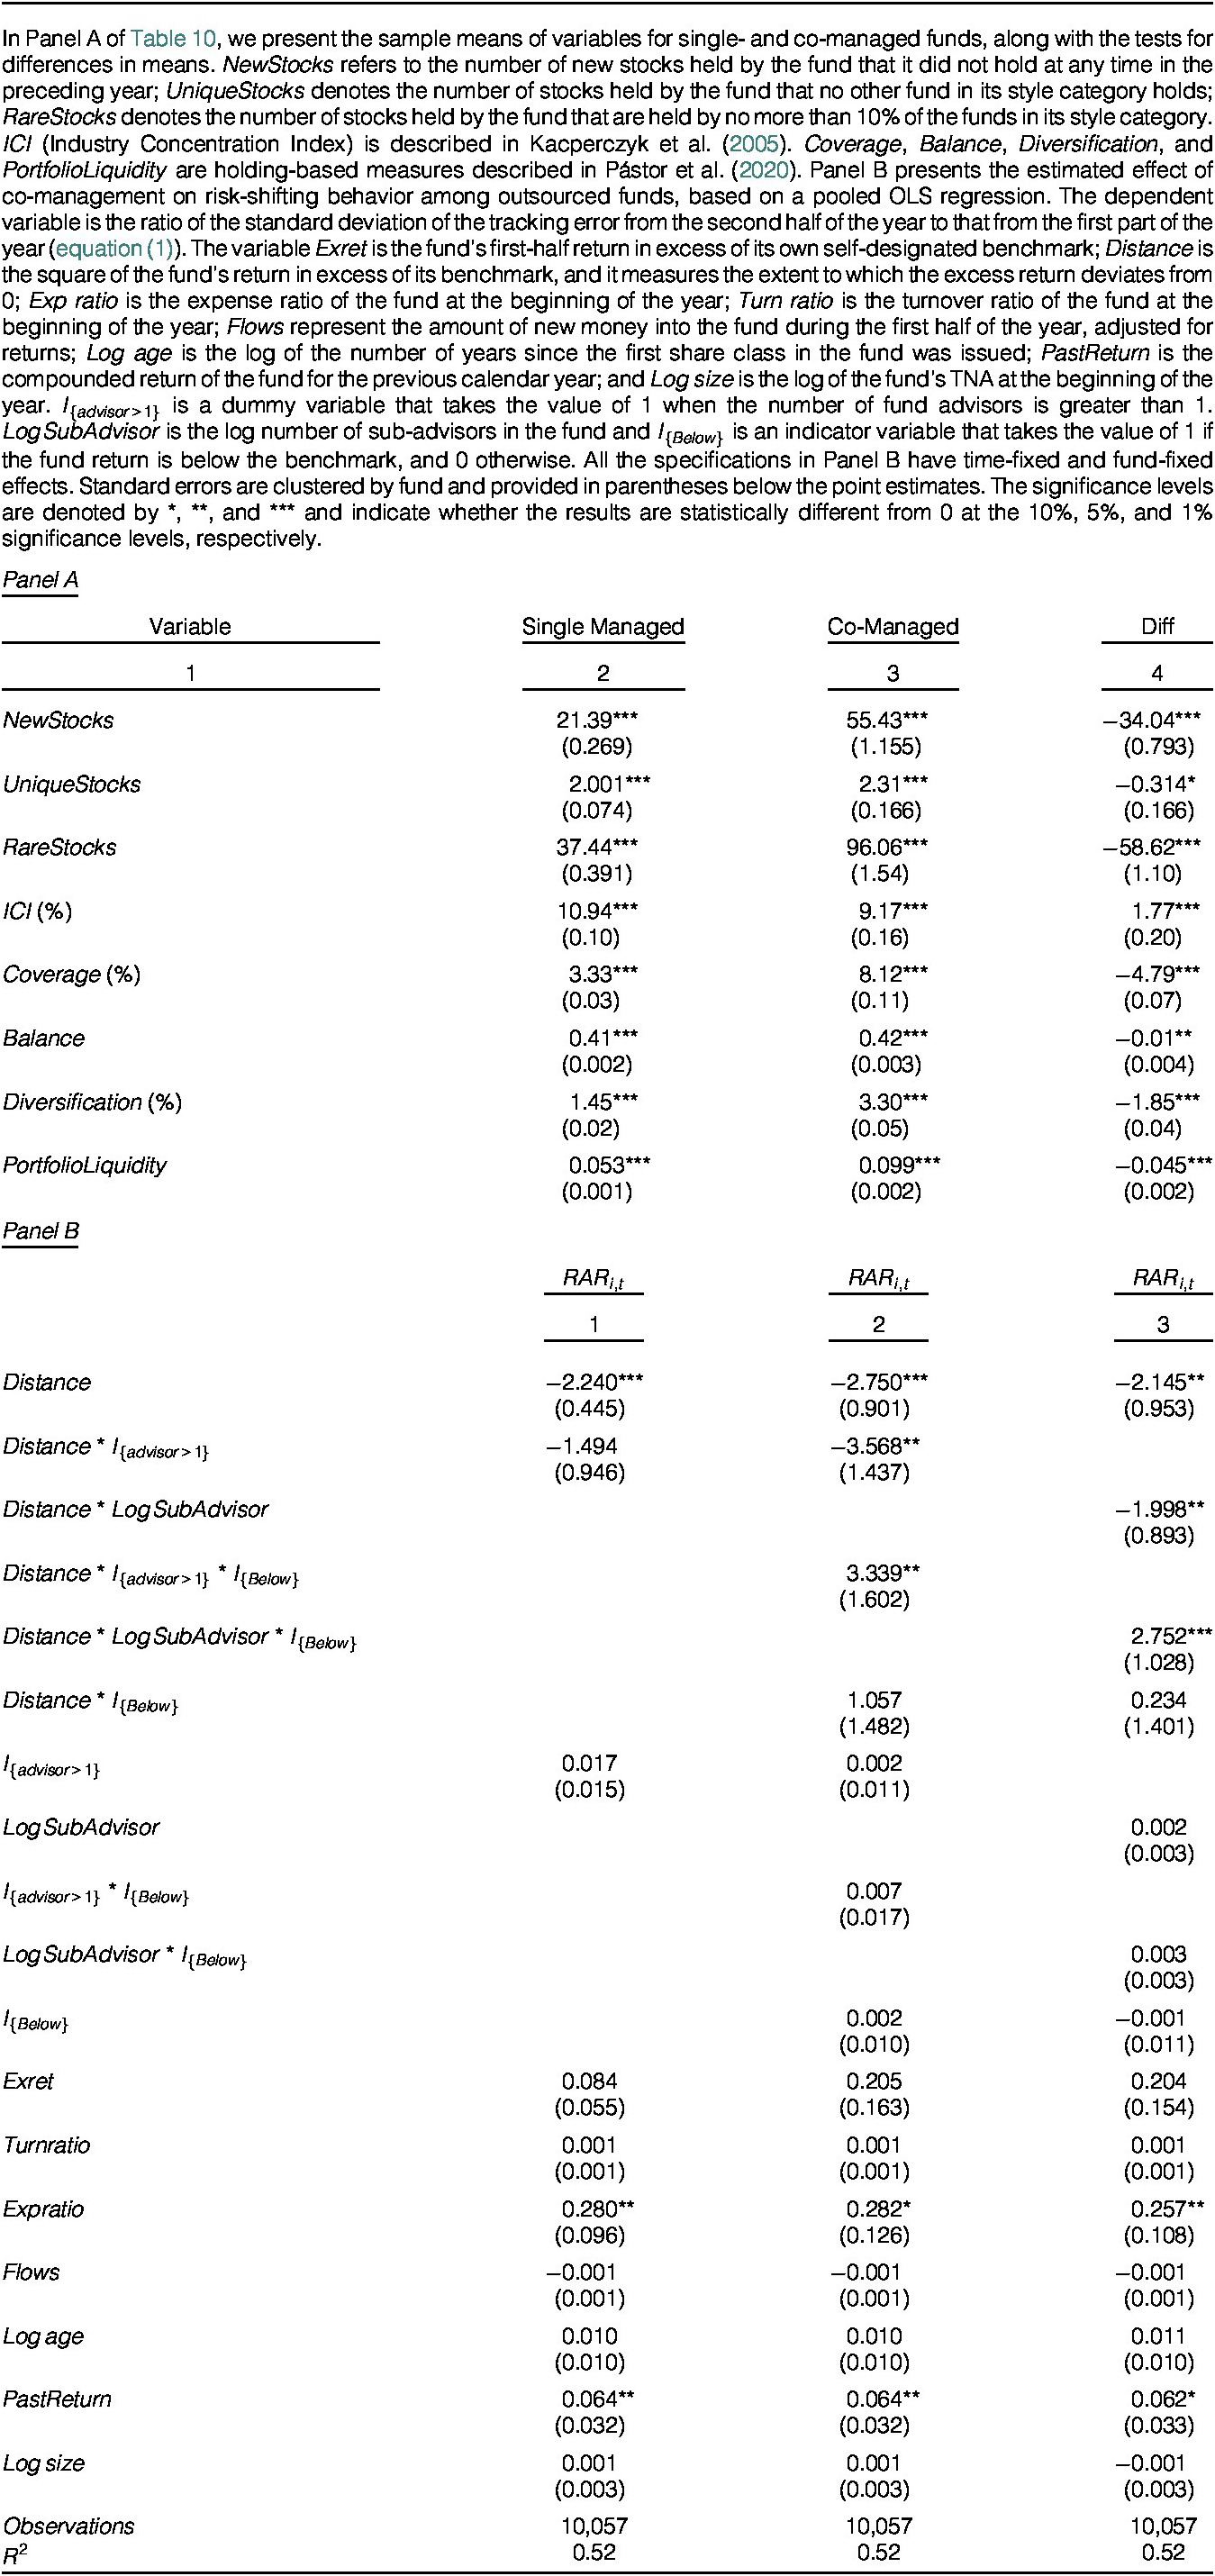


 Open access

