1 Introduction
The concept of electoral competition plays a central role in many subfields of political science. Political theorists often define democracy as a system in which at least two parties compete in elections for the right to govern (e.g., Schumpeter Reference Schumpeter1942; Downs Reference Downs1957; Dahl Reference Dahl1971). In other words: no competition, no democracy. Beyond the simple question of whether elections are contested, however, great interest also surrounds the question of how closely those elections are contested. Those who investigate the incumbency advantage, for example, often worry that it reduces the competitiveness of elections due to the deterrence of high-quality challengers (e.g., Carson, Engstrom, and Roberts Reference Carson, Engstrom and Roberts2007; Hall and Snyder Reference Hall and Snyder2015). Others have argued that uncompetitive elections make for less responsive politicians (e.g., Fiorina Reference Fiorina1973; Griffin Reference Griffin2006; Dropp and Peskowitz Reference Dropp and Peskowitz2012), and numerous others still have focused on the relationship between competitiveness and voter turnout (e.g., Riker and Ordeshook Reference Riker and Ordeshook1968; Cox Reference Cox2015).
Given the ubiquity of references to competition and competitiveness, it is surprising that no consensus exists on how best to measure it. A key challenge is how to conceptualize and measure electoral competitiveness across alternative electoral systems. Studies of single-member district (SMD) elections have repeatedly investigated how “safe” and “swing” districts affect the nature of local politics—in terms of the parties’ mobilizational efforts, campaign expenditures, and turnout (e.g., Denver and Hands Reference Denver and Hands1974; Cox and Munger Reference Cox and Munger1989; Aldrich Reference Aldrich1993).Footnote 1 The “traditional” measure of competitiveness in SMDs used in these studies is based on the simple difference in vote shares between the winner and the runner-up. Much less consensus exists on how to measure competitiveness in multimember district (MMD) contexts, especially under proportional representation (PR) rules. Elections under PR rules typically involve multiple parties and hence greater complexity in the nature of competition.
A small number of recent studies have attempted to create general measures of competitiveness that can be applied across SMD and MMD systems. Some focus on the aggregate level, assessing the governing party’s probability of losing office (Kayser and Lindstädt Reference Kayser and Lindstädt2015; Abou-Chadi and Orlowski Reference Abou-Chadi and Orlowski2016) or how far a party is from winning a majority in a legislative chamber (Feigenbaum, Fouirnaies, and Hall Reference Feigenbaum, Fouirnaies and Hall2017).Footnote 2 A second approach focuses on the closeness of individual candidates to being elected (e.g., Kotakorpi, Poutvaara, and Terviö Reference Kotakorpi, Poutvaara and Terviö2017), with the empirical aim of investigating candidate-level outcomes.
A third set of studies has focused on how to measure competitiveness at the district level. Three recent studies in particular—Blais and Lago (Reference Blais and Lago2009), Grofman and Selb (Reference Grofman and Selb2009), and Folke (Reference Folke2014)—have proposed general measures of competitiveness that can be applied to districts of varying magnitude across alternative electoral systems.Footnote 3 The authors use their proposed measures to investigate whether PR induces more competitive contests than plurality rule (Blais and Lago Reference Blais and Lago2009; Grofman and Selb Reference Grofman and Selb2009), to predict turnout across districts in PR systems (Blais and Lago Reference Blais and Lago2009; Grofman and Selb Reference Grofman and Selb2011), and to explore the policy influence of small parties in PR systems (Folke Reference Folke2014).
In what follows, we offer a reconsideration of how to measure the competitiveness of elections at the district level in SMD and MMD contexts. We first review the extant alternative measures and situate them within a typology of possible measures. Next, we argue that any measure of competitiveness should reflect the marginal benefit of effort (MBE) for each party. A party’s MBE depends on how its effort maps into votes, how votes map into seats, and how valuable seats are. While all three recently proposed measures rest on explicit calculations about how votes translate into seats, each relies on implicit assumptions about how effort maps into votes (and how costly effort is). Whether PR contests in MMDs are judged more or less competitive than single-member plurality (SMP) or majority runoff contests in SMDs depends directly on such assumptions.
Blais and Lago (Reference Blais and Lago2009) and Grofman and Selb (Reference Grofman and Selb2009, Reference Grofman and Selb2011) show that different measures of competitiveness give different answers to questions about the level and variability of competition in PR systems with MMDs. We reproduce this finding using district-level data for national parliamentary elections in Norway (1909–1927) and Switzerland (1971–2003). The Swiss case has previously been featured by Grofman and Selb (Reference Grofman and Selb2009), and is a useful test case due to within-country variation in district magnitude, including SMDs as well as MMDs (thus making our analysis less vulnerable to confounding factors that might limit cross-national comparisons). The Norwegian case we introduce to the body of empirical evidence also offers a useful context of within-country variation, as an electoral reform in 1919 shifted all elections from SMD to MMD contests with varying magnitude (see Fiva and Smith Reference Fiva and Smith2017; Cox, Fiva, and Smith Reference Cox, Fiva and Smith2019a).
We argue that the determination of whether elections in MMD systems are more or less competitive than SMD systems stems primarily from the different units in which distances are expressed by different measures. In particular, it matters a lot whether distances are denominated in vote shares (the traditional measure) or vote shares per seat (revisionist measures). On the basis of our theoretical logic, and separate sources of survey data capturing the modes through which parties and candidates mobilize voters across districts of varying magnitude, we argue that the vote-share-denominated measure of distance makes more sense.
Finally, we investigate the construct validity of the different measures of competitiveness. If a particular measure accurately reflects how close local elites perceive a given electoral contest to be, then it should be useful in predicting their mobilizational efforts and, hence, turnout. Using again the district-level data from Norwegian and Swiss elections covering both SMD and MMD elections, we contrast two families of distance measure—those denominating distances in vote shares (the traditional measure) and those denominating distances in vote shares per seat (those of Blais–Lago or Grofman–Selb). As do Blais–Lago and Grofman–Selb, we show that the relationship between distance and turnout attenuates when moving from SMDs to MMDs (regardless of the distance metric used). While we agree with Blais–Lago and Grofman–Selb regarding the pattern of evidence, this pattern directly challenges the construct validity of vote-share-per-seat measures but can easily be accommodated by vote-share measures. Accordingly, we argue in favor of vote-share measures as the most appropriate generalized measure of district-level competitiveness across different electoral systems.
2 Measuring the Competitiveness of District Elections
At a conceptual level, Blais and Lago (Reference Blais and Lago2009, 95) define a competitive election as “an election in which the outcome of the election is uncertain,” and argue that “the [more] uncertain the outcome of the election, the [more] competitive it is.” This conceptual definition builds upon a pivotal voter perspective of competitiveness articulated by Franklin (Reference Franklin2004, 57), who argues that “only in elections where there is uncertainty as to the numerical outcome does each voter who cares about the outcome have reason to believe that their votes might make a difference.”
We adopt a more general perspective, and one that considers the incentives of parties and elites to mobilize voters. In our conceptualization, competitiveness hinges not only on the uncertainty, but also the importance, of the outcome. In particular, we consider an election to be more competitive when the competing parties have greater incentives to exert effort—which depends both on how uncertain the outcome is and how important it would be to change it.Footnote 4
To illustrate the difference between our definition (which considers both the uncertainty and importance of the outcome) and that proposed by Blais and Lago (which focuses only on uncertainty), suppose that two evenly matched parties compete to win a single seat, with each having an equal chance of winning. Under Blais and Lago’s definition, this is the most competitive two-party election possible, since the outcome is as uncertain as possible. Now, consider two different contests between these evenly matched parties that differ only in importance of the outcome. In one contest, the parties compete for an office of negligible value and, accordingly, exert negligible effort. In another contest, they compete for an office of great value and, accordingly, exert significant effort. By Blais and Lago’s definition, the two contests are equally uncertain and hence equally competitive. By our more general definition, the second election is more competitive than the first because the stakes are higher. Parties (or candidates) will compete more fiercely when they have a chance of winning a bigger prize than when they have the same chance of winning a smaller prize.
With this conceptual point in mind, we can describe the existing measures of competitiveness in more detail. For SMD contests, the traditional measure of competitiveness is the simple difference in observed vote shares between the winner of the seat and the runner-up—expressed as a vote share, rather than in raw votes. This measure makes intuitive sense for SMD contests, but measuring competitiveness in MMD contests requires more consideration. Suppose  $J$ parties are competing in a given electoral district in which
 $M\geqslant 1$ seats will be awarded, and all
 $M$ seats will be allocated based on the votes cast in the district (no upper tiers). Moreover, neither joint lists nor apparentements are allowed. How should one measure the competitiveness of the contest between the
 $J$ parties?
Let  $V_{j}$ denote the number of votes received by party
 $j$, for
 $j=1,\ldots ,J$. Let
 $V_{\bullet }\equiv \sum _{j=1}^{J}V_{j}$ be the total votes cast, and
 $v_{j}=V_{j}/V_{\bullet }$ be
 $j$’s share of the votes. For a given vote vector
 $\boldsymbol{V}=(V_{1},\ldots ,V_{J})$, the seat vector
 $\boldsymbol{S}(\boldsymbol{V})=(S_{1}(\boldsymbol{V}),\ldots ,S_{J}(\boldsymbol{V}))$ gives the number of seats awarded to each party. The mapping
 $\boldsymbol{V}\rightarrow \boldsymbol{S}(\boldsymbol{V})$ is determined by the electoral rules in force.
Now consider how many votes would have to change in order to change the seat allocation.Footnote 5 To answer this question, one needs a metric of the “distance” to a seat change.
2.1 Single-Party Versus Multiparty Measures
The single-party measure upon which we shall initially focus begins by calculating two numbers. First,  $N_{j}^{+}(\boldsymbol{V})$ is the minimum number of votes that
 $j$ must gain in order to win an additional seat, holding the other parties’ votes constant.Footnote 6 Second,
 $N_{j}^{-}(\boldsymbol{V})$ is the minimum number of votes that
 $j$ must lose in order to lose a seat, holding the other parties’ votes constant.Footnote 7
The smaller of the raw vote counts,  $N_{j}(\boldsymbol{V})=min\{N_{j}^{+}(\boldsymbol{V}),N_{j}^{-}(\boldsymbol{V})\}$, is taken as measuring
 $j$’s incentive to mobilize, given the vote vector
 $\boldsymbol{V}$. We shall henceforth simplify our notation, writing just
 $N_{j}^{+}$,
 $N_{j}^{-}$, and
 $N_{j}$, the dependence on
 $\boldsymbol{V}$ being understood. We will consider how to normalize or scale
 $N_{j}$ later.
Any single-party measure must make assumptions about the other parties when it calculates the minimum votes a given party would need to gain in order to win an additional seat. Grofman and Selb (Reference Grofman and Selb2009) focus on a worst-case scenario for the focal party: What is the minimum increase in votes that would guarantee the party another seat (regardless of vote reallocations among the other parties)?Footnote 8 Let  $N_{j}^{GS+}$ denote the answer. Blais and Lago (Reference Blais and Lago2009), in contrast, consider the scenario in which all other parties’ votes are held constant. In other words, they focus on
 $N_{j}^{+}$.
Rather than considering hypothetical vote gains (or losses) by a single party, one might instead consider patterns of gains and losses across all the parties. Let  $\boldsymbol{R}=(R_{1},\ldots ,R_{J})$ be a vector of raw vote gains (
 $R_{j}>0$) or losses (
 $R_{j}<0$). Let
 $R_{\bullet }^{(j)}$ be the “smallest” change that gives an additional seat to party
 $j$. That is,
 $R_{\bullet }^{(j)}=\sum _{h=1}^{J}|R_{h}^{(j)}|$. In other words,
 $R_{\bullet }^{(j)}$ represents the smallest number of votes that would have to be added or subtracted, without restricting which party was gaining or losing the votes, in order to confer an additional seat on party
 $j$. This is the distance metric proposed by Folke (Reference Folke2014), measured in the form of vote shares. Note that the votes that a particular party gains can be generated either by mobilizing supporters who were previously not voting or by persuading other parties’ supporters to change their votes.Footnote 9
2.2 Issues of Units and Aggregation
Any measure of the distance in votes to a seat change must answer the following two questions. First, in what units should the vote distances be expressed? Should distances be stated in raw votes? Should they be stated in shares of the vote (as in the traditional measure for SMDs, and in Folke’s measure for MMDs)? Or, should they be expressed as shares of the votes cast per seat (following Blais and Lago Reference Blais and Lago2009, and Grofman and Selb Reference Grofman and Selb2009)?Footnote 10
Second, how should the party-specific distances be aggregated into a district-wide measure? One approach would be to focus on the single party with the strongest incentive to mobilize. Blais and Lago (Reference Blais and Lago2009, 96) take this approach, calculating “the minimal number of additional votes required, under the existing rules, for any party to win one additional seat.”Footnote 11 Grofman and Selb (Reference Grofman and Selb2009) instead opt for a weighted average, where the weights are the parties’ respective vote shares.Footnote 12 In our empirical analysis, we consider aggregations of both types—minima and weighted averages—finding that there is not much difference in the resulting measures. We discuss these issues further in the next section.
3 The Marginal Benefit of Effort
If vote distances reflect parties’ perceptions of electoral competitiveness, then they should be able to predict how parties exert campaign effort. In this section, we imagine that each party  $j$ can exert some kind of mobilizational effort, denoted by
 $e_{j}$. For example,
 $e_{j}$ might represent the number of advertisements (urging supporters to vote) that party
 $j$ purchases. Let
 $\boldsymbol{e}=(e_{1},\ldots ,e_{J})$ represent the choices made by all parties.
Let the parties’ expected vote shares, given  $\boldsymbol{e}$, be denoted
 $\boldsymbol{v}(\boldsymbol{e})=(v_{1}(\boldsymbol{e}),\ldots ,v_{J}(\boldsymbol{e}))$ and their expected seat shares, given
 $\boldsymbol{v}$, be denoted
 $\boldsymbol{s}(\boldsymbol{v})=(s_{1}(\boldsymbol{v}),\ldots ,s_{J}(\boldsymbol{v}))$. We continue to use lower-case variables for vote or seat shares, reserving upper-case variables for raw totals. The mapping
 $\boldsymbol{v}\rightarrow \boldsymbol{s}(\boldsymbol{v})$ depends on the electoral rules.
We shall assume that party  $j$’s payoff equals
 $s_{j}(\boldsymbol{v}(\boldsymbol{e}))Mb-c(e_{j})$. The first term reflects
 $j$’s expected share
 $s_{j}(\boldsymbol{v}(\boldsymbol{e}))$ of the
 $M$ seats at stake in the district, each of which is worth
 $b$ utils.Footnote 13 Against this expected benefit must be weighed the cost of effort, denoted by
 $c(e_{j})$.
The marginal benefit of effort for party  $j$ (
 $MBE_{j}$) can be written as follows:
 $$\begin{eqnarray}\text{MBE}_{j}\equiv \frac{\unicode[STIX]{x2202}s_{j}(\boldsymbol{v}(\boldsymbol{e}))Mb}{\unicode[STIX]{x2202}e_{j}}=\frac{\unicode[STIX]{x2202}v_{j}}{\unicode[STIX]{x2202}e_{j}}\frac{\unicode[STIX]{x2202}s_{j}}{\unicode[STIX]{x2202}v_{j}}Mb.\end{eqnarray}$$
Equation (1) reveals that party  $j$’s MBE depends on three factors: how quickly effort translates into votes (
 $\unicode[STIX]{x2202}v_{j}/\unicode[STIX]{x2202}e_{j}$); how quickly votes translate into seats (
 $\unicode[STIX]{x2202}s_{j}/\unicode[STIX]{x2202}v_{j}$); and the total value of the seats at stake (
 $Mb$). The larger the MBE is, the greater the party’s incentive to mobilize its supporters and, thus, the higher turnout is expected to be (Cox Reference Cox1999; Herrera, Morelli, and Palfrey Reference Herrera, Morelli and Palfrey2014).
Extant measures of competitiveness focus exclusively on the votes-to-seats mapping. Their respective authors offer various ways of calculating the minimum votes needed to change the seat allocation in  $j$’s favor. These minimum vote measures—e.g.,
 $N_{j}^{GS+}$,
 $N_{j}^{+}$,
 $R_{\bullet }^{(j)}$—suggest “how fast” more votes will turn into additional seats. They, or more precisely their normalized inverses, can thus proxy for
 $\unicode[STIX]{x2202}s_{j}/\unicode[STIX]{x2202}v_{j}$ in Equation (1).
3.1 The Importance of the Effort-to-Votes Mapping
If  $\unicode[STIX]{x2202}v_{j}/\unicode[STIX]{x2202}e_{j}=0$, then it does not matter how large or small the vote distance to a seat change is. Thus, if they are to be useful in predicting parties’ mobilizational efforts, extant measures must rely on some assumptions about how effort translates into votes.
To further explain this observation, consider a hypothetical area in which two parties, A and B, compete. Each party’s supporters are uniformly distributed across the area. The area can be carved into electoral districts in various ways—all single-seat districts, a mix of 1-seat and 2-seat districts, and so forth. We assume perfect apportionment: a single-seat district has n voters, a 2-seat district has 2n voters, and so on. We also assume that the seats in each district are allocated by the D’Hondt rule.
Suppose that in each district in the area, in the absence of any mobilization, party A is expected to get all the votes and party B none. This scenario—the least competitive possible—makes it easy to compute the minimum votes needed to change the seat allocation. (The reason party B expects to get zero votes, let us say, is that all of its supporters bear positive costs of participation while some of party A’s supporters have nonpositive costs; thus, there is a Nash equilibrium in which none of party B’s supporters vote and some of party A’s supporters do.)
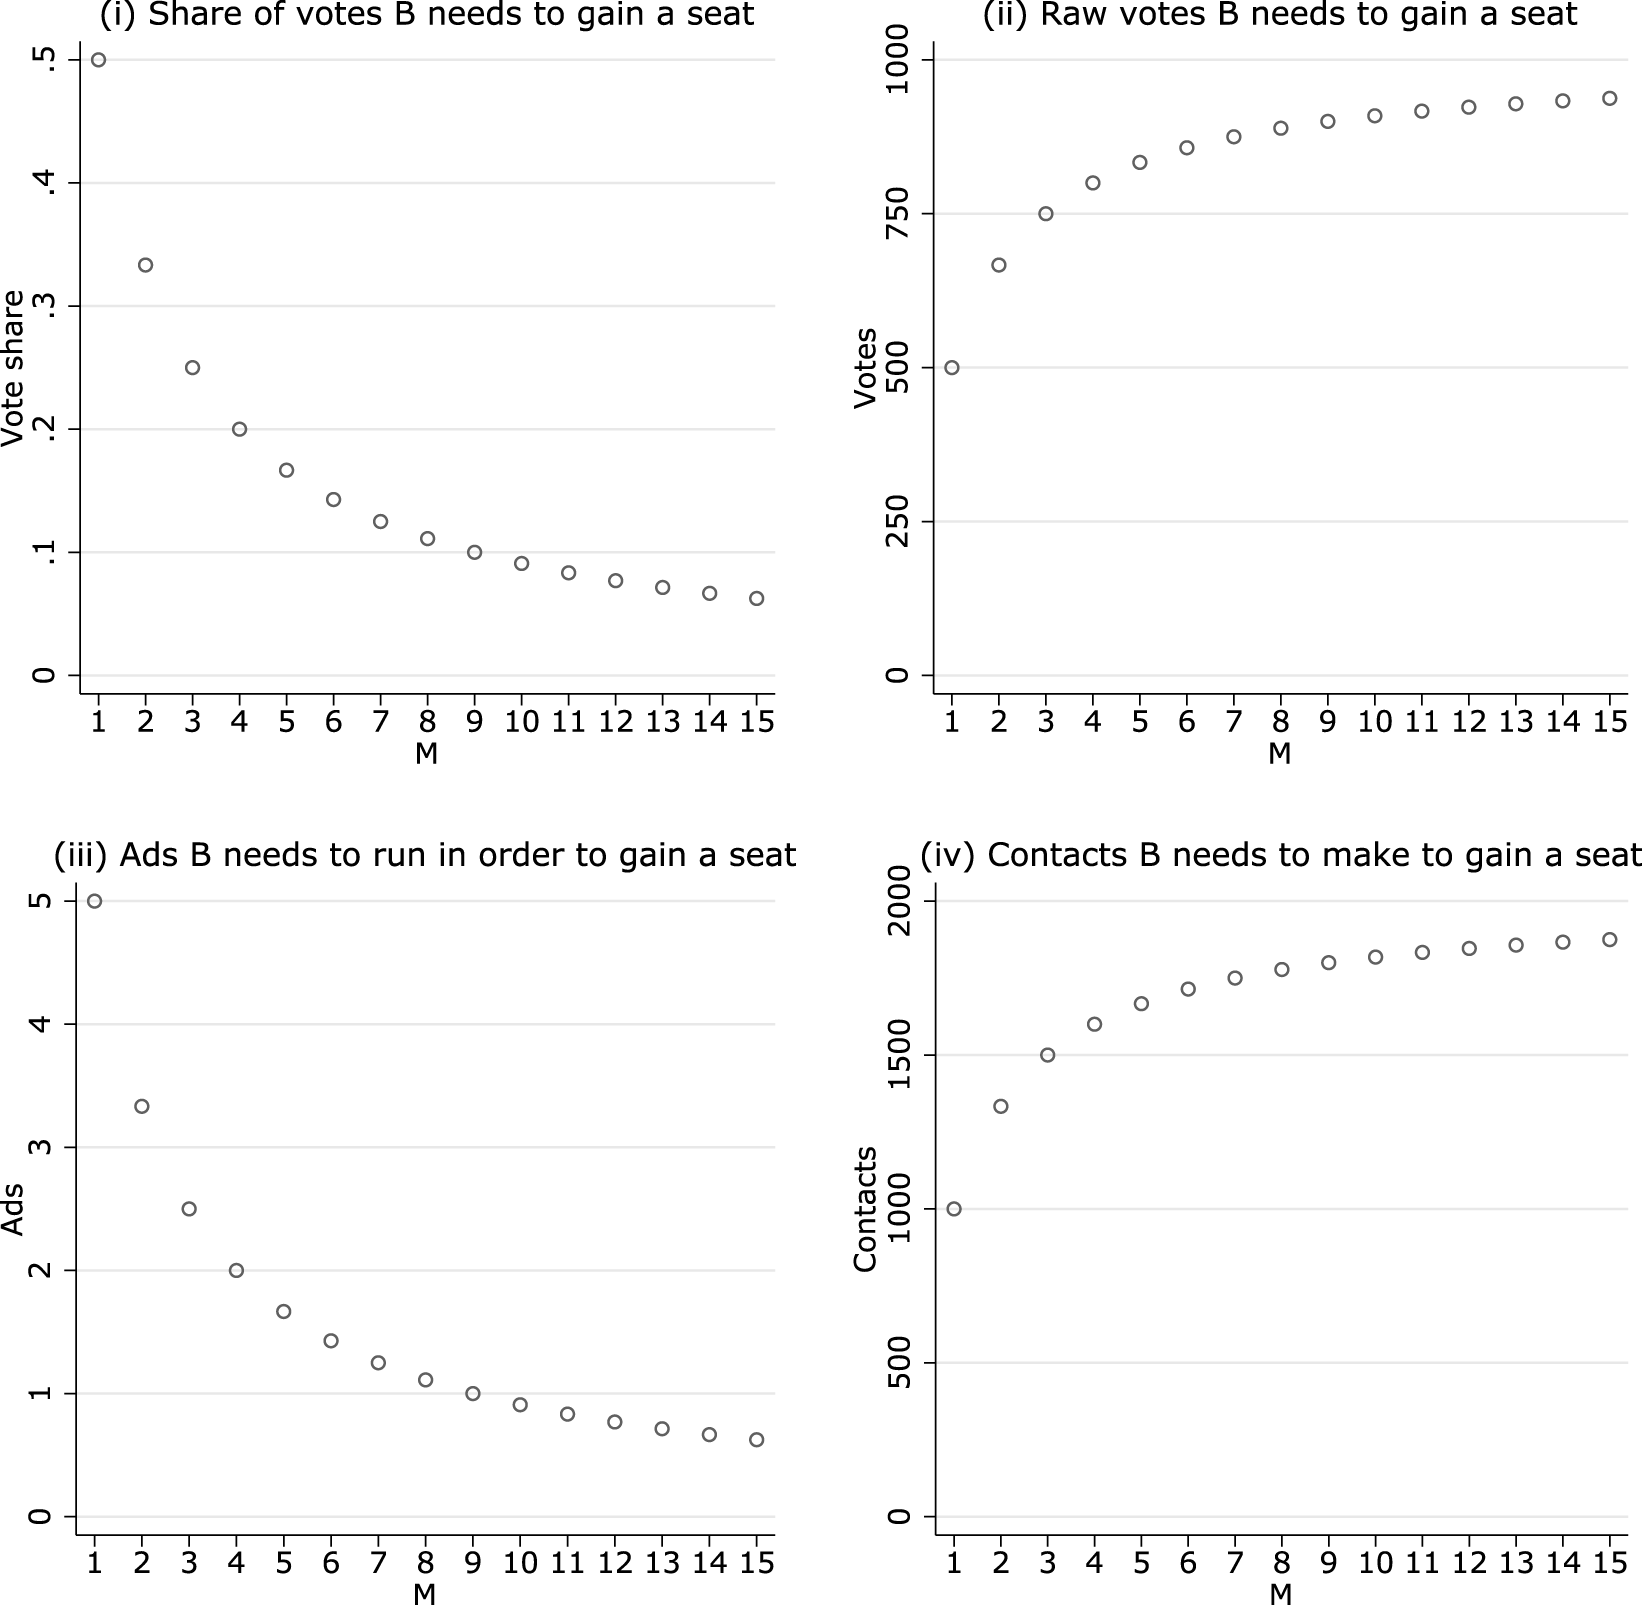
Effort, votes, and seats: which units should be used for measurement? Note: We consider a situation where two parties, A and B, compete for office in a PR system with districts of varying magnitude (M), where, in the absence of mobilization, party A is expected to get all the votes. This figure illustrates the relationship between district magnitude and (i) the share of votes party B needs to gain a seat (i.e., the threshold of exclusion), (ii) the number of votes B needs to gain a seat, (iii) the number of ads B needs to run, to gain a seat, and (iv) the individual contacts B needs to make, to gain a seat. We assume that seats are allocated by the D’Hondt rule, the number of voters is  $\text{1,000}\cdot M$ (perfect apportionment), each ad mobilizes 10 percent of voters (
 $z=0.1$), and that every other individual contacted is persuaded to vote (
 $y=0.5$). Appendix Table A.1 gives a general summary of the distances to a seat gain for party B in table format.

Figure 1 plots the distance to a seat gain for party B denominated in vote shares (top-left panel) and raw votes (top-right panel) against district magnitude. For the purposes of illustration, we assume perfect turnout with  $n=\text{1,000}$ voters (such that mobilization by party B persuades would-be supporters of party A to change their vote).Footnote 14 While the share of votes party B needs to gain a seat falls with district magnitude, the opposite is true for raw votes. Now, instead of focusing on the number or share of votes that party B needs to gain its first seat, consider the minimum effort it would have to exert, in order to gain its first seat. Does that effort increase with
 $M$, because the technology of mobilization exhibits no economies of scale? Or does it decline, because there are economies of scale in mobilization?
An example of a scalable mobilization technology is advertising in a mass media market that covers the area. Suppose a unit ad mobilizes the same positive proportion of voters,  $z>0$, regardless of where they reside in the market; and that ads translate linearly into vote shares: each additional ad generates the same increase in vote share (at least over some range). Thus, if an ad is purchased and the election in question is held in a 1-seat district, then the ad yields nz votes. If the election in question is held in a 2-seat district, then the ad yields 2nz votes. And so on.
The effort distance—the minimum number of ads a party must run to gain an additional seat—is  $d_{ads}(z,M)=1/(M+1)z$. Note that the effort distance declines with district magnitude:
 $\unicode[STIX]{x2202}d_{ads}(z,M)/\unicode[STIX]{x2202}M<0$. We illustrate this result in the bottom-left panel of Figure 1 where we assume
 $z=0.1$. If the cost of running ads is a concave increasing function of
 $e_{j}(c^{\prime }>0,c^{\prime \prime }\leqslant 0)$, then the cost distance—the minimum cost a party must bear to gain an additional seat—is also declining in
 $M$.
Now suppose that mobilization consists of contacting individual voters and persuading them to vote for the party—which might entail bribes or nonmonetary encouragement delivered through “get-out-the-vote” drives or door-to-door canvassing.Footnote 15 In this case, the effort distance—the number of contacts a party needs to make to gain an additional seat—is  $d_{\text{con}}(y,n,M)=Mn/(M+1)y$, where
 $y$ is the probability that a contact succeeds in persuading the voter to vote for the mobilizing party. Thus, the effort distance increases with district magnitude:
 $\unicode[STIX]{x2202}d_{\text{con}}(y,n,M)/\unicode[STIX]{x2202}M>0$. We illustrate this result in the bottom-right panel of Figure 1, where we assume a (constant) success rate of 0.5. Given convex increasing costs of contacting
 $(c^{\prime }>0,c^{\prime \prime }\geqslant 0)$, the cost distance is also increasing in
 $M$.Footnote 16
These observations lead to our first general conclusion. Parties’ decisions to mobilize will depend on the minimum cost they must bear to gain a marginal seat. Thus, measuring distance in votes needed to gain a seat is not enough. If vote distances are to be a defensible proxy for cost distances—which is what we would ideally like to measure—one needs additional assumptions about how effort translates into votes and about the cost of effort.Footnote 17
3.2 The Units of Vote Distances
We do not know the effort-to-votes or the cost-of-effort functions. However, different assumptions about these functions have implications for the units in which vote distances should be expressed. If parties use mostly a scalable technology, such as ads, then one should measure competitiveness in vote shares. However, if parties use mostly a nonscalable technology, such as personal contacts, then vote distances should be expressed in raw votes.
Our view is that parties use a mix of mobilizational technologies, but that they have a large incentive to switch to scalable technologies when district magnitude (hence district population) increases. A similar idea from the literature on democratization is that suffrage expansions (which increase the number of voters who must be convinced to give the party their support) make it “too expensive to contest elections on the basis of bribery” (Lizzeri and Persico Reference Lizzeri and Persico2004, 750) and thus induce a transition from such person-to-person exchanges toward wooing voters by the scalable technology of making public promises to enact legislation (Seymour, Reference Seymour1915, 453–454; Cox, Reference Cox1987; Stokes et al., Reference Stokes, Dunning, Nazareno and Brusco2013).
As regards mobilizational technologies specifically, the analysis of Dalton, Farrell, and McAllister (Reference Dalton, Farrell and McAllister2013) using voter survey data from thirty-six countries in the Comparative Study of Electoral Systems (CSES) database shows that voters’ reported direct contact with parties (i.e., a nonscalable mobilization technology) during election campaigns declines significantly with district magnitude (see also Karp, Banducci, and Bowler Reference Karp, Banducci and Bowler2008). Rainey (Reference Rainey2015) makes an argument about competitiveness and incentives to mobilize that is similar to ours and also offers cross-national evidence from the CSES surveys to support the argument. He finds that voters in SMD contests are more likely to report having been directly contacted by a candidate or party as district competitiveness increases, whereas the relationship between competitiveness and direct contact in PR contests in MMDs is much weaker.
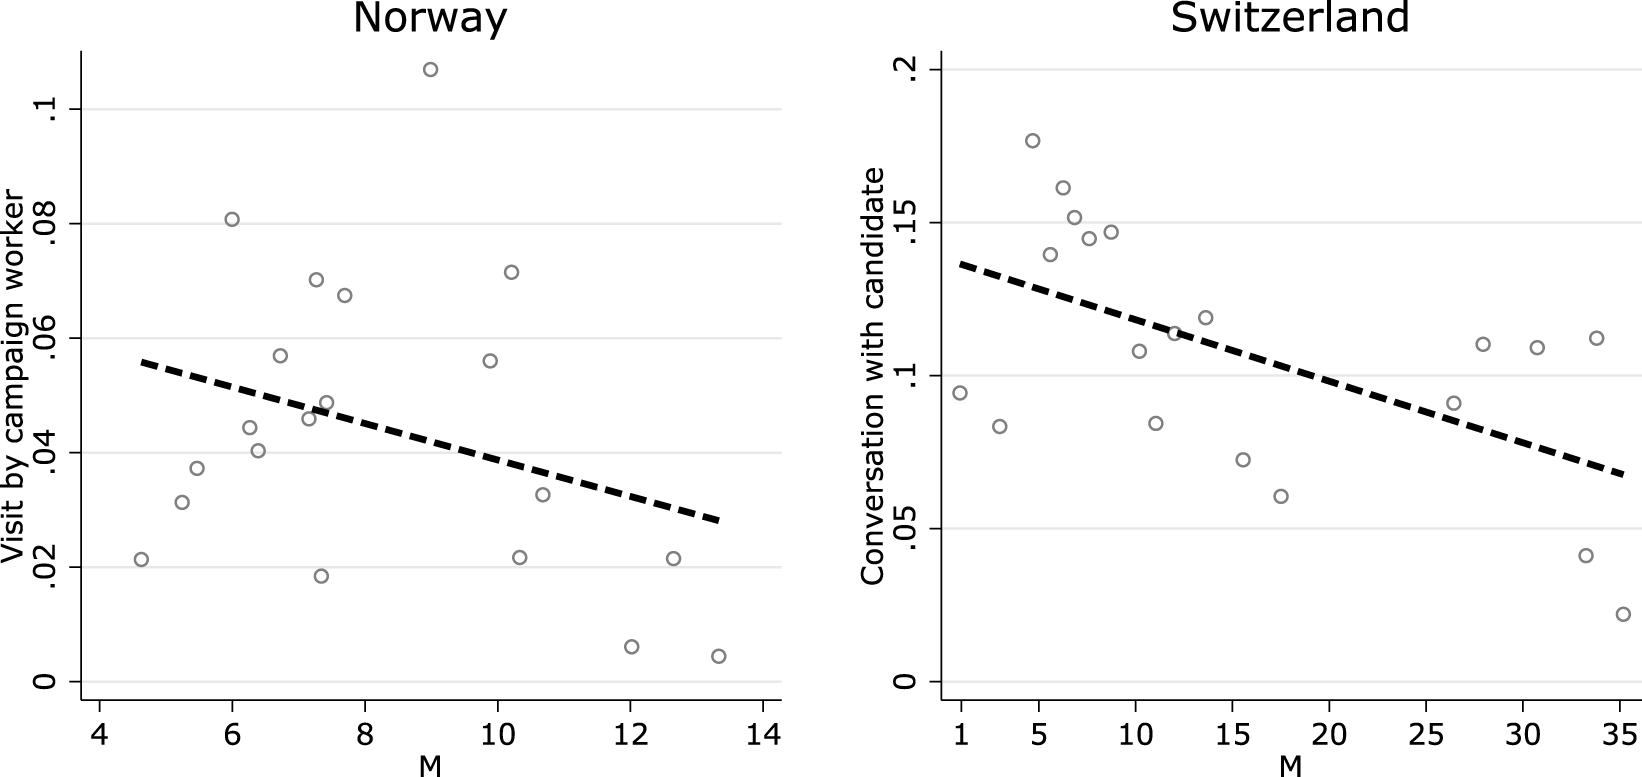
Direct contact and district magnitude: voter survey evidence from Norway and Switzerland. Note: The figure shows the relationship between a nonscalable mobilization technology—direct contact by campaign workers and candidates—and district magnitude. The left-hand panel uses data from the 1965–1969 Norwegian Election Studies surveys ( $N=\text{3,099}$) made available by the Norwegian Center for Research Data (NSD). Respondents were asked whether any party’s campaign worker visited them during the campaign. The right-hand panel uses data from the 1987–1991 Swiss National Election Studies surveys (
 $N=\text{1,895}$) made available by the Swiss Centre of Expertise in the Social Sciences (FORS). Respondents were asked if they made use of conversations with candidates as information regarding the election campaign. In each panel, we show binned scatterplots residualized by year fixed effects and survey respondent background characteristics (age, gender, education level, and marital status). Each bin includes the same number of observations and the linearly fitted lines are based on the underlying data. Appendix Figure B.1 presents the data with a quadratic fit line.

Neither of these studies directly tests whether direct contact increases with M within PR systems (the CSES database includes only a variable capturing average district magnitude for the entire country). In Figure 2, we present evidence of this extension of the logic using within-country survey data on voters’ interactions with political operatives in campaigns across districts of varying magnitude in both Norway and Switzerland, for a subset of election years in which such survey evidence is available.Footnote 18 The empirical data available for Norway do not cover the historical period when SMDs were in use. We can, however, investigate whether the use of nonscalable technologies of mobilization, viz. direct contact with either a candidate or a party campaign worker during the election campaign, is negatively correlated with district magnitude in general. If one fits a linear model to the data, the relationship is indeed negative in both country cases: higher M, fewer direct contacts.Footnote 19
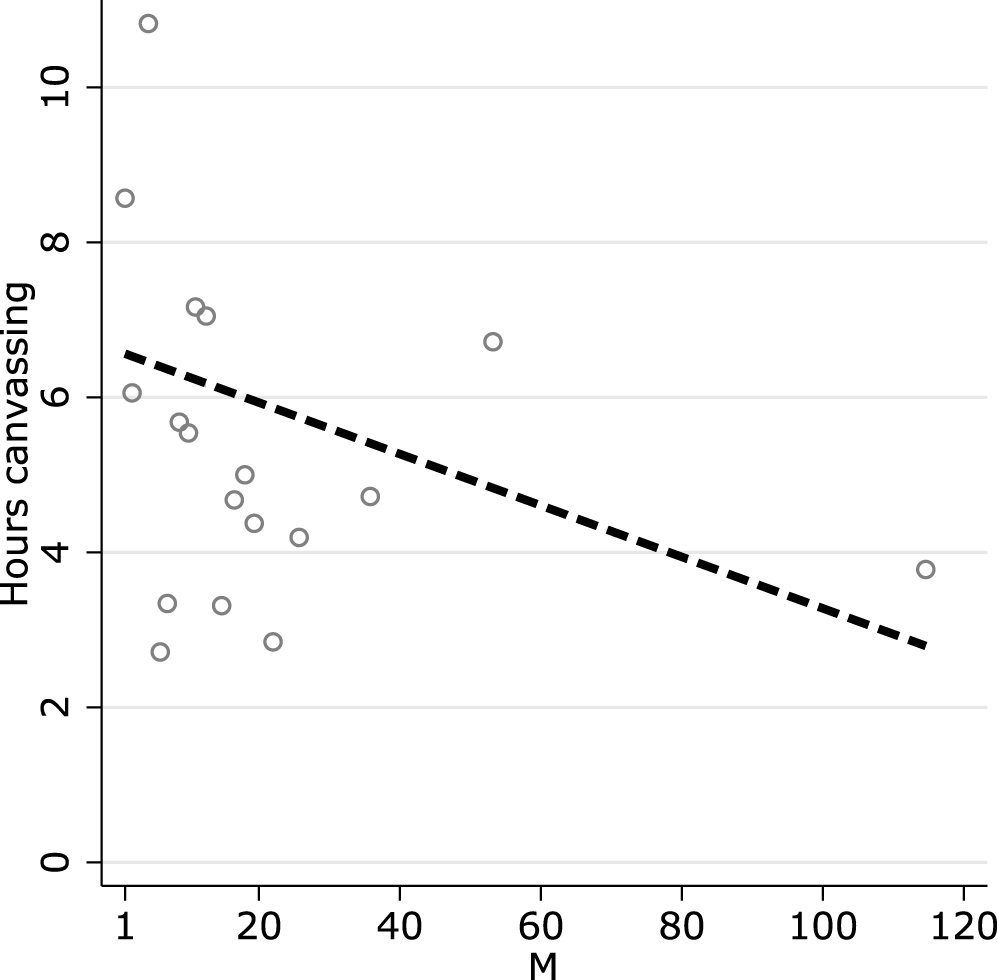
Direct contact and district magnitude: cross-national candidate survey evidence. Note: This figure uses data from Module 1 of the Comparative Candidates Survey (CCS) data set made available by the Swiss Centre of Expertise in the Social Sciences (FORS). Candidates were asked how many hours they spent on door knocking/canvassing per week during the last month before of the election: (i) 0 hours, (ii) 1–5 hours (we code this as 3 hours), (iii) 5–10 hours (coded as 8 hours), (iv) 10–15 hours (coded as 13 hours), (v) 15–20 hours (coded as 18 hours), and (vi) “more than that” (coded as 25 hours). Some countries collapse category (iv) and (v) (coded as 15 hours). We use the respondents from the following European countries (N): Switzerland (3,276), Ireland (166), Greece (241), Finland (1,433), Belgium (891), Netherlands (170), Portugal (453), Iceland (352), Hungary (402), Denmark (375), Romania (406), Norway (948), Italy (672), and the United Kingdom (1,472). The figure shows binned scatterplots based on the raw data, where each bin includes the same number of observations. Linearly fitted lines are based on the underlying data.

The patterns in Figure 2 are based on voters’ reported interactions with political operatives. To complement this evidence, in Figure 3 we use cross-national survey data from the Comparative Candidates Survey (CCS) to explore what candidates themselves report about their campaign strategies.Footnote 20 The CCS country surveys asked candidates about the use of various campaign activities and the number of hours spent on each activity. Plotting number of hours spent “knocking on doors and canvassing” over district magnitude for fourteen European democracies, we again see a familiar pattern: across Europe, candidates tend to spend more time engaging in nonscalable mobilization strategies (in this case, direct contact with voters) when they are running in districts of smaller magnitude.Footnote 21
Thus, the available empirical evidence on mobilization strategies—from the experience of both voters and candidates—provides ample justification to denominate vote distances in shares rather than raw votes.
3.3 Single-Party Versus Multiparty and Minima Versus Weighted Average
We have now argued that vote shares are a more appropriate measure of distance than raw votes. Before considering whether the vote-share distance measure should be normalized by the number of seats (as in the revisionist measures), we first briefly turn to the question of aggregation to the district level—i.e., whether to use single-party or multiparty measures and whether to weight by vote share. Does it matter whether the distance measure is based on a single party’s hypothetical gain or loss needed to change the seat outcome (i.e., the traditional measure), versus patterns of gains and losses across all the parties (Folke Reference Folke2014)? And does it matter whether we choose the minimum distance across parties or a weighted average of these distances?
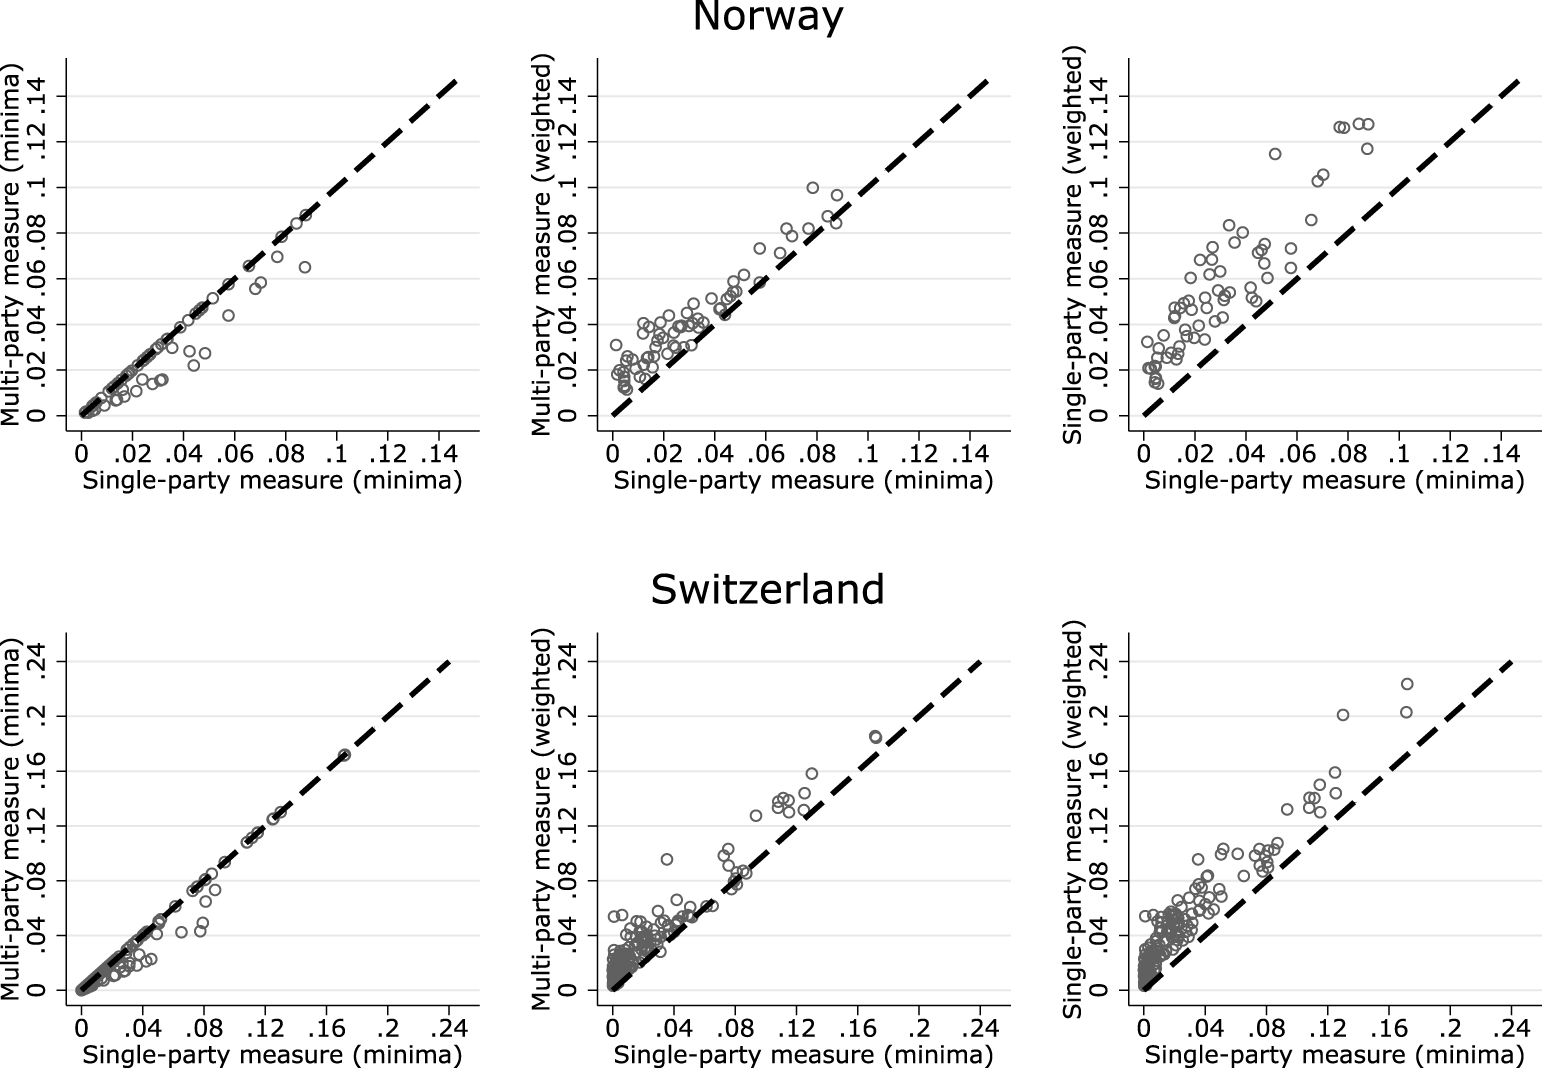
Figure 4 again uses data from Norway and Switzerland to examine the implications of these measurement decisions. How correlated are each of these measures?Footnote 22 In short, this exercise shows that it is not important whether we choose a minima-based approach rather than a weighted-average approach. The correlation between the two alternative measures is 0.95 in our sample, for both countries. Nor is it important whether we take a single-party rather than a multiparty approach. For simplicity, we use the single-party minima measure in the remainder of our investigations.
Comparing across measurement decisions. Note: On the horizontal axis in each subpanel we measure the hypothetical gain or loss needed to change the seat outcome for any party (i.e., the traditional single-party measure). On the vertical axis in the left-hand panel we consider hypothetical gains and losses across all parties needed to change the seat outcome for any party (Folke, 2014). On the vertical axis in the middle panel we use a vote-share weighted average of the multiparty measure. On the vertical axis in the right-hand panel we use a vote-share weighted average of the single-party measure. In the top rows, we use the data set of Cox, Fiva, and Smith (Reference Cox, Fiva and Smith2016) covering Norway, 1921–1927 (excluding the SMD period). In the bottom rows, we use data from Switzerland, 1971–2003 (Grofman and Selb Reference Grofman and Selb2011). We exclude SMDs and one district where voting is compulsory (Schaffhausen).

4 Are PR Elections Closer and Less Variable?
Whether the units of distance are vote shares or vote shares per seat matters in assessing some important claims recently made by Blais and Lago (Reference Blais and Lago2009) and Grofman and Selb (Reference Grofman and Selb2011). Blais and Lago (Reference Blais and Lago2009, 95) point out that it is conventional wisdom that “elections are more competitive under PR than under SMP.” Yet, as Grofman and Selb (Reference Grofman and Selb2011, 99) point out, “this seemingly obvious claim has almost never been properly tested.” Moreover, when Blais and Lago (95) and Grofman and Selb (105) perform tests based on their respective measures of competitiveness, both find evidence against the conventional wisdom.
Similarly, when Blais and Lago (Reference Blais and Lago2009, 95) investigate another bit of conventional wisdom—that “local competitiveness is more variable under SMP than under PR” (Cox, Rosenbluth, and Thies Reference Cox, Rosenbluth and Thies1998; Cox Reference Cox1999)—they find that this too “proves to be wrong.” Conventional wisdom 0, new measures 2.
Of course, both sets of authors note that the “traditional” measure of distance (denominated in vote shares) supports the conventional wisdom. In particular, using the traditional measure, vote distances decline in mean and variance as district magnitude increases.
To illustrate this point, we use the historical data from Norwegian Storting elections (1909–1927) and the more recent data from Swiss National Council elections (1971–2003). As previously noted, the Norwegian data have the advantage of holding country-specific factors constant, while spanning an electoral reform from runoff elections in SMDs to PR elections in MMDs (Cox, Fiva, and Smith Reference Cox, Fiva and Smith2016).Footnote 23 The Swiss data have the useful feature that district magnitude varies across districts in each election—from single-seat districts to large MMDs (Grofman and Selb Reference Grofman and Selb2009).
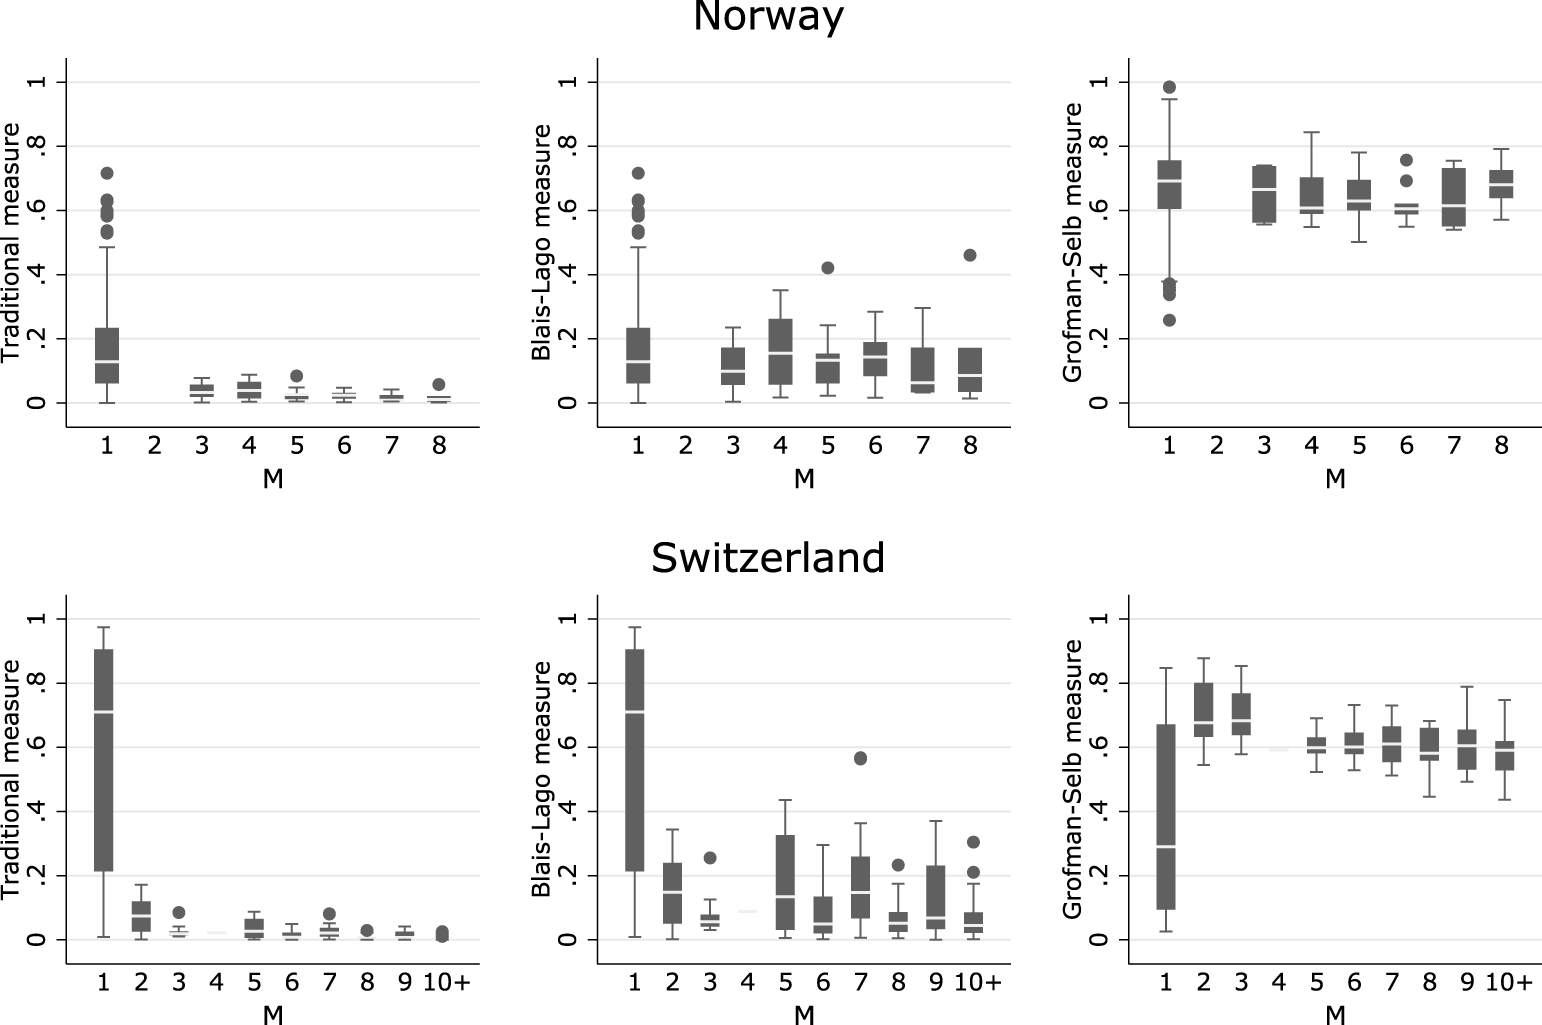
We calculate both a traditional measure of distance, based on the minimum vote-share gain that would earn an additional seat for a single party, and the new measures proposed by Blais–Lago and Grofman–Selb. We then use box-and-whisker plots to summarize the distribution of computed distances for each measure, as a function of district magnitude. As can be seen in the left panels of Figure 5, the traditional distances decline in both mean and variance as district magnitude increases. The Blais–Lago measure (middle panels) declines in both country cases when moving from  $M=1$ to
 $M>1$, but then exhibits no clear pattern. Similarly, as the right panels illustrate, neither the mean nor the variance of the Grofman–Selb index of competition changes consistently with district magnitude, apart from a decrease in variance when moving from
 $M=1$ to
 $M>1$.Footnote 24
Alternative measures of competitiveness and the relationship of each with district magnitude. Note: The left-hand panels relate the minimum vote-share gain that would earn an additional seat for a single party to district magnitude. The middle panels relate Blais and Lago’s (Reference Blais and Lago2009) measure to district magnitude. The right-hand panels relate Grofman–Selb’s (Reference Grofman and Selb2009) index of competition to district magnitude. In the top panel, we use the balanced panel data set of Cox, Fiva, and Smith (Reference Cox, Fiva and Smith2016) covering Norway, 1909–1927. Two-round elections were used from 1909 to 1918; PR from 1921 to 1927. In the prereform period we construct the distance measures using the electoral results from the first round. In the bottom panel, we use data from Switzerland, 1971–2003 (Grofman and Selb Reference Grofman and Selb2011). We exclude one district where voting is compulsory (Schaffhausen).

All told, the conclusion is clear. The conventional wisdom is vindicated when one measures vote distances in shares of the vote. The revisionist position is vindicated when one measures vote distances in vote shares per seat. So, the next question is: how can one tell which unit of distance is the correct one to use?
A central point of our analysis is that one must explicitly justify measures in terms of the assumptions about the effort-to-votes mapping they entail. Our preferred measure of competitiveness, denominated in vote shares, is justified if effort translates linearly into vote shares. We have argued that this is true for “scalable” technologies, such as TV or newspaper ads. Indeed, we simply follow the standard assumption in marketing and public opinion studies, which is that ads have a linear per-viewer effect. As long as districts are nested within relevant media markets (cf. Snyder and Strömberg Reference Snyder and Strömberg2010), this assumption justifies denominating distances in vote shares.
To justify denominating distances in vote shares per seat, one must assume that effort translates linearly into vote shares per seat. Thus far, no one has defended such an assumption; nor do we see an obvious line of argument that could do so. Thus, purely in terms of grounding each measure in an explicit assumption about the effort-to-votes mapping, we prefer denominating distances in vote shares, rather than vote shares per seat. In the next section, we provide an additional reason to prefer vote-share-denominated measures, based on their construct validity.
5 Construct Validity: Does Competitiveness Predict Turnout?
Construct validity is the degree to which inferences can legitimately be made from the operationalization of a measure to the theoretical construct on which it is based (Trochim and Donnelly Reference Trochim and Donnelly2008, 56–57). A common method of assessing the construct validity of a proposed measure is to examine whether it is empirically correlated with other variables with which it should, given theoretical expectations, correlate (Adcock and Collier Reference Adcock and Collier2001, 537). To put it another way, evaluating construct validity involves examining whether the proposed measure correlates with variables that are known to be related to the construct.
In our case, the construct of interest is the perceived closeness of an electoral contest. When elite actors, such as candidates and parties, perceive that a particular district is more competitive, they should exert more effort to mobilize their supporters, thereby boosting turnout. These straightforward predictions about mobilization and turnout have been extensively explored and validated in previous works focusing on SMDs operating under majoritarian rules (e.g., Denver and Hands Reference Denver and Hands1974; Cox and Munger Reference Cox and Munger1989).
What about MMDs operating under PR rules? The Blais–Lago and Grofman–Selb measures of competitiveness vary considerably across both MMDs in PR systems and across SMDs in majoritarian systems. Since the operational measure varies widely across districts in both MMD and SMD systems, elite perceptions should also vary widely—if the measure has construct validity. Thus, the correlation between district-level competitiveness and turnout should be just as strong in PR systems as in majoritarian systems.
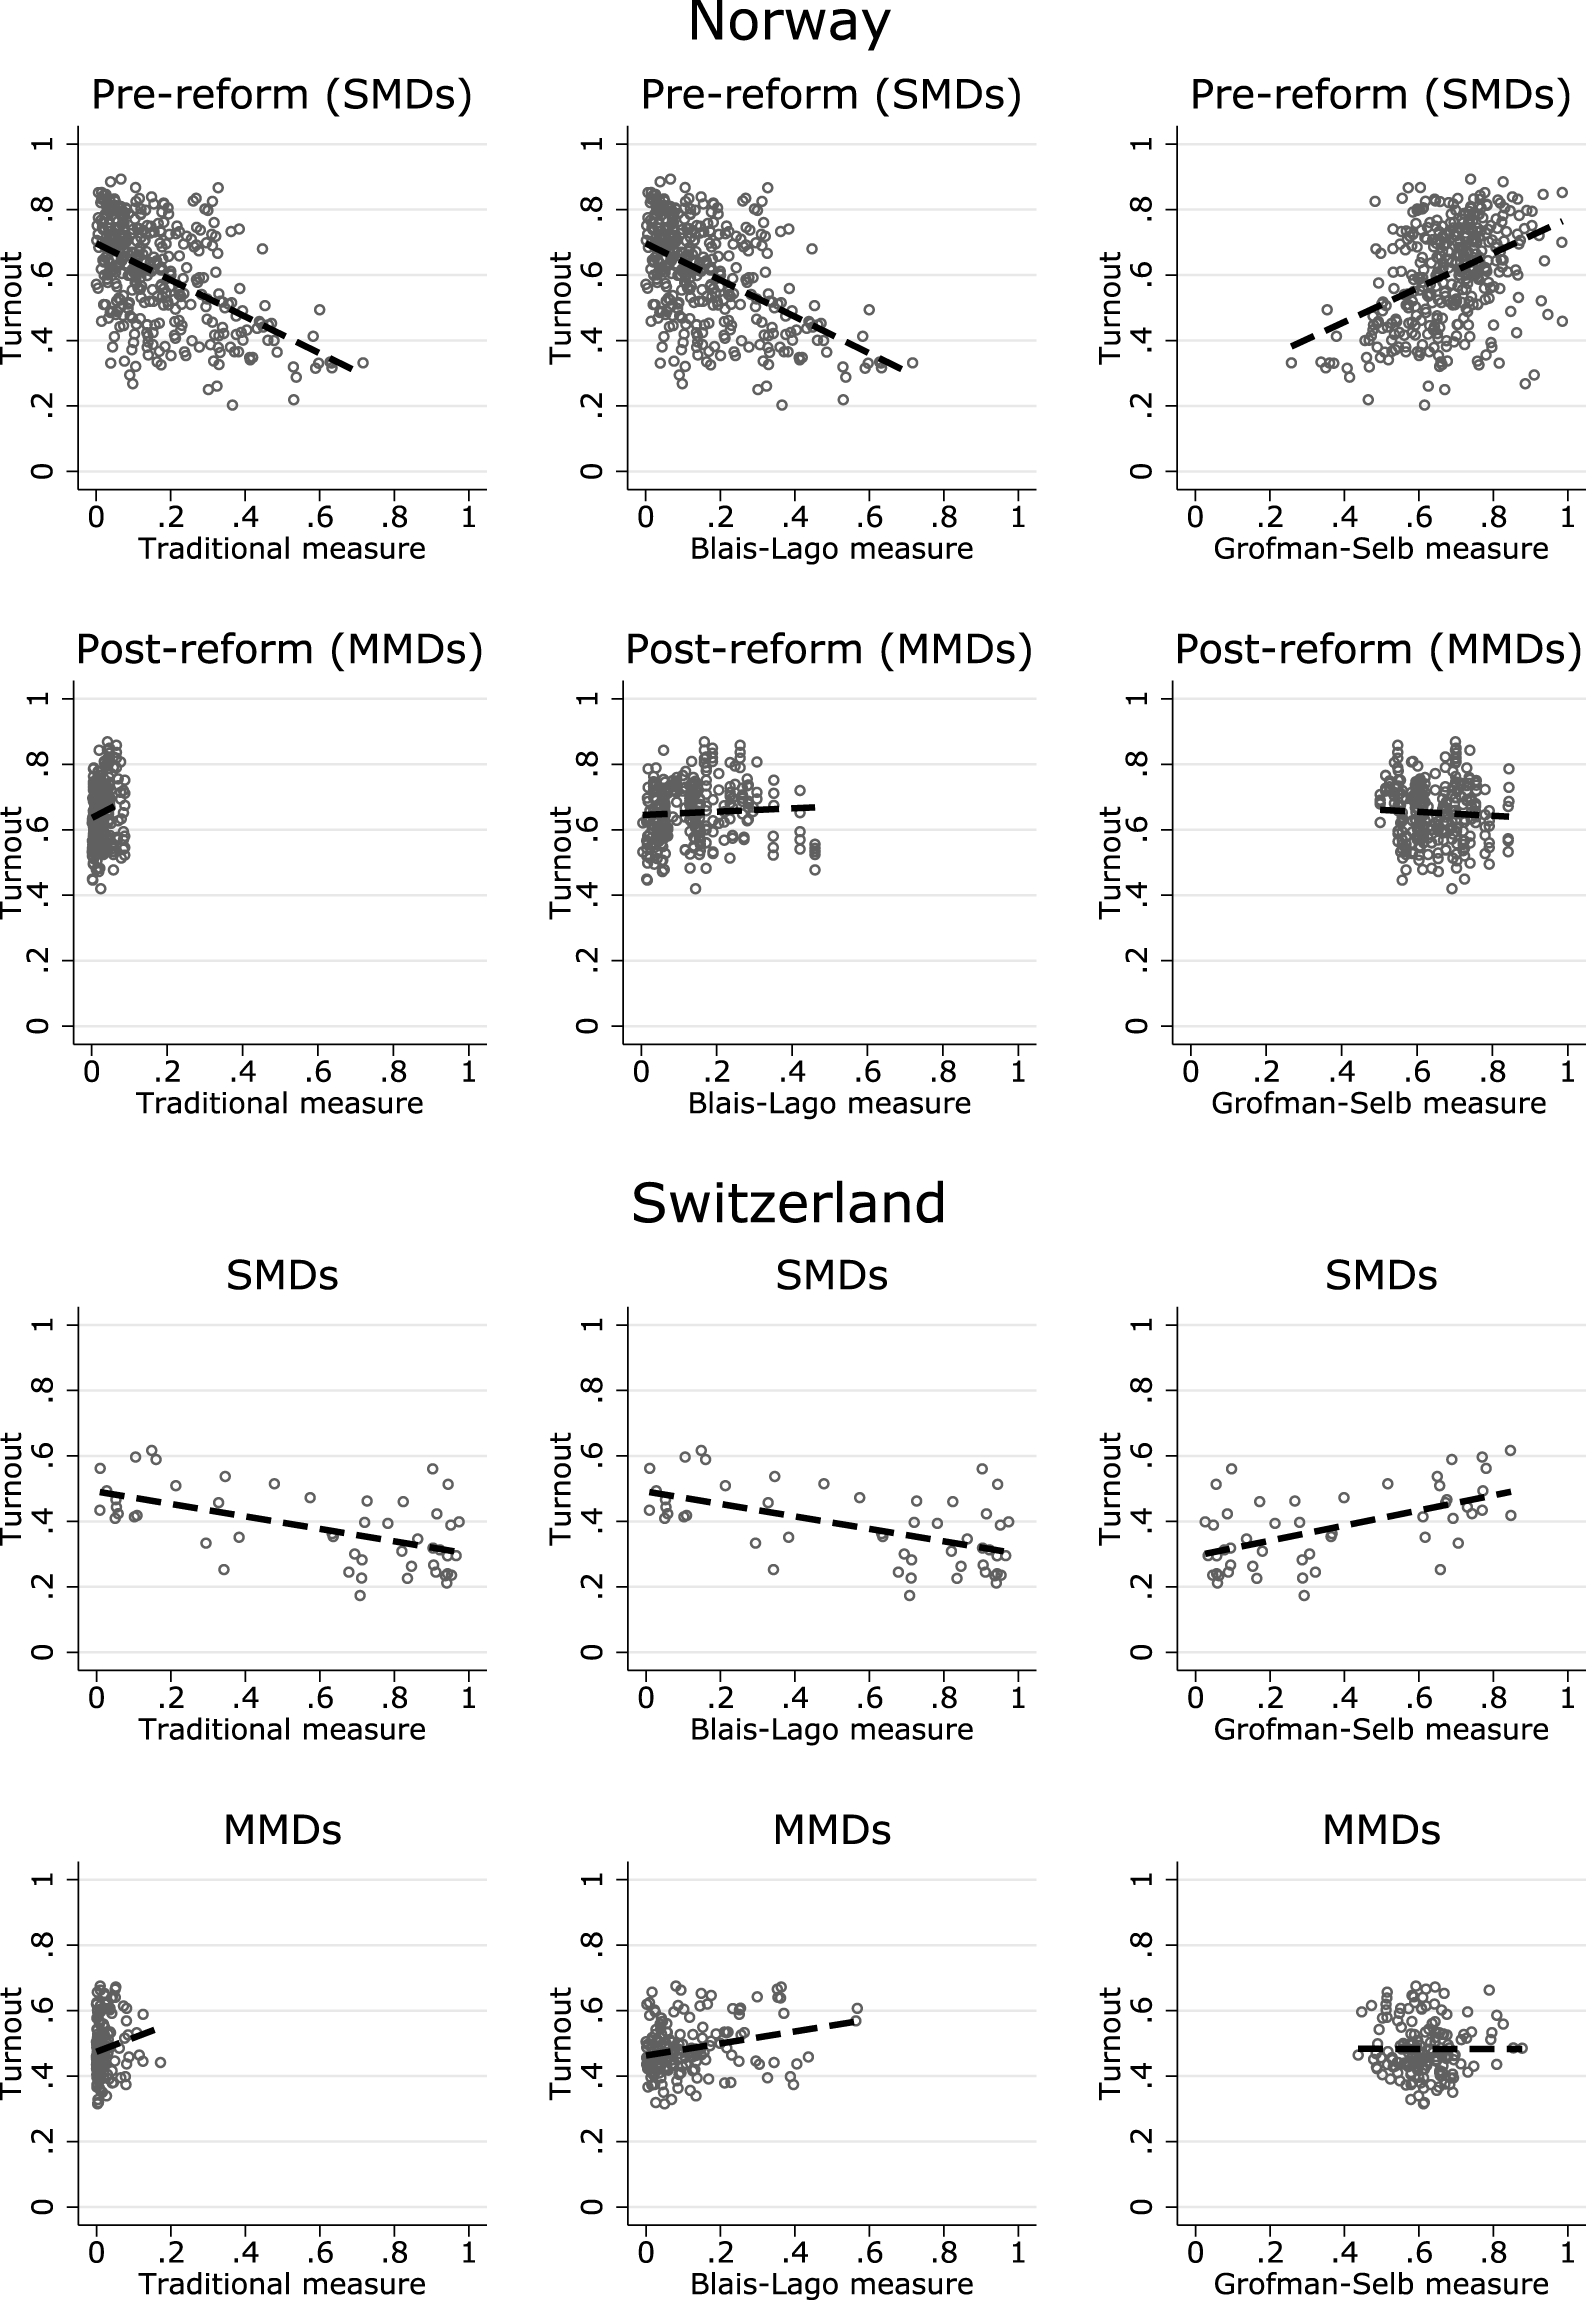
This is not what the evidence shows, however. Grofman and Selb (Reference Grofman and Selb2011, 101), examining Swiss and Spanish elections, report that competition boosts turnout in the Swiss SMDs but “there is essentially no relationship between [district-level] turnout and [district-level] competition” in either country’s MMDs. Blais and Lago (Reference Blais and Lago2009, Table 6), pooling data from Britain, Canada, Portugal and Spain, reach a similar conclusion. Variations in district-level competition significantly affect turnout in the low-magnitude districts in their data, but this effect shrinks (and eventually disappears) as magnitude increases.Footnote 25
Alternative measures of competition and their relationship with voter turnout. Note: The figure relates voter turnout to three alternative measures of competition. In the left-hand panels the horizontal axes display the minimum vote-share gain that would earn an additional seat for a single party. In the middle panels the horizontal axes display Blais and Lago’s (Reference Blais and Lago2009) measure. In the right-hand panels the horizontal axes display Grofman–Selb’s (Reference Grofman and Selb2009) index of competition. In the top panel, we use the balanced panel data set of Cox, Fiva, and Smith (Reference Cox, Fiva and Smith2016) covering Norway, 1909–1927. Two-round elections were used from 1909 to 1918 (prereform); PR from 1921 to 1927 (postreform). In the prereform period we construct the distance measures using the electoral results from the first round. Voter turnout is measured in the final round, as in Cox, Fiva, and Smith (Reference Cox, Fiva and Smith2016). In the bottom panel, we use data from Switzerland, 1971–2003 (Grofman and Selb Reference Grofman and Selb2011). We exclude one district where voting is compulsory (Schaffhausen).

We would highlight three parts of the findings just reviewed. First, the competition-on-turnout effect is significant in low-magnitude districts. Second, the effect declines with district magnitude. Third, the effect eventually loses statistical significance. We illustrate these findings in Figure 6, which again uses data from Norway (top panel) and Switzerland (bottom panel) to relate turnout to competitiveness with the traditional measure (left-hand panels), the Blais–Lago measure (middle panels), and the Grofman–Selb measure (right-hand panels).Footnote 26
We view these patterns as challenging the construct validity of the Blais–Lago and Grofman–Selb measures. If their measures are valid, and they vary just as much in MMDs as in SMDs, then they should produce effects that are just as large in MMDs as in SMDs. While neither set of authors explicitly raise and rebut this challenge, Blais and Lago (Reference Blais and Lago2009, 99) do offer an explanation for the declining effect of competition on turnout: “All else equal, the larger the district magnitude the harder it is to know how many votes can make a difference. As a consequence voters in large districts should be less inclined to pay attention to the competitiveness of the race.”Footnote 27
While this may be true as regards voters, what about the candidates, parties and their in-house pollsters? Suppose we have observations on many SMDs, some of which are “very competitive” and some of which are “uncompetitive.” We can use these observations to calibrate what “very competitive” and “uncompetitive” means, in terms of the Blais–Lago (or Grofman–Selb) distance metric. Now suppose that a particular 10-seat district varies substantially over time in competitiveness, as measured by Blais–Lago (or Grofman–Selb). The local elites should notice, even if the local voters do not, that their district is “very competitive” in one year and “uncompetitive” in another. They should more intensively mobilize their supporters in the first year than in the second, and turnout should be higher in the first year than the second. Thus, one cannot explain the disappearance of the competition-on-turnout effect simply by referring to the voters’ lack of information about how close the contest is in higher-magnitude districts—because local elites should have good information and the resources to act on that information.
We offer a different explanation for the disappearance of the competition-on-turnout effect. As noted in the previous section, the distribution of vote-share distances changes dramatically as district magnitude increases: both the mean and variance shrink toward zero. Thus, there are two reasons to expect that the competition-on-turnout effect should disappear. The first is substantive: in high-magnitude districts, competitiveness will have a high mean and low variance, so elites’ mobilizational effort will also have a high mean and low variance. The second reason is statistical: attenuation bias. If the range over which an independent variable is observed shrinks toward zero, the estimated impact of that variable on any dependent variable will also shrink toward zero (as long as there is some measurement error in the independent variable, which is certainly plausible in the present context).
All told, if one uses the traditional measure of distance denominated in vote shares, one has a consistent story to tell. First, in low-magnitude districts, large variations in vote-share distances can occur. Local elites respond by adjusting their mobilizational efforts accordingly—getting out the vote more when the race is close, less when the eventual outcome is foregone. Second, vote-share distances shrink on average and become less variable as district magnitude increases. Thus, the competition-on-turnout effect shrinks with district magnitude—either because local elites react less to variations in competition around a higher mean or because of attenuation bias. Third, in high-magnitude districts, local elites exert such consistently high mobilizational effort that there is little detectable variation in turnout over time within a given district.
6 Conclusion
Despite its ubiquity across studies of elections and democracy, the concept of competitiveness in elections has been inconsistently measured, particularly in cross-national studies that include data from multiple electoral systems. Several studies have recently proposed general ways to measure the closeness of district-level elections across systems with varying magnitude and allocation formulas (Blais and Lago Reference Blais and Lago2009; Grofman and Selb Reference Grofman and Selb2009; Folke Reference Folke2014). The goal of this research pursuit is to provide a measure that can accurately compare the level of competition in districts of different magnitude (often operating under different electoral rules).
Based on their new measures, the Blais–Lago and Grofman–Selb teams have presented puzzling challenges to conventional wisdom in electoral studies—in particular, the claim that competitiveness will be higher on average and less variable in MMDs operating under PR rules than in SMDs operating under majoritarian rules (Blais and Lago Reference Blais and Lago2009; Grofman and Selb Reference Grofman and Selb2011).
In this study, we have first pointed out that all extant measures of district-level competitiveness, both traditional and new, implicitly rely on assumptions about how parties’ mobilizational effort translates into votes. At a conceptual level, we have argued that the competitiveness of a district election relates to the marginal benefit of parties’ efforts to mobilize voters, which depends on how quickly those efforts translate into votes, how quickly votes translate into seat(s), and how valuable the ultimate seat allocation outcome will be to the parties exerting the effort. When the MBE is higher, parties competing in the election have greater incentive to mobilize voters. This plausible assumption, as well as the empirical evidence we have provided on parties’ mobilization strategies across districts of varying magnitude, supports a measure of competitiveness denominated in vote shares (such as the traditional measure, Folke’s measure, or a nonnormalized version of the Grofman–Selb measure) rather than one denominated in raw votes, or vote shares per seat (such as the main measures proposed by Blais–Lago and Grofman–Selb).
We have validated our theoretically preferred measure, while impugning those based on vote shares per seat, by considering a construct validity test. In particular, if a particular measure of competitiveness reflects how elite actors view the electoral lay of the land, then that measure should be able to predict elite responses. Elites should concentrate their mobilizational effort in more competitive districts, with the result that such districts exhibit higher turnout. Our empirical results from Norway and Switzerland, two separate country cases with complementary advantages in the within-country variation in electoral institutions, show that the Blais–Lago and Grofman–Selb measures fail this sort of validity test, while the family of measures we advocate passes them.
Supplementary material
For supplementary material accompanying this paper, please visit https://doi.org/10.1017/pan.2019.28.