Studies of Chinese politics have become increasingly important in the twenty-first century. Well-trained scholars can identify their own perspective of the field, which publications are essential, which topics and debates are cutting edge, and whom to approach for particular research issues. This traditional approach to engagement with the literature, however, may sacrifice broadness for depth. It is still unclear—especially to new students—what Chinese politics research truly is and which topics it covers, except that it is concerned with China.
Previous review papers on Chinese politics focus on specific topics, methods, and engagement with general theories of political science (Carlson et al. Reference Carlson, Gallagher, Lieberthal and Manion2010; Chang and Hsu Reference Chang, Hsu, Hsu, Tsai and Chang2021; Chen Reference Chen2016; Gilley Reference Gilley2011; Gries Reference Gries2008; Lorentzen Reference Lorentzen2017; O’Brien Reference O’Brien2011, Reference O’Brien2018; Reny Reference Reny2011; Tsai Reference Tsai2017; Zhang Reference Zhang2017). However, few papers provide a panoramic view of which topics China scholars study most often and how their research interests change over time. This current study proposes using the bibliometric-analysis method to explore these questions. Bibliometrics has been used widely as an effective tool for evaluating scientific literature in a research field at a macro level and from a quantitative perspective (Fu, Wang, and Ho Reference Fu, Wang and Ho2013; Narin, Pinski, and Gee Reference Narin, Pinski and Gee1976; Vega-Arce et al. Reference Vega-Arce, Salas, Núñez-Ulloa, Pinto-Cortez, Fernandez and Ho2019).
By mining publication data on journal articles, we identified the general trends and popular topics of Chinese politics research from the first two decades of the twenty-first century. Particularly, we found that scholars from Mainland China shaped the landscape of the field. Publications in this field by those scholars were rare in 2001. By 2020, they published more than one third of all articles in this field and received the most total citations. Meanwhile, they slowly shifted the focus of the field from international relations (IR) to political economy. However, their publications still receive less acknowledgment (i.e., measured by standardized citations) than those from top institutes outside of Mainland China, especially those from the United States.
Particularly, we found that scholars from Mainland China shaped the landscape of the field. Publications in this field by scholars from Mainland China were rare in 2001. By 2020, they published more than one third of all articles in this field and received the most total citations.
Compared to conventional review papers, this article makes several contributions. Rather than focusing on one topic or theoretical clue, it treats the field of Chinese politics as an entity and compares how different topics arise and fade. The article depicts the field from a more comprehensive perspective and provides a general overview for new students. It also helps scholars to identify the ongoing popular research topics and to explore new research directions. By taking into account the citation data, it provides evidence on the long-debated issue: that is, how Chinese politics influences social science in general. We propose that bibliometric methods should be used more frequently in the studies of political science as well as in the training of new generations of political scientists.
DESCRIPTION OF THE DATA
This section describes how we collected the sample and the indicators that we used to evaluate it.
Search Strategy
This article, which focuses on the field of Chinese politics, targets journals in political science and IR. However, many articles on Chinese politics also are published by journals in area studies; therefore, we included related articles within that field. Focusing on these three categories was an efficient decision. Although studies of Chinese politics also appear in other categories (e.g., economics, psychology, and communication), we excluded them because it would require more complex searching strategies to include them and also would have limited marginal benefits with the potential for more noise.
The documents in our sample were based on the Social Science Citation Index (SSCI) database of Web of Science (WOS) from Clarivate Analytics (updated on March 11, 2021) (Shao and Fu Reference Shao and Fu2022). The strategies were based on cross-searching in the following categories:
-
• For political science (polisci) and IR: “China” or “Chinese” in the topic field (including title, abstract, author keywords, and KeyWords Plus)
-
• For area studies: “China,” “Chinese,” “politics,” “political,” “regime,” “govern*,” “state,” “democra,” “autocra,” “authori,” “dictator,” “ccp,” “party,” or “communist party” in the topic field
As an exploratory study, we chose the time range from 2001 to 2020 to observe Chinese politics research in the early twenty-first century. We collected a total of 11,285 Chinese politics-related articles based on the SSCI from 304 journals and authored by approximately 10,000 contributors from more than 3,400 institutes. We excluded book reviews.
Indicators
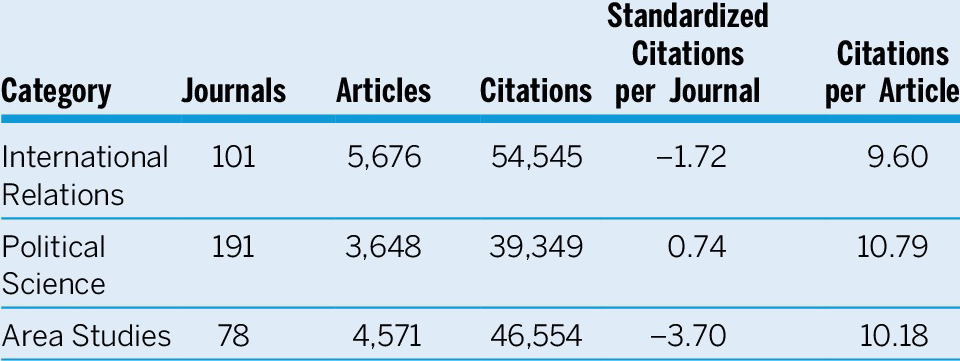
Two main indicators ranked the articles. For each article, we used its total citation number as a measurement of its influence in academia. We collected these statistical data from the WOS database on March 11, 2021. Because older publications typically have more citations, we added “standardized citation” to control the effects of the publication year. The standardized citation measured an article’s citation relative to the average citation (from –0.75 to 19.99) of all articles published in the same year (see the online appendix for the formula). A negative sign indicated that an article’s number of citations was below the average. We found that the most-cited article had 649 citations and 19.99 standardized citations. Table 1 lists the descriptive statistics of journals, articles, and citations across the subject areas.
Journals and Articles by Web of Science Categories

Note: Journals may belong to multiple categories.
TEMPORAL CHANGES IN PUBLICATIONS
In the dataset, Chinese institutes had minimal publications in 2001, whereas in 2020, they accounted for the largest proportion: approximately 35% of all publications. In comparison, US institutes accounted for approximately 49% of all publications in 2001 but less than 20% in 2020. Chinese institutes also had a similar leading proportion of total citations, but US institutes performed better in standardized-citation indicators (see the online appendix).
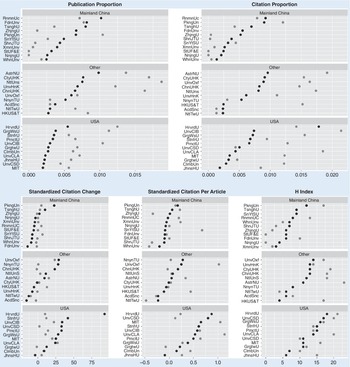
We also compared the performance of top institutes in Mainland China, in the United States, and in the other areas shown in figure 1. Nine of the top 10 institutes in Mainland China increased their proportion of publications in the second decade (2011–2020). However, all top 10 US institutes decreased in the proportion of publications. In other areas, only two institutes in the top 10 increased their proportion. The change in the proportion of citations reflects a similar pattern, which suggests that, since 2011, top Chinese institutes have gradually taken over Chinese politics research. The online appendix explains that such a significant number of publications may be a combined result of increasing research investment, the incentives to build globally reputable universities, and the movement toward enhancing soft power.
Change Between Two Decades in Top 10 Institutes, Three Regions
The gray dot represents the average of the indicators of articles published from 2001 to 2010; the black dot represents those published from 2011 to 2020. Institutes are ranked by performance in 2011–2020 in their own region.

However, seven of 10 institutes in Mainland China reduced their numbers of standardized citations in the second decade compared to three of 10 in the United States and six of 10 in other countries. This indicates that after controlling for the effects of publication year, the top institutes in Mainland China were still lagging in the number of citations compared to their counterparts outside of China. Figure 1 shows that US institutes performed better in citations. Regression results reveal that authors from an institute in Mainland China did not affect the number of an article’s citations. For comparison, authors from US institutes had 4.93 more citations than the baseline; the size of this effect was 29.2% in proportion to the constant. Although authors from institutes in Mainland China have published more papers in the recent decade, their influence in Chinese politics research remains limited compared to the United States and other countries.
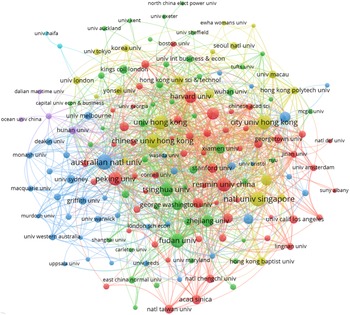
An important role of Chinese institutes is that they enable more collaboration among institutes to conduct research on Chinese politics. Figure 2 maps the collaborative relationship among universities. Many Mainland China institutes are in the center of the collaboration network. The most frequently collaborating institutional pair is the Chinese University of Hong Kong with the City University of Hong Kong, Renmin University, and the University of California, Los Angeles (UCLA), with 13 articles. The collaboration strengths of Academia Sinica–National Taiwan University, City University of Hong Kong–Sun Yat-Sen University, and City University of Hong Kong–Hong Kong Baptist University also were prominent, with no less than 10 collaborative publications. UCLA, Stanford University, and Harvard University, Australian National University, Oxford University, and National University of Singapore were the preferred institutional collaborators of Chinese institutions. Regression analysis shows that international collaboration is associated with more citations. Chinese authors’ collaborations with foreign authors had 1.86 more citations than the baseline, but there was no difference on standardized citations. Without collaboration, the number of citations was negatively associated with Chinese authors. For comparison, international collaboration is associated with fewer citations for US authors.
Regression analysis shows that international collaboration is associated with more citations. Chinese authors’ collaboration with foreign authors has 1.86 more citations than the baseline, but there was no difference on standardized citations. Without collaboration, the number of citations is negatively associated with Chinese authors. For comparison, international collaboration is associated with fewer citations for US authors.
Collaboration Network Between Institutes on Chinese Politics Research, 2001–2020
Each node in the figure represents an institution; the size of the nodes represents the number of articles. Lines between nodes indicate a connection between two institutions; thicker lines indicate a higher number of collaborative articles.

TOPICS OF CHINESE POLITICS RESEARCH, 2001–2020
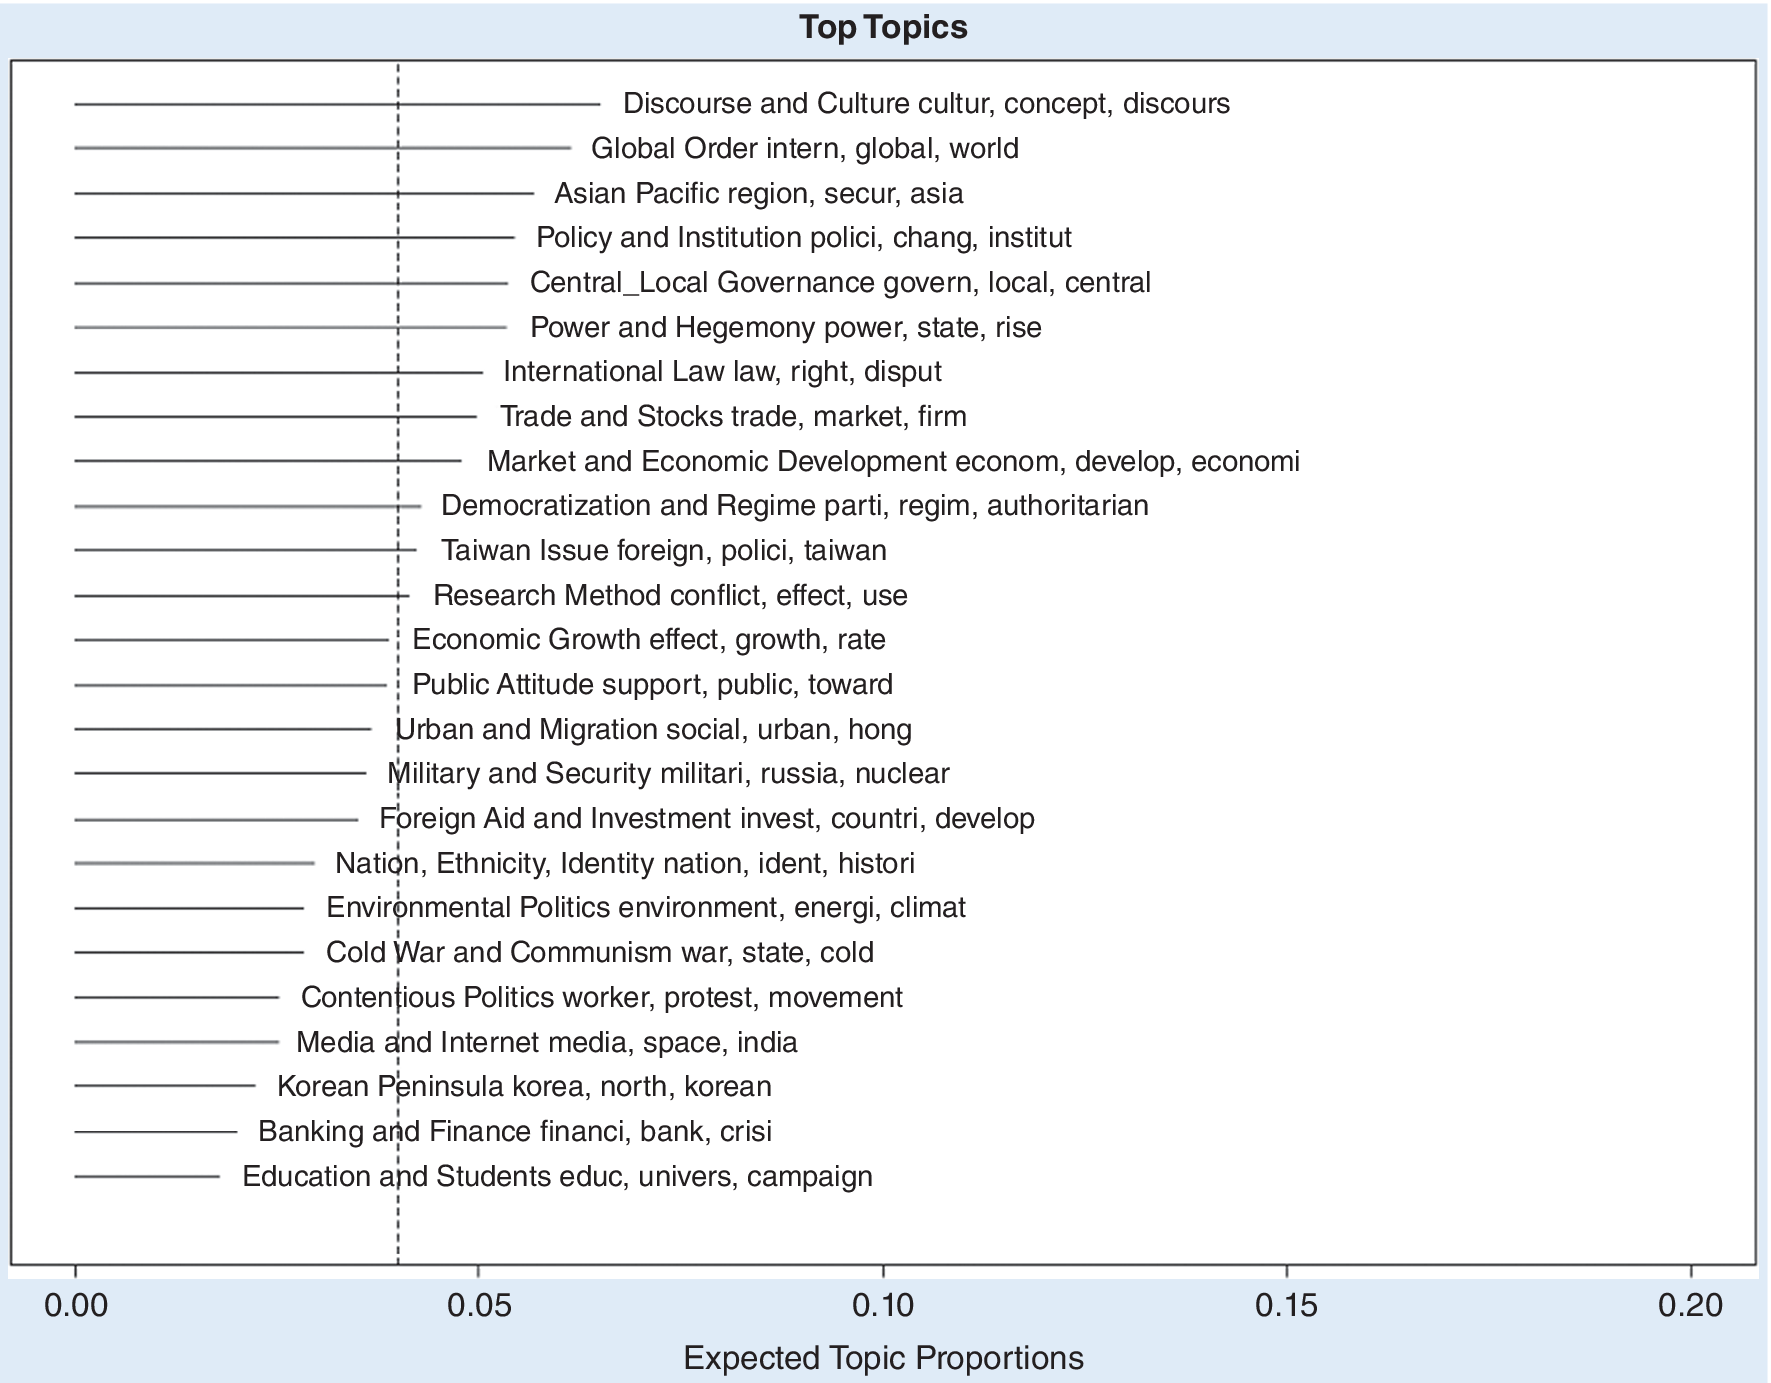
We used a structural topic model (STM) to analyze the abstracts of the given articles (Roberts, Stewart, and Tingley Reference Roberts, Stewart and Tingley2014). After parsing the corpus, we obtained the actual sample of the STM with 10,215 abstracts. After evaluation, 25 topics were the most appropriate for analysis (figure 3).
Topic Proportion of Chinese Politics Research
The uppercased words for each row are the topic labels. The lowercased words are the keywords. The vertical dot line represents the 4% average topic proportion.

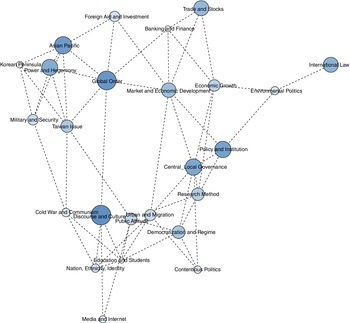
Figure 4 shows which topics were more likely to appear together in one article. The size of the nodes represents the proportion of the topics. There are three general clusters of topics. We labeled the first cluster as IR (top left), including Asia Pacific and global order. The second cluster was labeled domestic politics (bottom), including public attitude and contentious politics. The third cluster was labeled political economy (top right), including environmental politics, economic growth, and trade and stocks. Some topics overlap two clusters. For example, Cold War and communism are correlated with both IR and domestic politics topics. Central/local governance is correlated with topics of domestic politics as well as political economy. It is interesting that research method is correlated mainly with domestic politics topics, which suggests that researchers in domestic politics prefer to discuss their methods in their abstracts. The topic of international law seems to be correlated only with environmental politics but no other IR topics. The figure shows that the IR studies from the security perspective (e.g., power and hegemony and Taiwan issues) seldom included issues such as international rules, norms, and agreements. International law is discussed only in the context of international political economy and international environmental governance.
Correlation Between Topics
Each circle represents a topic, and the dashed line represents that the correlation between two topics is significant. The darkness and size of the circles represent the topic’s estimated proportion within the data.

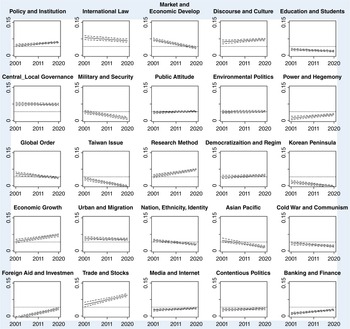
Figure 5 shows the estimated proportion of topic changes during the 20-year period. Only two IR topics had increasing popularity: foreign aid and investment, and power and hegemony. The remaining IR topics declined during the two decades. This result suggests that the focus of China’s IR studies has shifted to the power of China in the international community. The increasing interest in foreign aid and investment also is consistent with China’s emerging international-expansion plans, such as the Belt and Road Initiative (Liu and Shao Reference Liu and Shao2022). In comparison, the IR topics with geopolitical specifications (e.g., Korean issues and Taiwan issues) declined. Domestic politics topics remained relatively stable. Scholars demonstrated greater interest in policy and institutions but a slight decrease in central/local governance. However, these two topics were still among the most popular in the domestic politics cluster. The “behavioralist” topics—public attitudes, media and internet, and contentious politics—received increasing attention, whereas there were fewer articles on nation, ethnicity, and identity. In addition, scholars showed a greater interest in discourse and culture, which included discussions on scholarly thoughts and reflection that criticizes positivist methodology. However, research methods also received increasing interest, suggesting that more empirical tools had been developed (Carlson et al. Reference Carlson, Gallagher, Lieberthal and Manion2010). Regarding political economy topics, market and economic development—which focuses on market reforms and private sectors—declined in popularity. The proportion of environmental politics remained stable. The remaining political economy topics increased in proportion during the 20-year period.
Temporal Change in the Topic Proportion
The horizontal dotted line is the 4% average proportion of 25 topics.

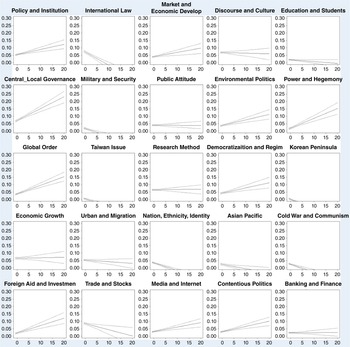
Figure 6 depicts the relationship between topic proportion (y-axis) and standardized citations (x-axis). The positive association reveals that the higher proportion of the given topics in an article attracted more citations. Among the IR topics, power and hegemony, global order, and foreign aid and investment were positively associated with standardized citations, whereas the other IR topics were negatively associated. For political economy topics, those attracting more citations were environmental politics, and market and economic development. Multiple topics in the domestic politics cluster attracted more citations: policy and institution, central/local governance, democratization and regime, media and internet, and contentious politics. Nation, ethnicity, and identity attracted fewer citations. These results suggest that, in general, social scientists find China’s domestic politics more useful to cite compared to the other two clusters.
Topic Proportion (y-Axis) and Standardized Citations (x-Axis)

COMPARISON OF TOPICS BETWEEN SCHOLARS FROM MAINLAND CHINA AND OTHER COUNTRIES
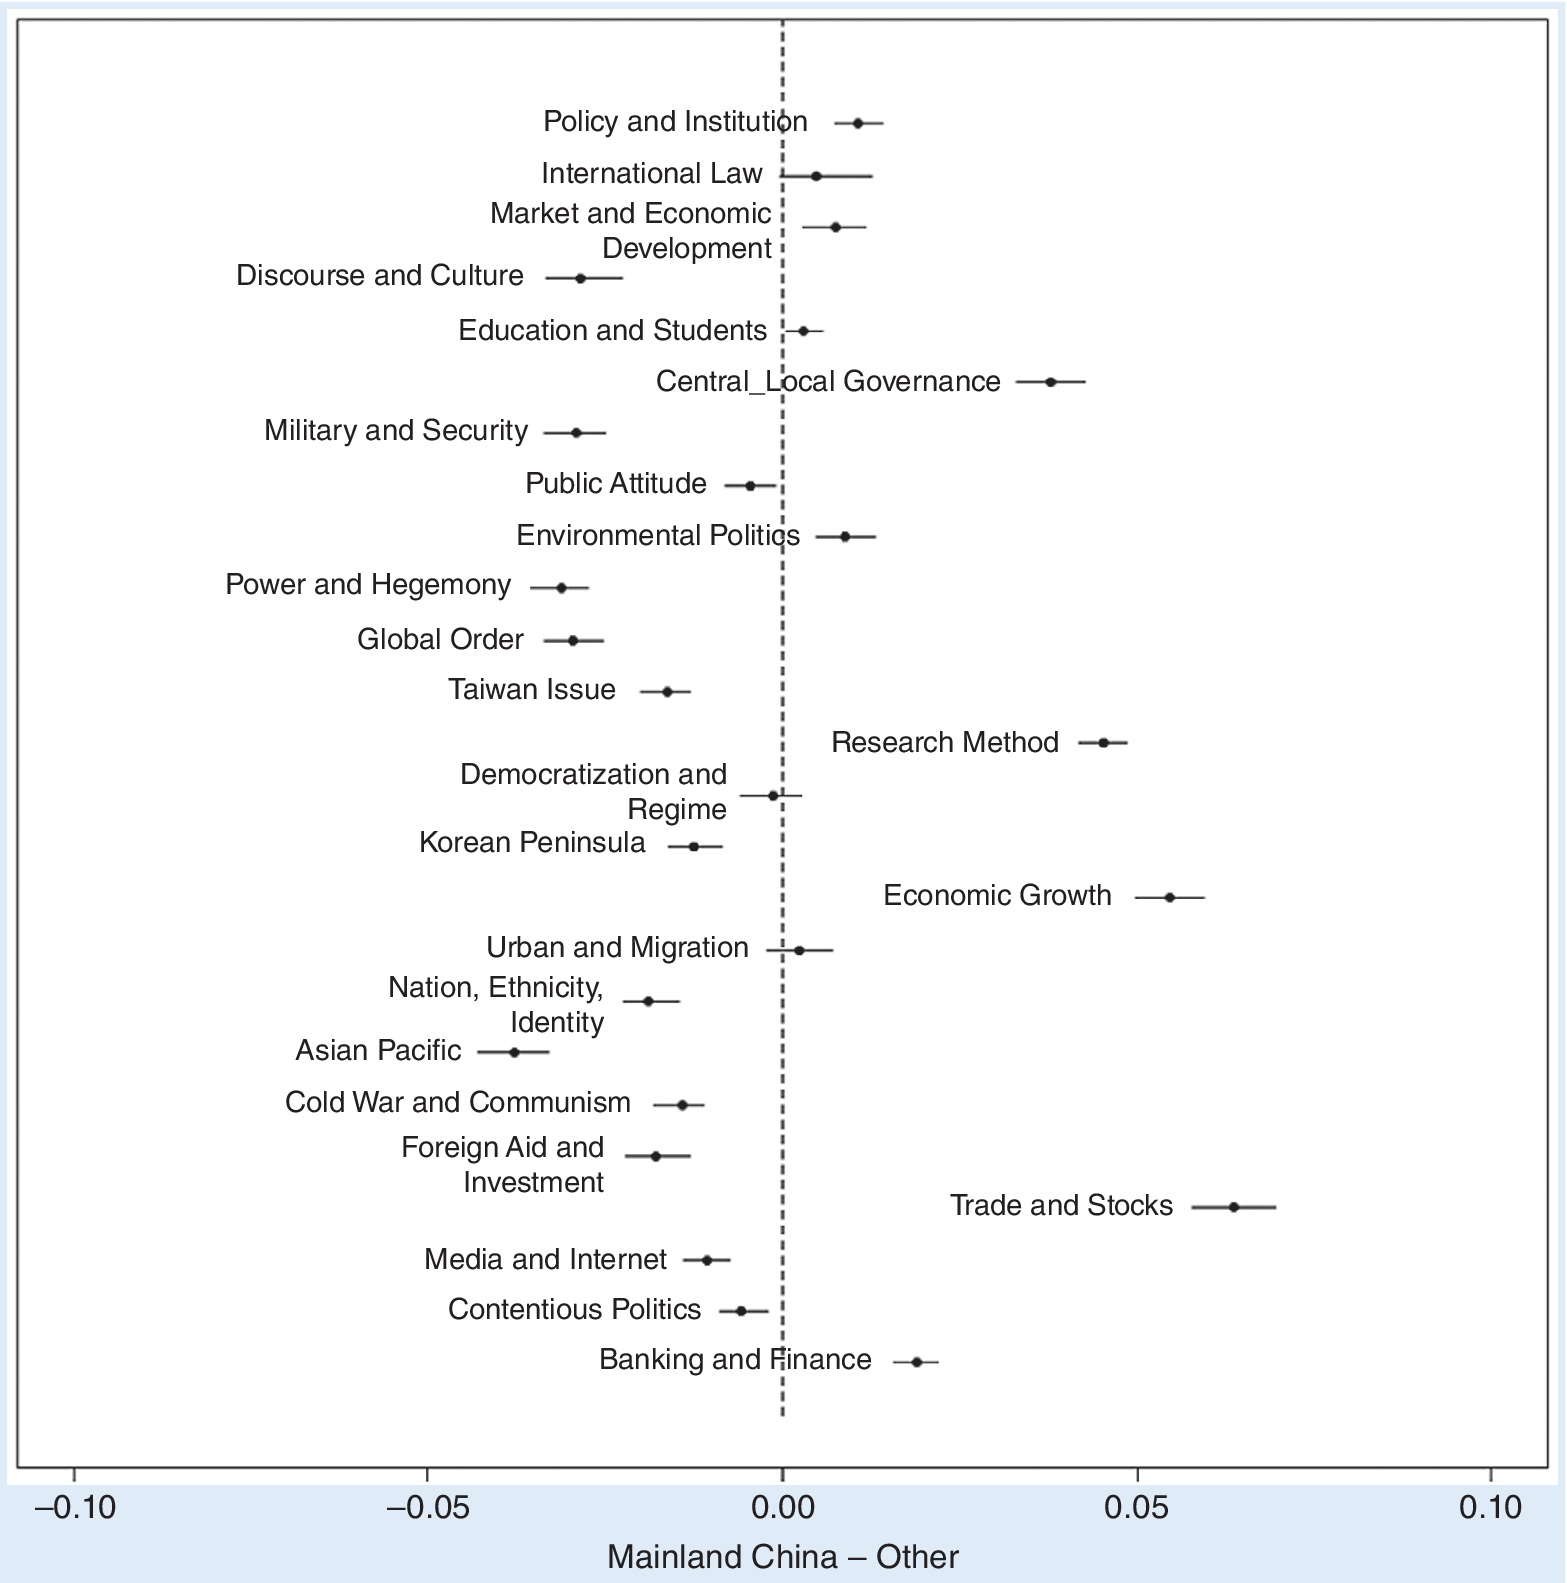
We further studied the research interests of scholars from Mainland China. Figure 7 depicts the comparison of topic proportion across authors from institutes in Mainland China and those from other countries (CI = 95%). Scholars from Mainland China had higher levels of interest in almost all topics in the political economy cluster. In the domestic politics cluster, scholars from Mainland China made more contributions to policy and institution, central/local governance, and research method. They also refined better methodological tools for Chinese politics research and had less interest in topics in the IR cluster. Chinese scholars did not avoid the “sensitive” topic of democratization and regime, which mainly includes cadre promotion, leadership succession, and other forms of elite politics. By comparison, Chinese scholars are less interested in behavioralist topics that focus on Chinese citizens and society (e.g., media and politics, and public attitude).
Topic Proportion Across Authors from Mainland China and Other Countries

The online appendix compares the temporal change in topic proportion between Chinese scholars and those from other countries. Chinese scholars demonstrated not only lower but also declining interest in topics in the IR cluster. For geopolitics-specific issues such as the Korean Peninsula, Taiwan issue, and Asia Pacific, these scholars almost ceased publishing relevant content in approximately 2015. The only exception was foreign aid and investment, which increased at a slower pace compared to the publications of other scholars.
In the domestic politics cluster, Chinese scholars maintained stable interests in most topics. For instance, they maintained a high level of interest (approximately 10%) in central/local governance when other scholars’ publications declined. Nation, ethnicity, and identity were topics in which scholars from both Mainland China and other countries lost interest. Scholars from Mainland China showed significant interest in research methods compared to other scholars.
In the political economy cluster, publications by scholars from Mainland China increased over time. They contributed to the general increase in the proportion of political economy topics, given that other scholars’ respective interests remained stable. The two exceptions were international law, and market and economic development, in which the interests of scholars from Mainland China declined.
Two questions merit further discussion. First, it seems contradictory that Chinese scholars published more often in IR journals but they seemed to have no interest in IR topics. What did they publish in these journals? The online appendix shows that their primary topics in IR journals were in the political economy and domestic politics clusters. Second, when scholars from Mainland China increased the number of publications on most political economy projects, why did their interest in market and economic development decline? We found that they published more papers on the macro- and micro-levels of political economy and that their interest in the meso-level involving institutions, industries, sectors, capitals, and markets declined.
CONCLUDING REMARKS
By analyzing the bibliometrics data, this study found three trends. First, Chinese scholars had an increasing influence on the topic distribution and the total number of citations of Chinese politics research, whereas their influence on social science remained limited: their levels of standardized citations were still lower than those of their US counterparts. Second, our analysis did not reflect that scholars from other countries changed their interests based on the surge in publications from Mainland China. Nevertheless, increasing publications and citations generate impacts. The role of scholars from Mainland China in the field has grown in significance in the past 20 years.
The findings discussed in this article can help scholars in several ways. They reveal that the field of Chinese politics has moved from an IR focus to a political economy focus. Studies on Chinese politics indicate an increasing interest in research methods. Our findings also reveal that China’s domestic politics topics have made a greater contribution (i.e., more citations) to the social sciences. Moreover, the field is moving in the direction that Tsai (Reference Tsai2017) suggested. Scholars shifted their attention from institutions, governance, and regimes to behavioralist topics such as media and contentious politics at a moderate pace (see figure 5). Although we were unable to determine what proportion of these citations were from political scientists, our findings suggest that social scientists in general show considerable interest in topics on China’s domestic institutions and political behaviors.
…the field of Chinese politics has moved from an IR focus to a political economy focus. Studies on Chinese politics indicate an increasing interest in research methods. Our findings also reveal that China’s domestic politics topics have made a greater contribution (i.e., more citations) to the social sciences.
Third, several questions emerge about scholars’ decisions for future research directions. For example, the proportion of Taiwan issues decreased dramatically throughout 2001–2020 whereas the cross–Taiwan Strait relations deteriorated, especially after 2016. It is worth asking why scholars—including authors and editors—changed their theoretical and methodological preferences on this topic. In addition, it is necessary to explore why the popularity of market and economic development decreased during the 20-year period. Is it because market reform is a less important question given China’s deepening marketization? For the international law topic, why was it correlated only with the political economy cluster and not the IR cluster? Should IR scholars combine the frameworks of international law with their research on global hegemony and Sino–US relations? Why does the IR cluster have little correlation with the research method topic?
This article is a comprehensive view of research on Chinese politics that serves as a supplement rather than a substitution for the traditional methods of literature review. Our analysis did not include academic books, which are a main source of Chinese political studies. One future direction is to use references from the current dataset to locate important literature, including academic books. Nevertheless, we have not yet found theoretical reasons that the research topics covered by academic books are systematically different from those covered by journal articles.
Our findings also have implications for the citation-bias issue in academia, which usually is reflected by the citation and publication gap for female scholars, non-native English-speaking countries, and the Global South (Brown et al. Reference Brown, Horiuchi, Htun and Samuels2020; Gomez, Herman, and Parigi Reference Gomez, Herman and Parigi2022). This article shows that scholars from Mainland China narrowed this gap with increasing investment in research and publications. In addition, international collaboration can increase citations for “disadvantaged” groups of scholars. However, this gap still exists in the measurement of standardized citations, and it remains an open question whether Mainland China’s continued international engagement ultimately will fill the gap.
This article also makes methodological contributions. First, it is an example of a rare attempt to use bibliometrics to study political science. Future studies may apply a similar method to a specific topic (e.g., state formation or democratization) to discuss on which research and empirical evidence these topics mainly build. A second potential direction is comparing the studies of country-specific politics to understand how academia has diverse interests across different yet comparable countries and how, in general, they describe, frame, and present their politics in academic journals. Third, cross-sectional publication data of country-specific politics may reveal how the major changes in a country’s politics impact scholars’ research interests and topics in the long term. Fourth, by analyzing this dataset, we can extract the most influential publications in the past 20 years as well as the most-cited works of these publications (see the online appendix for a demonstration). These data facilitate educators and new students of Chinese politics in quickly locating the most important literature of the field and finding the cutting-edge directions.
ACKNOWLEDGMENTS
This project was supported by the Zhejiang Province Science Grant (Soft Science No. 2021C35131) and the Fundamental Research Funds for the Central Universities. The authors thank the reviewers and editors. Rongbin Han, Chun-Chih Chang, Dongshu Liu, and Yuchen Liu provided insightful input to our manuscript. Jianing Deng, Xue Lei, and Kejia Miao provided excellent assistance. An earlier version was presented in PKU–FDU Governance Forum 2022. Any errors are our own.
DATA AVAILABILITY STATEMENT
Research documentation and data that support the findings of this study are openly available at the PS: Political Science & Politics Harvard Dataverse at https://doi.org/10.7910/DVN/VYYYRN.
SUPPLEMENTARY MATERIALS
To view supplementary material for this article, please visit http://doi.org/10.1017/S1049096522001147.
CONFLICTS OF INTEREST
The authors declare that there are no ethical issues or conflicts of interest in this research.