Introduction
Organic farming and in-field plant diversification can mitigate negative environmental effects associated with agricultural intensification by increasing arthropod species and functional richness and increasing related ecosystem services, such as predation and pollination, to agroecosystems (Norton et al., Reference Norton, Johnson, Joys, Stuart, Chamberlain, Feber, Firbank, Manley, Wolfe, Hart, Mathews, Macdonald and Fuller2009; Tuck et al., Reference Tuck, Winqvist, Mota, Ahnstrom, Turnbull and Bengtsson2014; Lichtenberg et al., Reference Lichtenberg, Kennedy, Kremen, Berendse, Bommarco, Bosque-p, Carvalheiro, Snyder, Williams, Winfree, Yann, Bryan and Tim2017). Organic farming on average increases species richness by 30% and the effect is more pronounced in intensively managed landscapes (Tuck et al., Reference Tuck, Winqvist, Mota, Ahnstrom, Turnbull and Bengtsson2014). In the USA, farmers who want to convert to an organic farming system are required to undergo a 3-yr transition period in which they forego the use of non-allowed materials or practices before their land and crops can be certified as organic (USDA NOP, 2019). Conservation and improvement of soil quality is a stated requirement in the USDA organic rule (USDA NOP, 2019) and is a philosophical foundation of organic production (Heckman, Reference Heckman2006). Transitioning and organic farmers report that weed and insect pests are among their top challenges and largely rely on cultural practices, conservation biological control and intercropping to manage pests (Zehnder et al., Reference Zehnder, Gurr, Stefan, Wade, Wratten and Wyss2007). The objective of this study was to determine how cultural practices for weed management and building soil quality in the transition to organic production of cereals and forage crops affect the assemblage of carabid beetles (Coleoptera: Carabidae), an important group of insects to conserve for biological control of ground-dwelling arthropod pests and weed seeds (Kromp, Reference Kromp1999; Lundgren et al., Reference Lundgren, Shaw, Zaborski and Eastman2006; Hanson et al., Reference Hanson, Palmu, Birkhofer and Smith2016).
Carabids are a ubiquitous and abundant group of beetles in terrestrial systems, including agricultural fields; however, the assemblage of carabid species and trophic groups, and the functional response vary by habitat type (Larsen et al., Reference Larsen, Work and Purrington2003; Aviron et al., Reference Aviron, Burel, Baudry and Schermann2005; Winqvist et al., Reference Winqvist, Bengtsson, Berendse, Clement, Fischer, Flohre, Weisser and Bommarco2014). In comparison to wooded habitat, carabid assemblages associated with agricultural or herbaceous habitat tend to have a greater proportion of carabids that are herbivorous, smaller-sized and more mobile (Thiele, Reference Thiele1977; Aviron et al., Reference Aviron, Burel, Baudry and Schermann2005; Schirmel et al., Reference Schirmel, Thiele, Entling and Buchholz2016). Carabid size is an important determinant of biological control function, with larger beetles, generally associated with wooded habitat (Blake et al., Reference Blake, Foster, Eyre and Luff1994), demonstrating lower prey handling times and higher consumption rates of prey (Rouabah et al., Reference Rouabah, Lasserre-Joulin, Amiaud and Plantureux2014; Ball et al., Reference Ball, Woodcock, Potts and Heard2015). Within agricultural habitats, carabid assemblages generally have higher species richness and abundance in organic compared to conventional cropping systems (Pfiffner and Niggli, Reference Pfiffner and Niggli1996; Döring and Kromp, Reference Döring and Kromp2003; Bengtsson et al., Reference Bengtsson, Ahnström and Weibull2005; Purtauf et al., Reference Purtauf, Dauber and Wolters2005; Clark et al., Reference Clark, Szlavecz, Cavigelli, Clark, Szlavecz and Cavigelli2006; Rondon et al., Reference Rondon, Pantoja, Hagerty, Donald and Entomologist2013). Organic systems favor carabid diversity through the elimination of synthetic pesticides, which enhances plant and arthropod food resources for predators and greater plant diversity and habitat complexity compared with conventional systems (Andow, Reference Andow1991; Veselý and Šarapatka, Reference Veselý and Šarapatka2008; Jabbour et al., Reference Jabbour, Pisani Gareau, Smith, Mullen and Barbercheck2015; Rivers et al., Reference Rivers, Mullen, Wallace and Barbercheck2017). Rusch et al. (Reference Rusch, Bommarco, Chiverton, Öberg, Wallin, Wiktelius and Ekbom2013) found that an increase in fallow period and organic farming practices and reduction in pesticide use over a 24-yr period increased the proportion of large and omnivorous carabid beetles in the agricultural landscape in Sweden.
Organic systems depend on a range of soil disturbance practices from deep tillage to surface cultivation to control weeds (Bond and Grundy, Reference Bond and Grundy2001) and incorporate animal and green manures. Soil disturbance practices can result in an overall decrease in soil faunal biomass and suppression of beneficial soil organisms, such as arthropod predators (Lundgren et al., Reference Lundgren, Shaw, Zaborski and Eastman2006; Tsiafouli et al., Reference Tsiafouli, Thébault, Sgardelis, de Ruiter, van der Putten, Birkhofer, Hemerik, de Vries, Bardgett, Brady, Bjornlund, Jørgensen, Christensen, Hertefeldt, Hotes, Gera Hol, Frouz, Liiri, Mortimer, Setalä, Tzanopoulos, Uteseny, Pizl, Stary, Wolters and Hedlund2015). Adult carabid beetles generally forage on the soil surface, oviposit in and on the soil, and develop through the egg, larval and pupal stages in the soil. Thus, all life stages of carabids can be affected by soil disturbances, either through direct mortality to individuals or change in abiotic and biotic habitat that can favor or deter particular species (Stinner and House, Reference Stinner and House1990; Kromp, Reference Kromp1999; Eyre et al., Reference Eyre, Luff and Leifert2013).
Reducing tillage frequency and intensity (area or volume of disturbed soil) generally has a positive effect on carabids (Lundgren et al., Reference Lundgren, Shaw, Zaborski and Eastman2006; Blubaugh and Kaplan, Reference Blubaugh and Kaplan2015; Jabbour et al., Reference Jabbour, Pisani Gareau, Smith, Mullen and Barbercheck2015; Hanson et al., Reference Hanson, Palmu, Birkhofer and Smith2016; Rivers et al., Reference Rivers, Mullen, Wallace and Barbercheck2017). However, some studies have not found a significant effect of tillage on the overall abundance of carabid beetles (Cárcamo, Reference Cárcamo1995; Clark et al., Reference Clark, Szlavecz, Cavigelli, Clark, Szlavecz and Cavigelli2006) and some carabid species are significantly more abundant in conventionally tilled fields (Ferguson and McPherson, Reference Ferguson and McPherson1985; Cárcamo, Reference Cárcamo1995; Belaoussoff et al., Reference Belaoussoff, Kevan, Murphy and Swanton2003; Menalled et al., Reference Menalled, Smith, Dauer and Fox2007). Variable responses of carabid species to tillage may be due to differences in beetle size, phenology relative to the depth and timing of soil disturbances or to environmental factors associated with tillage regime that affect the microclimate (Hatten et al., Reference Hatten, Bosque-Perez, Johnson-Maynard and Eigenbrode2007) and availability of food resources (Thorbek and Bilde, Reference Thorbek and Bilde2004; Birkhofer et al., Reference Birkhofer, Wise and Scheu2008). Thiele, in his seminal book (1977), surmises that the presence of carabid species in a particular habitat is largely driven by abiotic variables of the microclimate.
The crop environment can be a strong predictor of arthropod community structure (Hance et al., Reference Hance, Gregoirewibo and Lebrun1990; Booij and Noorlander, Reference Booij and Noorlander1992; Ellsbury et al., Reference Ellsbury, Powell, Forcella, Woodson, Clay and Riedell1998; Puech et al., Reference Puech, Baudry, Joannon and Poggi2014) as crop species and crop-specific cultivation practices affect the abiotic and biotic features of the microenvironment (Kromp, Reference Kromp1999; Holland and Luff, Reference Holland and Luff2000). For carabid beetles of agricultural fields that are primarily ground-dwelling, crop species and their density may affect carabid dispersal abilities and protection from predators. Thicker vegetation can slow the dispersal of ground beetles, while also providing greater cover from predators, while crops with a more open canopy can facilitate dispersal, but increase mortality rates from predators. The crop canopy also affects the microclimate—light quality, temperature, evapotranspiration, humidity and soil moisture. The crop environment with its associated flora and fauna also affects food resources for carabids.
Here, we report the results of a field experiment to assess the effects of a first-year cover crop and subsequent tillage regimen on carabid adult beetles during the 3-yr transition period in a cover crop–soybean–corn rotation initiated with different cover crop treatments. This research was conducted in the context of a larger project to assess the effects of cover crop and tillage treatments on soil (Lewis et al., Reference Lewis, Kaye, Jabbour and Barbercheck2011), general arthropod communities (Jabbour et al., Reference Jabbour, Pisani Gareau, Smith, Mullen and Barbercheck2015), entomopathogens (Jabbour and Barbercheck, Reference Jabbour and Barbercheck2009), weeds (Smith et al., Reference Smith, Jabbour, Hulting, Barbercheck and Mortensen2009), crop yields and economic performance (Smith et al., Reference Smith, Barbercheck, Mortensen, Hyde and Hulting2011). We hypothesized that carabid beetle abundance, community composition and guild (size class and trophic behavior) would vary according to initial cover crop and tillage treatments due to the level of disturbance and environmental characteristics resulting from practices associated with each treatment. The guild composition of communities can provide a functional understanding of the effects of management on trophic interactions in agroecosystems, and body-size distribution and feeding behavior appear to be valuable for predicting potential biological control by ground-dwelling predators (Ribera et al., Reference Ribera, Dolédec, Downie and Foster2001; Harvey et al., Reference Harvey, Van Der Putten, Turin, Wagenaar and Bezemer2008; Schmitz, Reference Schmitz2009; Crowder et al., Reference Crowder, Northfield, Strand and Snyder2010; Koivula, Reference Koivula2011; Rusch et al., Reference Rusch, Birkhofer, Bommarco, Smith and Ekbom2014; Hanson et al., Reference Hanson, Palmu, Birkhofer and Smith2016). We addressed three main questions: (1) What are the dominant carabid species in our organic grain system and are any species indicative of particular cover crop and tillage treatments? (2) Are carabid beetle guilds (size classes and dominant trophic behaviors) differentially affected by cover crop and tillage treatments during the transition to organic production? (3) How do environmental variables affect carabid beetle activity–density (A–D), species richness and guild, and carabid community composition during the transition to organic production?
Materials and methods
Site
The field experiment was conducted at the Russell E. Larson Agricultural Research Center (RELARC) near Rock Springs, PA (40°43′N, 77°55′W, 350 m elevation). The climate is continental with 975 mm mean annual precipitation and mean monthly temperatures ranging from 3°C (January) to 21.6°C (July). Soils at the site are shallow, well-drained lithic Hapludalfs formed from limestone residuum (Braker, Reference Braker1981). The dominant soil type at this location is a Hagerstown silt loam (fine, mixed, semiactive, mesic, Typic Hapludalf). Soil texture in our experimental field was predominantly clay loam with spatial variability in silt (range of 39.9–54.7%) and sand (14.0–27.0%) content across the field. Previously, the site had been conventionally cropped with a tomato–wheat rotation, with tomato preceding the transition experiment.
Experimental design and field operations
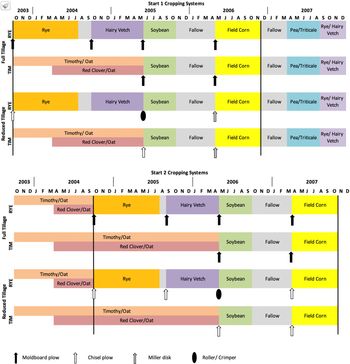
The 3-yr experiment was managed organically and culminated with organic certification. During these 3 yr, fields were planted in cover crops in rotation year 1, soybeans (Glycine max L.) in year 2 and maize (Zea mays L.) in year 3 (Fig. 1). The 2 × 2 factorial design crossed two tillage approaches with two cover crop treatments in year 1. The experiment was established twice, first in autumn 2003 and again in autumn 2004 in an adjacent field (the two experimental Starts are hereafter referred to as ‘S1’ and ‘S2’), in a randomized complete-block design with four replicates in each Start. Each treatment plot measured 24 m × 27 m (0.065 ha), which is larger than other studies that have found a significant effect of crop type and management (Lundgren et al., Reference Lundgren, Shaw, Zaborski and Eastman2006; Eyre et al., Reference Eyre, Luff, Atlihan and Leifert2012) and large enough to accommodate trivial movement patterns of carabids (Wallin and Ekbom, Reference Wallin and Ekbom2019). The site was surrounded by >7 m of the routinely mown grassy border. Treatments in S2 were off-set by one year relative to S1 (Fig. 1, Supplementary Table S1). S1 and S2 were managed similarly during the 3-yr rotation; however, in the year before initiating S2, the entire S2 field was managed organically with a mixed cover crop of timothy (Phleum pratense L.), oat (Avena sativa L.) and medium red clover (Trifolium pratense L.). All management practices followed the USDA National Organic Program guidelines (Smith et al., Reference Smith, Barbercheck, Mortensen, Hyde and Hulting2011; USDA NOP, 2019).
Management practices in Starts 1 and 2 between 2003 and 2007. The 3-yr rotation is represented between the bold vertical lines.

Cover crop and tillage treatments
In consultation with our farmer advisory board, we established two cover crop treatments common to organic feed grain systems in the fall preceding rotation year 1, and maintained them over spring and summer of year 1 (2003–2004 in S1; 2004–2005 in S2). In one cover crop treatment (RYE), cereal rye (Secale cereale L. cv. Aroostook) was planted in the fall and managed for grain and straw production in the summer of year 1. After harvest of the cereal rye, hairy vetch (Vicia villosa Roth) was planted in the fall of year 1 and killed in the following spring. In the second cover crop treatment (TIM), a mixture of timothy (P. pratense L.) and oat (A. sativa L.) was planted in the fall prior to rotation year 1. The oat served as a nurse crop to the timothy and died back over the winter. In the spring of rotation year 1, red clover (T. pratense L.) and oat were frost seeded into the timothy grass. The TIM cover crop treatment was managed for sod formation and forage production (mowed and baled). Due to differences in ground cover, biomass accumulation and management disturbances, each cover crop treatment was assumed to provide a unique microclimate and habitat that would influence carabid community structure (Carmona and Landis, Reference Carmona and Landis1999; Jackson et al., Reference Jackson, Harrison and Harrison2008; Rivers et al., Reference Rivers, Mullen, Wallace and Barbercheck2017).
The two tillage treatments were full inversion moldboard plow-based (FT) and chisel plow- and field cultivator-based, which hereinafter we refer to as reduced tillage (RT). In the RYE cover crop treatment, the hairy vetch was killed either by moldboard plow in FT or by mechanical roller-crimper in RT. The TIM treatment was first tilled in the spring of rotation year 2, prior to planting soybean. Through the remainder of the experiment, primary tillage in the FT treatments was accomplished with a moldboard plow and in the RT treatments with a chisel plow. Rotary hoe and field cultivator use was the same in both tillage treatments. In S2, additional cultivation occurred in maize in RT treatments to improve perennial weed control (see Supplementary Table S1 for the timing of cultivation practices).
Environmental variables
Disturbance frequency and intensity
While tillage is the most intensive soil disturbance, other disturbances such as mowing, rolling the cover crop, tine weeding and rotary hoeing were also imposed within both tillage treatments, which could cause direct mortality of ground beetles or cause them to disperse from the plots (Hanson et al., Reference Hanson, Palmu, Birkhofer and Smith2016). To determine the effects of total soil disturbance on carabid beetles, we estimated the frequency and intensity of soil disturbances for each of the four experimental treatments. For frequency of disturbance, we counted the number of management practices that occurred annually between January 1 and pitfall sampling events within the same year, and accumulated them during each growing season, starting with the initiation of the experiment in the fall of 2003. For the intensity of disturbance associated with each treatment, we used a USDA Natural Resources Conservation Service soil disturbance rating (SDR) (NRCS 2002). The SDR, which ranges from 0 (least disturbance) to 30 (greatest disturbance) for a field operation, is comprised of the sum of six ratings each with values from 0 to 5 that estimate the relative severity of disturbance. The six component categories of the SDR include soil inversion, soil mixing, soil lifting, soil shattering, soil aeration and soil compaction. The field operation that we employed with the highest SDR was tillage with a moldboard plow with an SDR of 29, and one of the lowest was flail mowing with an SDR of 3. To use the SDR in analyses, we summed the SDR values associated with each field operation for each treatment that accumulated between January 1 and pitfall sampling events within a season, and annually during the growing season, starting with the initiation of the experiment in the fall of 2003. Thus, our disturbance variables for each sample event in each cover crop × tillage treatment consisted of in-season values for frequency of disturbance (number of disturbances) and intensity of disturbance (SDR), each accumulated prior to each sample event, and annual values that we calculated by accumulating values between January 1 and the last field operation of the season (Supplementary Table S2). Because all plots were managed the same for each treatment combination, there was no variation in disturbance levels among plots and thus the treatment values are totals, not averages.
In year 1 of the rotation, the total annual number of disturbances and SDR were similar between tillage treatments in S1 but differed more by initial cover crop in S2 (Supplementary Table S2). By the end of the experiment, the accumulated frequency of disturbance and SDR were generally greater in FT than in RT treatments, except for the case of FT × TIM in S2, which had the least number of disturbances and lowest SDR of all the treatments. Therefore, even though we managed our nominal treatments to achieve less disturbance in RT compared to FT, quantification of disturbance revealed that this was not always the case.
Soil analysis
We sampled soils in each Start four times in each rotation year: May, June–July, August and September–October. On each sampling occasion, three soil samples were collected from random locations at least 3 m from the edge within each treatment plot. Each sample was comprised of 15 cores (2.5 cm diameter × 15.2 cm deep), thoroughly mixed by hand in a bucket, placed into a plastic bag and stored at 4°C. We used subsamples of soil from each treatment plot to determine permanganate oxidizable carbon (hereafter, POC) (Weil et al., Reference Weil, Islam, Stine, Gruver and Samson-Liebig2003; Culman et al., Reference Culman, Snapp, Freeman, Schipanski, Beniston, Lal, Drinkwater, Franzluebbers, Glover, Grandy, Lee, Six, Maul, Mirksy, Spargo and Wander2012) and soil moisture, measured as matric potential and gravimetric soil water content determined by mass loss on drying at 45°C for 72 h divided by dry soil mass. A portion of each sample was submitted for analysis to the Agricultural Analytical Services Laboratory of The Pennsylvania State University for the following characteristics: phosphorus (P), potassium (K), magnesium (Mg), calcium (Ca), cation exchange capacity (CEC), soil organic matter (SOM) by loss-on-ignition (LOI-OM), and trace elements zinc (Zn), copper (Cu) and sulfur (S). Full soil sampling and processing methods are described in Lewis et al. (Reference Lewis, Kaye, Jabbour and Barbercheck2011).
Soil entomopathogens
We used a sentinel insect bioassay method with Galleria mellonella as a bait to detect and provide a relative quantification of entomopathogenic fungi (EPF) (Zimmermann, Reference Zimmermann1986). The subsample of soil was homogenized by hand and 250 mL were placed in a 473-mL plastic container along with 15, last-instar G. mellonella. Lids were placed on the containers, which were then stored at 20°C for 10 days, when insect condition was assessed and categorized as alive, dead from causes other than fungal infection and potentially infected by EPF. Moribund and dead larvae exhibiting symptoms or signs of fungal infection were removed and rinsed briefly in 80% ethanol then in water and held in sealed humid chambers (59 mL Solo® cups) with a small piece of moistened Whatman No. 1 filter paper for 7 days. We classified sporulating cadavers as infected with Metarhizium spp., Beauveria spp. or Isaria spp. based on signs and symptoms (Goettel and Inglis, Reference Goettel, Inglis and Lacey1997). The occurrences of Beauveria and Isaria were very rare, and therefore we focused further analyses on Metarhizium (Metschnikoff) Sorokin (Order: Hypocreales; Family Clavicipitaceae). Full sentinel assay methods are described in Jabbour and Barbercheck (Reference Jabbour and Barbercheck2009).
Annual and perennial weed density
As described in Smith et al. (Reference Smith, Jabbour, Hulting, Barbercheck and Mortensen2009, Reference Smith, Barbercheck, Mortensen, Hyde and Hulting2011), we assessed the effects of the initial cover crop and tillage treatments on the density of weeds that emerged from the existing seed bank each season. Weed densities were assessed by counting all weeds present in five, 0.25 m2 quadrats randomly placed in each treatment plot, at least 3 m from the edge of the plot. Weed density measurements were made before each disturbance (e.g., mowing, cultivation) if multiple disturbances occurred within a growing season. Weed density data were summed to determine the cumulative weed density in each plot for each growing season. For analyses and presentation, the data were separated into annual and perennial weed species.
Carabidae sampling
We used a pitfall sampling method to assess the A–D of ground-dwelling Carabidae beetles (Morrill et al., Reference Morrill, Lester and Wrona1990). Three traps, each with a 114 mm mouth diameter, were randomly placed in each plot, at least 3 m from plot edges, and buried 129 mm deep so that the tops of the traps were flush with the soil surface. The traps were opened for 72 h, and then the contents were collected, traps were removed from the field and contents processed in the laboratory. Pitfall traps were collected in 2004 (June 21, August 6 and October 7), 2005 (June 20, July 28 and October 21), 2006 (July 3, August 21 and November 2) and 2007 (July 2 and November 1) (Supplementary Table S1). S1 was sampled from 2004 to 2006, and the S2 was sampled from 2005 to 2007.
We identified adult carabid beetles using taxonomic keys (Downie and Arnett, Reference Downie and Arnett1996; Ciegler and Morse, Reference Ciegler and Morse2000; Bousquet, Reference Bousquet2010) and voucher specimens from other studies at the RELARC (Leslie et al., Reference Leslie, Biddinger, Rohr and Fleischer2010). Identifications were confirmed by Mr Robert Davidson (Carnegie Museum of Natural History, Pittsburgh, PA, USA) and nomenclature was derived from Bousquet (Reference Bousquet2012). We obtained information regarding the ecology, dominant trophic behavior, phenology and size of the adults of each carabid species from various literature sources (Larochelle and Larivière, Reference Larochelle and Larivière2003; Lundgren, Reference Lundgren2009; Bousquet, Reference Bousquet2010; Bohan et al., Reference Bohan, Caron-Lormier, Muggleton, Raybould and Tamaddoni-Nezhad2011; Eyre et al., Reference Eyre, Luff, Atlihan and Leifert2012; Dearborn et al., Reference Dearborn, Nelson, Donahue, Bell and Webster2014) and an on-line source (Homburg et al., Reference Homburg, Homburg, Schafer, Schuldt and Assmann2014). We classified adult carabids into two types of ecological guilds: size classes and trophic groups (predominant feeding behavior). Size classes were assigned as: small, less than 5 mm; medium, between 5 and 10 mm; and large, greater than 10 mm in length (Eyre et al., Reference Eyre, Luff, Atlihan and Leifert2012). We characterized carabid trophic groups as carnivorous, feeding primarily on animal tissues; omnivorous, feeding on both animal and plant tissues; and granivorous, feeding primarily on plant materials, including seeds (Lundgren, Reference Lundgren2009). We archived voucher specimens at the Carnegie Museum of Natural History and at the Frost Entomological Museum at the Pennsylvania State University.
Statistical analyses
The A–D of adult carabid beetles was summed over the three pitfall traps per treatment plot for each sample date and represented the number of individuals captured per plot per 72 h for each species. To determine the dominant carabid species and whether any species were indicative of particular cover crop and tillage treatments, we calculated indicator values (IVs) for carabid beetle species among treatments using Indicator Species Analysis, a non-parametric procedure in the PC-ORD v.5 (Dufrêne and Legendre, Reference Dufrêne and Legendre1997; De Cáceres and Legendre, Reference De Cáceres and Legendre2009). The IV is the product of the relative abundance (in this case A–D) and relative frequency of the insect species in the sampled habitat, and ranges between 0 (no occurrence) and 100 (exclusive occurrence in the habitat). We used a Monte Carlo randomization procedure to determine the statistical significance (P < 0.10) for the maximum IV, representing the probability of obtaining the same or higher IV with subsequent tests given the species distribution, among treatments. Associations with a specific tillage by cover crop treatment are reported based on the highest IV for each species (De Cáceres and Legendre, Reference De Cáceres and Legendre2009).
To determine the effect of cover crop and tillage treatments on carabid beetle functional guilds, as represented by size class and dominant feeding behavior, we used univariate and multivariate statistical procedures. We used repeated measures split-plot mixed models with PROC MIXED (SAS Institute Inc., 2004) to test whether the A–D of carabid beetle guilds differed between years in the rotation, and cover crop and tillage treatments. Tillage treatment (FT or RT) was considered the main plot treatment and initial cover crop (RYE or TIM) the subplot treatment. The A–D of carabids was transformed with the formula log10 (x + 1) to achieve normality and equal variances. We accounted for repeated sampling at the same site throughout the experiment by including an auto-regressive covariance matrix in the model (Stokes et al., Reference Stokes, Davis and Koch2000). Data from each experimental Start were analyzed separately. Block was coded as a random variable.
To identify environmental variables with a significant effect on the variation in total A–D, species richness and A–D in each guild, we used forward selection multiple linear regression with JMP Pro® 13.0 (SAS Institute Inc., 2019). The pool of explanatory environmental variables included annual and perennial weed densities, weed diversity, soil properties (POC, LOI-OM, K, Mg, P, Cu, Zn, Ca, S, CEC, EC, pH and soil moisture), proportion of sentinel G. mellonella larvae infected by Metarhizium and number and intensity (SDR) of disturbances within the year prior to pitfall sampling. Untransformed data are presented in tables and figures.
To explore the relationship between carabid beetle species and environmental variables, we conducted a partial redundancy analysis (RDA) constrained by the four cover crop × tillage treatments with ‘CANOCO’ for Windows version 5.0 (Šmilauer and Lepš, Reference Šmilauer and Lepš2014). The mean A–D of carabid beetle species per plot (n = 3 traps per plot) occurring in greater than 20% of samples were included in the RDA. RDA results are displayed graphically with bi-plot scaling focused on standardized and centered inter-taxon distances, where carabid species with a fit to the model of at least 20% are represented as solid line vectors. Significant environmental variables were projected as dashed line vectors onto the bi-plots as passive supplementary response variables (Ter Braak and Šmilauer, Reference Ter Braak and Šmilauer2012).
Results
Treatment effects on carabid species
We collected a total of 2181 adult ground beetles, comprising 1.4% of all arthropods, from 26 genera and at least 58 species (Supplementary Table S3). We collected 42.6% more carabids in S1 (1281) than in S2 (899) (Table 1). There were 34 and 55% more carabids in full tillage plots in S1 and S2, respectively. Species richness showed less variation between the starts (46 in S1 and 47 in S2) and was the same between tillage treatments in both starts. Three to six more species were found in the RYE plots under full tillage in S1. Approximately 65% of the carabid beetles were from six species, in order of greatest to least A–D: Poecilus chalcites (Say), Bembidion quadrimaculatum (Say), Harpalus pensylvanicus (DeGeer), Cicindela punctulata (Olivier), Poecilus lucublandus (Say) and Bembidion rapidum (LeConte). The large carnivore, P. chalcites, the small omnivore, B. quadrimaculatum, and large granivore, H. pensylvanicus, comprised 18, 17 and 12%, respectively, of the ground beetles collected. Fifteen species were extremely rare in samples, where only one individual was collected over the course of the 4-yr study. Five species had a total of two specimens collected.
Summary of carabid activity density (A–D) and richness (S) between Starts and treatments

Several carabid species were significant indicators for specific tillage × cover crop treatments, and these results varied between S1 and S2 (Fig. 2). In S1, Agonum muelleri (Herbst) was an indicator species for FT × RYE (IV = 29, P = 0.0426) (Table 2). The A–D of A. muelleri was greatest in year 1 and then was not active in these plots again until year 3. B. quadrimaculatum was an indicator species for RT × RYE (IV = 36, P = 0.0558). The A–D of B. quadrimaculatum increased over the 3-yr period in these treatment plots. Stenolophus comma (Fabricius) was an indicator species for FT × RYE (IV = 29, P = 0.0628). We did not detect S. comma in any of the treatment plots until year 3, when it was predominantly active in FT × RYE. In S2, Harpalus herbivagus (Say) was an indicator species for RT × TIM; while the overall A–D of this species was relatively low, in 2006 and 2007 it was almost exclusively found in RT × TIM (Table 3, Fig. 2). The maximum IV for P. chalcites was significantly higher in the RT × RYE treatment (P = 0.008). However, for both starts, the IV for RYE treatments ranged from 26 to 40 indicating that P. chalcites is common and abundant throughout the rotation in the RYE treatment plots (Fig. 2). Finally, P. lucublandus was an indicator species for the RT × RYE treatment (IV = 35, P = 0.0992).
The A–D of carabid species that showed significant fidelity to particular treatments as determined by Indicator Species Analysis in Starts 1 and 2.

Indicator values and significance of Indicator Species Analysis (ISA) for carabid species collected in treatments in Start 1

Species that occurred in less than three plots were excluded from the analysis. Abundance values in the matrix were not transformed or relativized, because the procedure relativizes the data. P-values were derived from Monte Carlo randomization tests and show the statistical significance of the maximum indicator value (bolded species have P-values < 0.10).
Indicator values and significance of Indicator Species Analysis (ISA) for carabid species collected in treatments in Start 2

Species that occurred in less than three plots were excluded from the analysis. Activity–density values in the matrix were not transformed or relativized, because the procedure relativizes the data. P-values were derived from Monte Carlo randomization tests and show the statistical significance of the maximum indicator value (bolded species have P-values < 0.10).
Treatment effects on carabid guilds
Carabid size classes
The A–D of carabids (total of three pitfall traps per plot per 72 h) categorized by size class of carabids was affected by several experimental factors. Year in the rotation was the most frequent significant factor for the A–D of carabids by size class, while the main treatments of tillage × cover crop varied in their effect (Supplementary Table S4, Fig. 3). In S2, but not S1, year in rotation significantly affected the A–D of small carabids. In S1, the mean A–D of small carabids was 3.75 ± 0.33, 2.31 ± 0.33 and 3.41 ± 0.94 in years 1, 2 and 3, respectively. In S2, small carabids increased through the rotation and the mean A–Ds were 0.94 ± 0.23, 1.21 ± 0.21 and 2.55 ± 0.49 in years 1, 2 and 3, respectively. In S2, the A–D of small carabids was greater in year 3 compared with years 1 (P < 0.0001) and 2 (P = 0.0020). In S2, the proportional representation of small carabids was intermediate in year 1 (20.5 ± 5.9%), lowest in year 2 (13.4 ± 2.2%) and highest in year 3 (41.8 ± 5.4%). In S1, neither the main treatments of tillage nor cover crop significantly affected the A–D of small carabids. In S2, tillage had a significant effect on the A–D of small carabids, in which the mean A–D was greater in RT (1.92 ± 0.35) compared with FT (1.21 ± 0.23), which corresponded to a proportional representation of 25.8 ± 4.9 and 24.6 ± 4.6% of the population, respectively.
Mean annual carabid activity–density according to size class in the four cover crop × tillage treatments in each year of the experiment. FT = full tillage, primary tillage using a moldboard plow. RT = minimum tillage, primary tillage using a chisel plow. Rye = biculture of cereal rye and red clover in year 1. Tim = sod cover crop of timothy followed by hairy vetch in year 1.

Year in the rotation had a significant effect on the A–D of medium-sized carabids in S1 and S2 (Supplementary Table S4, Fig. 3). In S1, the mean A–D of medium carabids was 3.21 ± 0.22, 0.31 ± 0. 0.13 and 2.91 ± 0.65 in years 1, 2 and 3, respectively, and mean A–D was greater in years 1 (P < 0.0001) and 3 (P < 0.0001) compared with year 2. These A–Ds corresponded to 30.7 ± 2.1, 5.1 ± 2.2 and 18.9 ± 3.3% medium carabids in years 1, 2 and 3, respectively. In S2, the mean A–D of medium carabids was 0.42 ± 0.09, 1.02 ± 0.20 and 0.44 ± 0.18 in years 1, 2 and 3, respectively, and A–D was greater in year 2 than in years 1 (P < 0.0262) and 3 (P < 0.0206). These A–Ds corresponded to 8.3 ± 2.1, 11.3 ± 2.8 and 5.4 ± 1.4% medium carabids in years 1, 2 and 3, respectively. In S1, but not S2, tillage treatment affected the A–D of medium carabids. The mean A–D of medium carabids was 2.52 ± 0.50 in FT and 1.76 ± 0.31 in RT, representing 19.7 ± 3.1 and 16.8 ± 2.9%, respectively. In S1, there was a significant interaction between tillage and cover crop in which the mean A–D was 3.46 ± 0.82, 1.58 ± 0.47, 1.40 ± 0.30 and 2.13 ± 0.53 in the FT × RYE, FT × TIM, RT × RYE and RT × TIM treatments, respectively. These A–Ds corresponded to 22.3 ± 4.1, 17.2 ± 4.7, 13.5 ± 3.0 and 20.2 ± 4.9%, respectively. In RYE treatments, the A–D of medium carabids was greater (P = 0.0002) in FT compared to RT. In FT treatments, the A–D of medium carabids was greater (P = 0.0008) in RYE compared to TIM treatments.
The A–D of large carabids was affected by year in rotation in S1 and S2 (Supplementary Table S4, Fig. 3). In S1, the mean A–D of large carabids was 3.77 ± 0.33, 3.29 ± 0.42 and 8.75 ± 1.35 in years 1, 2 and 3, respectively, and A–D of large carabids was greater in year 3 than in years 1 (P < 0.0001) and 2 (P < 0.0001). These A–Ds corresponded to proportions of large carabids of 34.9 ± 2.2, 55.3 ± 5.7 and 57.4 ± 5.1% in years 1, 2 and 3, respectively. In S2, the A–D of large carabids was 3.98 ± 0.55, 7.02 ± 0.92 and 3.38 ± 0.57 in years 1, 2 and 3, respectively, and A–D of large carabids was greater in year 2 than in years 1 (P = 0.0044) and 3 (P = 0.0003). These A–Ds represented proportions of large carabids of 71.2 ± 6.6, 74.8 ± 3.6 and 51.9 ± 5.4% in years 1, 2 and 3, respectively. Neither the main treatments of tillage and cover crop nor their interactions had a significant effect on the A–D of large carabids in S1 or S2. However, in S1, the interaction of year and cover crop affected large carabids. In years 1 and 2, the A–D of large carabids did not differ between RYE and TIM, but in year 3 the A–D was greater (P = 0.0070) in RYE (11.88 ± 2.07) than in TIM (5.63 ± 0.86) treatments, representing 57.7 ± 8.1 and 46.1 ± 7.2% large carabids, respectively.
Carabid trophic behavior
Year in rotation and the main treatments of tillage and cover crop had variable effects on the A–D of carabid feeding guilds (Supplementary Table S4, Fig. 4). In S1, but not in S2, year in rotation significantly affected the A–D of carnivores. In S1, the A–D of carnivorous carabids was 6.56 ± 0.61, 3.04 ± 0.34 and 6.66 ± 0.78 in years 1, 2 and 3, respectively, and the A–D of carnivores was greater in years 1 (P < 0.0001) and 3 (P < 0.0001) compared with year 2. These A–Ds corresponded to proportions of carnivores of 60.2 ± 3.9, 51.7 ± 4.6 and 47.6 ± 5.0% in years 1, 2 and 3, respectively. In S1, the interaction of year with cover crop had a significant effect on the A–D of carnivorous carabids in which the A–D in years 1 and 2 was not different for RYE and TIM, but in year 3, the A–D of carnivores was greater (P = 0.0330) in RYE (8.44 ± 1.02) compared with TIM (4.88 ± 0.82). These A–Ds corresponded to proportions of carnivores of 46.3 ± 8.5 and 48.8 ± 5.9% in RYE and TIM in year 3, respectively. In S2, the main effect of cover crop had a significant effect on the A–D of carnivores in which the A–D in RYE (4.21 ± 0.36) was greater than the A–D in TIM (2.75 ± 0.46) treatments (P = 0.0021). The proportions of carnivores in S2 were 58.7 ± 3.9 and 44.5 ± 5.5% in RYE and TIM, respectively.
Mean annual carabid activity–density categorized by trophic guilds in the four cover crop × tillage treatments in each year of the experiment. FT = full tillage, primary tillage using a moldboard plow. RT = minimum tillage, primary tillage using a chisel plow. Rye = biculture of cereal rye and red clover in year 1. Tim = sod cover crop of timothy followed by hairy vetch in year 1.

In both S1 and S2, year in rotation significantly affected the A–D of granivorous carabids (Supplementary Table S4, Fig. 4). In S1, the A–D of granivores was 0.75 ± 0.10, 0.79 ± 0.11 and 1.81 ± 0.36 in years 1, 2 and 3, respectively, and was greater in year 3 than in years 1 (P = 0.0126) and 2 (P = 0.0099). These A–Ds corresponded to 7.7 ± 1.0, 12.8 ± 1.7, and 12.4 ± 1.9% granivores in years 1, 2 and 3, respectively. In S2, the A–D of granivores was 0.59 ± 0.15, 4.02 ± 0.50 and 0.61 ± 0.13 in years 1, 2 and 3, respectively, and was greater in year 2 than in years 1 (P < 0.0001) and 3 (P < 0.0001). The proportions of granivores were 12.2 ± 2.8, 44.3 ± 4.0 and 10.4 ± 2.7% in years 1, 2 and 3, respectively. In S2, the mean A–D of granivores was greater in RT (2.29 ± 0.50) than in FT (1.19 ± 0.27) treatments. These A–Ds corresponded to 22.9 ± 4.1 and 21.6 ± 4.2% in RT and FT, respectively. In S2, there was a significant interaction of tillage with cover crop for the A–D of granivorous carabids in which the A–D of granivores was greater (P = 0.0005) in RT (2.51 ± 0.65) than in FT (0.92 ± 0.29) in RYE treatments, but there was no difference in A–D of granivores between RT and FT in TIM treatments. In RYE, proportions of granivores were 24.0 ± 5.3% in RT and 14.4 ± 4.2% in FT.
In both S1 and S2, year in rotation affected the A–D of omnivorous carabids (Supplementary Table S4, Fig. 4). In S1, the A–D of omnivores was 3.33 ± 0.61, 2.08 ± 0.34 and 6.59 ± 0.78 in years 1, 2 and 3, respectively, and was greater in year 3 than in years 1 (P = 0.0108) and 2 (P < 0.0001). The proportions of omnivores were 32.0 ± 3.4, 35.4 ± 4.8 and 40.1 ± 5.0% in years 1, 2, and 3, respectively. In S2, the A–D of omnivores was 0.50 ± 0.11, 2.02 ± 0.25 and 2.74 ± 0.48 in years 1, 2 and 3, respectively, and was greater in years 2 (P < 0.0001) and 3 (P < 0.0001) than in year 1. The proportions of omnivores were 11.9 ± 3.2, 23.3 ± 2.6 and 43.1 ± 4.5% in years 1, 2 and 3, respectively. In S1, the interaction of year and cover crop was a significant effect for the A–D of omnivores. There was no difference in A–D of omnivores between cover crop treatments in years 1 and 2, but the A–D of omnivores was greater (P = 0.0032) in RYE (9.63 ± 2.00) than in TIM (3.56 ± 0.70) treatments in year 3. In year 3, the proportion of omnivores was 44.4 ± 8.7% in RYE and 35.7 ± 5.2% in TIM. In S2, the interactions of year with tillage and tillage with cover crop were significant for the A–D of omnivorous carabids. The A–D of omnivores was not different between RT and FT treatments in years 1 and 2 but was greater (P = 0.0136) in RT (3.56 ± 0.55) than in FT (1.92 ± 0.69) treatments in year 3. In year 3 in S2, the proportion of omnivores was 43.0 ± 5.9% in RT and 43.1 ± 7.1% in FT. The A–D of omnivores in RYE treatments did not differ between RT and FT; however, in TIM treatments, the A–D of omnivores was greater (P = 0.0067) in RT (2.51 ± 0.57) than in FT (1.11 ± 0.27) treatments. In TIM in year 3, the proportion of omnivores was 33.5 ± 6.5% in RT and 26.6 ± 5.2% in FT.
Effects of environmental variables
Carabid A–D and species richness
Environmental variables had a significant effect on carabid A–D and species richness, and these effects differed between S1 and S2 (Table 4). Four environmental variables explained the variation in total carabid A–D. In S1, soil moisture was a positive predictor, Cu was a negative predictor, and together explained 44% of the variation in carabid A–D. In S2, soil moisture, annual weed density and perennial weed density were all positive predictors and explained about 27% of variation in A–D. Eight environmental variables explained variation in carabid species richness (Table 4). In S1, soil Cu and annual SDR were negative predictors, and soil pH, CEC and P were positive predictors and explained 66% of the variation in carabid species richness. In S2, K was a negative predictor, and soil moisture and annual weed density were positive predictors and explained 33% of the variation in carabid species richness.
Statistical values for forward selection multiple linear regression analysis for significant environmental variables (explanatory variables) and Carabidae activity-density, species richness (S) and guilds (response variables)

Analyses based on [log (A–D + 1)] transformation of A–D.
Carabid assemblage
RDA constrained by cover crop × tillage treatments for each of the years in the rotation and each of the experimental Starts indicate the associations among treatment, environmental variables and carabid beetle species occurring in >25% of samples and with a fit of >20% to the model. In S1, year 1, nine carabid species met the inclusion rules, and the explanatory variables accounted for 26.8% of the variation in A–D. Axis 1 accounted for 17.3% of the variation, whereas Axis 2 accounted for 9.5% (Fig. 5a). TIM treatments were associated with the annual number of disturbances, Agonum placidum (Say), Cyclotrachelus furtivus (LeConte), B. quadrimaculatum, H. pensylvanicus, Elaphropus incurvus (say) and Trechus quadristriatus (Schrank). RYE treatments were associated with perennial weed density, annual SDR, A. muelleri, P. chalcites and Agonum cupripenne (Say). In S1, year 2 (Fig. 5b), six species met the inclusion rules and the model explained 26.5% of variation. Axis 1 explained 17.9% and Axis 2 explained 7.6% of the variation, respectively. Both TIM treatments occurred in the same quadrant of the biplot and were associated with perennial weed density, annual number of disturbances, SDR and C. punctulata. T. quadristriatus was associated with FT × RYE treatments. P. lucublandus and SDR were associated with Axis 1. B. quadrimaculatum, A. cupripenne and Clivinia bipustulata (Fabricius) were associated with RT × RYE. In year 3, the constrained model accounted for 23.9% of the variation in the carabid community with axes 1 and 2 explaining 15.3 and 8.6% of the variation, respectively. In year 3, FT × TIM and RT × TIM occurred in the same quadrant as perennial weed density. RT × RYE was associated with Dyschirius globulosus (Say) and P. lucublandus (Fig. 5c). FT × RYE was associated with SDR, Anisodactylus sanctaecrucis, S. comma, H. herbivagus and B. rapidum.
Biplots representing results of partial redundancy analyses constrained by treatments for carabid species with supplementary environmental variables for years 1 (a), 2 (b) and 3 (c) of Start 1 and 1 (d), 2 (e) and 3 (f) of Start 2. For S1, constrained axes 1 and 2 account for 17.3 and 9.5%; 17.9 and 7.6%; and 15.3 and 8.6% of the variation in years 1, 2 and 3, respectively. For S2, constrained axes 1 and 2 account for 17.0 and 11.0%; 14.8 and 9.1%; and 11.6 and 9.2% of the variation in years 1, 2 and 3, respectively. We used an inclusion rule of occurrence in 25% of pitfall samples for the inclusion of a carabid species in the analysis, and a fit of 20% to the model for inclusion of species and supplementary variables to be included on the biplot. Abbreviations for carabid taxa are presented in Supplementary Table S3.

In Start 2, the variation in the carabid community explained by the RDA declined over the 3 yr of the experiment (Fig. 5d–f). In year 1, the constrained model explained 28.0% of variation. Axis 1 explained 17.0%, while Axis 2 explained 11.0% of the variation (Fig. 5d). No variables or species were associated with RT × TIM. H. rubripes was associated with FT × TIM. Perennial weed density, annual number of disturbances and SDR were associated with RYE treatments. B. rapidum and A. cupripenne were associated with perennial weeds and RT × RYE, T. quadristriatus and P. chalcites were closely associated with the annual number of disturbances and SDR, and A. muelleri was associated with FT × RYE. In year 2 of S2, the RDA explained 23.2% of the variation in the carabid community, with Axes 1 and 2 explaining 14.8 and 9.1% of the variation, respectively (Fig. 5e). The FT treatments were co-located in the same quadrant and were not associated with any carabid species or environmental variables. Axis 1 was associated with the annual number of disturbances, SDR and soil pH. Axis 2 was associated with perennial weeds and RT × TIM, H. herbivagus and Pterostichus melanarius (Illiger). H. pensylvanicus and C. furtivus were associated with RT treatments, and P. lucublandus, Chlaenius tricolor (Dejean), C. punctulata and P. chalcites were associated with RT × RYE. In year 3 (Fig. 5f), the RDA constrained by treatment accounted for 20.9% of the explained variation in the carabid community, and Axes 1 and 2 explained 11.6 and 9.2% of the variation, respectively. TIM treatments were co-located in the quadrant with perennial weeds but no carabid taxa. The four carabid taxa with >20% fit to the model were associated with RT treatments, SDR, annual number of disturbances and perennial weeds. RT × TIM was associated with P. lucublandus and B. quadrimaculatum. RT × RYE was associated with H. affinis and Scarites quadriceps (Chaudoir).
Carabid beetle guilds: size class
Eight environmental variables contributed to the variation in the A–D of carabids categorized by size class (Table 4). In S1, annual SDR, weed species richness and annual weed density were negative predictors, and soil S and Zn were positive predictors and together explained 49% of the variation in the A–D of small carabids. Soil moisture was a positive predictor, and soil S and perennial weed density were negative predictors and explained 49% of the variation in the A–D of medium carabids. Soil moisture and annual SDR were positive predictors and soil Cu was a negative predictor for the A–D of large carabids, and together explained 39% of the variation. In S2, soil pH and sentinel insect infection by Metarhizium were positive predictors and explained 37% of the variation in the A–D of small carabids. Soil K was a negative predictor and annual SDR was a positive predictor of medium carabids and together explained 14% of the variation in A–D. Sentinel insect infection by Metarhizium, perennial weed density and weed species richness were negative predictors, and annual weed density was a positive predictor for large carabids and explained 45% of the variation in A–D.
Carabid beetle guilds: trophic behavior
Nine environmental variables contributed to the variation in A–D of carabid trophic guilds (Table 4). In S1, soil moisture was a positive predictor and soil Cu was a negative predictor, and together explained 38% of the variation in A–D of carnivores. Approximately 27% of the variation in granivores was explained by soil EC and Cu as negative predictors and LOI-OM as a positive predictor. Perennial weed density was a negative predictor and soil moisture was a positive predictor together explaining18% of the variation in the A–D of omnivores. In S2, 26% of the variation in the A–D of carnivores was explained by annual weed density as a positive predictor and annual SDR and sentinel insect infection by Metarhizium as negative predictors. Approximately 74% of the variation in granivores was explained by the annual number of disturbances, sentinel insect infection by Metarhizium and soil Cu as negative predictors and perennial weed density and soil moisture as positive predictors. Annual SDR and annual weed density were positive predictors and explained 40% of the variation in omnivorous beetles.
Discussion
Tillage
We expected that large-sized carabids would be most negatively affected by tillage intensity, because several studies have reported a reduction in body size with increasing frequency and intensity of disturbances (Blake et al., Reference Blake, Foster, Eyre and Luff1994; Coombs et al., Reference Coombs, Algina and Oltman1996; Ribera et al., Reference Ribera, Dolédec, Downie and Foster2001; Tsiafouli et al., Reference Tsiafouli, Thébault, Sgardelis, de Ruiter, van der Putten, Birkhofer, Hemerik, de Vries, Bardgett, Brady, Bjornlund, Jørgensen, Christensen, Hertefeldt, Hotes, Gera Hol, Frouz, Liiri, Mortimer, Setalä, Tzanopoulos, Uteseny, Pizl, Stary, Wolters and Hedlund2015; Hanson et al., Reference Hanson, Palmu, Birkhofer and Smith2016). However, tillage was not a significant effect for large-sized beetles, while small-sized beetles were significantly more active in RT treatments. The higher numbers of small beetles in RT plots were contrary to our hypothesis, although Holland and Luff (Reference Holland and Luff2000) mention that small carabids may prefer RT systems. We also expected granivores to be more active in RT treatments. Herbivorous ground beetle species often prefer less disturbed habitats, such as field margins with grass (Birkhofer et al., Reference Birkhofer, Wolters and Diekötter2014; Winqvist et al., Reference Winqvist, Bengtsson, Berendse, Clement, Fischer, Flohre, Weisser and Bommarco2014), likely in response to plant-based resources. In their study comparing the effects of moldboard plowing, chisel plowing and rotary tillage to an undisturbed control on carabids, Shearin et al. (Reference Shearin, Reberg-Horton and Gallandt2007) found that rotary tillage and moldboard plowing reduced granivore A–D by 52 and 54%, respectively, but that granivore A–D after chisel plowing was similar to the undisturbed control. Similarly, we found that granivore A–D was significantly higher in treatments that used chisel plow tillage (RT) in comparison to moldboard plow (FT), although the effect was greater (a 94% increase) in S2 than in S1 (only a 3% increase). Increasing land-use intensity can benefit carnivorous ground beetles (Caballero-López et al., Reference Caballero-López, Blanco-Moreno, Pérez-Hidalgo, Michelena-Saval, Pujade-Villar, Guerrieri, Sánchez-Espigares and Sans2012; Birkhofer et al., Reference Birkhofer, Wolters and Diekötter2014; Hanson et al., Reference Hanson, Palmu, Birkhofer and Smith2016); however, tillage was not a significant effect for carnivores, or for omnivores.
Cover crop
Cover crop was only significant for carnivores in S2. The carnivorous carabids that showed a preference for RYE plots, evident by RDAs and IVs, included P. chalcites, a large-sized carabid of open habitats, A. muelleri and A. cupripenne, medium-sized carabids that are common in open habitat, and B. rapidum, a small-sized carabid that is common around wetland habitat. Cereal rye was planted in rows, which may have created a more suitable habitat for these carnivores in comparison to the denser timothy/clover sod. Eyre et al. (Reference Eyre, Luff and Leifert2013) found that within an organic crop rotation, A–D of carabids was limited by a grass/clover mixture in comparison to cereal crops. Cereal rye may also have continued to provide resources, such as prey or habitat structure, to P. chalcites in the subsequent years after the cultivation of cereal rye, as the association of P. chalcites with RYE treatments continued even into the second (soybean) and third (corn) year of the rotation. Volunteer cereal rye was present in years 2 and 3 in treatment plots (Smith et al., Reference Smith, Barbercheck, Mortensen, Hyde and Hulting2011). RDAs revealed that cover crop is represented by the primary axis in the first year of the rotation in both starts. In S1, H. pensylvanicus, B. quadrimaculatum, A. placidum and E. incurvus are associated with the TIM treatment, while in S2 H. rubripes is associated with TIM. This pattern is also evident in the IVs. With the exception of E. incurvus, which is common in wet habitat, the other species are characterized as open habitat species. Without the association of environmental variables with the TIM treatment in year 1, it is difficult to say what is driving those relationships. Because the relationship is not consistent across starts for the dominant carabids, there are likely other factors involved that were not measured in the study.
Environmental variables
Many studies have examined the relationship between biotic and abiotic factors and carabid beetles (Thiele, Reference Thiele1977; Holland et al., Reference Holland, Thomas and Birkett2007; Schirmel et al., Reference Schirmel, Thiele, Entling and Buchholz2016). The results of our RDAs suggest that the structure of the carabid community is dynamic through the crop rotation. In each year, multiple environmental variables were influential in structuring the carabid community. Environmental variables with consistent negative or positive associations with informative carabid species included the intensity of soil disturbance, number of soil disturbances and perennial weed density. Using multiple regression analysis, we also identified several environmental variables (soil moisture, weed measures, annual SDR, soil Cu concentration and infection of sentinel insects by Metarhizium) that were significant predictors of variability in carabid A–D, species richness and guild.
Soil moisture
Soil moisture at our site on pitfall sample dates ranged from 12 to 21% and was one of the most frequent positive predictors for carabids. In S1, soil moisture was a positive predictor for A–D, medium- and large-sized beetles, carnivores and omnivores, and in S2, it was a positive predictor for A–D, species richness and granivores. Soil moisture is a key factor affecting habitat selection among carabids (Thiele, Reference Thiele1977) and can drive carabid larval survival, distribution, diversity and community composition (Holopainen et al., Reference Holopainen, Bergman, Hautala and Oksanen1995; Holland et al., Reference Holland, Thomas and Birkett2007). Holland et al. (Reference Holland, Thomas and Birkett2007) examined the effect soil moisture patterns in two arable fields on the distribution and abundance of nine carabid species and found stable spatial patches for six species related to soil moisture and a significant linear relationship between emergence densities and soil moisture for three species. Soil moisture content can be influenced in organic systems by increasing SOM. A meta-analysis of 60 published studies demonstrated that a 1% increase in soil organic carbon on average increased the available water capacity by 1.16%, with a larger increase in sandy soils (Minasny and McBratney, Reference Minasny and McBratney2018). Incorporating organic materials such as animal manure and finished compost into the soil increases SOM and thus water holding capacity. Straw mulches also add to SOM and increase soil moisture by reducing evaporation; however, straw mulch can deter carabids that prefer open habitat. For example, in an experiment to determine the effects of an organic cover crop-based RT system, B. quadrimaculatum was more abundant in standing cereal rye compared to cereal rye mulch created by terminating the cover crop with a roller-crimper (Rivers et al., Reference Rivers, Mullen, Wallace and Barbercheck2017).
Weeds
Weed measures were one of the most common significant predictors for carabid A–D and guild composition in multivariate ordinations and multiple regressions. Weeds affect carabids via resource-mediated effects, e.g., by providing seeds and pollen or herbivorous prey, and structure-mediated effects, e.g., by providing shelter and favorable microclimate (Pavuk et al., Reference Pavuk, Purrington, Williams and Stinner2009; Diehl et al., Reference Diehl, Wolters and Birkhofer2012; Kulkarni et al., Reference Kulkarni, Dosdall and Willenborg2015). Many carabid species are significant consumers of post-dispersal weed seeds (Kulkarni et al., Reference Kulkarni, Dosdall and Willenborg2015), and even species considered highly carnivorous have been documented to feed on weed seeds (Hunter, Reference Hunter2009; Lundgren, Reference Lundgren2013). Perennial weed density was a positive predictor of granivore A–D in S1. Carabid beetle body size is among the major determinants of weed seed preferences (Honek et al., Reference Honek, Martinkova, Saska and Pekar2007), with small carabid species preferring small seeds and large carabid species preferring larger seeds (Gaines and Gratton, Reference Gaines and Gratton2010). As expected, annual weed density was a positive predictor for carabid A–D and most guilds in S2. However, contrary to our prediction, perennial weed density and weed species richness were negative predictors for large carabids in S2. We expected that the association of large carabids would be greater in plots with perennial weeds, as perennial habitats are generally more supportive of larger and slower carabids.
Disturbance frequency and intensity
Tillage and other soil management operations can have a profound effect on the environment for carabid beetles and other soil organisms, influencing, e.g., arthropod prey, weed flora and seed distribution, and vegetation cover as well as abiotic properties. Our study demonstrates that nominal tillage treatments may not result in a simple and consistent difference in disturbance frequency and intensity, especially if plots are managed for the agronomic value of the cash crop. For example, because of weather and soil conditions, we had to implement additional secondary cultivations in S2 soybeans to facilitate crop emergence in the RT × TIM treatment.
Annual SDR and the number of disturbances were significant environmental variables for the A–D of some carabid species and guilds. The RDAs indicated species with significant responses to soil disturbance in each year of the two Starts. In S1, the intensity of soil disturbance was a negative predictor for carabid species richness and small carabids, and, unexpectedly, a positive predictor for large carabids. RDAs revealed that the A–D of our most frequently captured species, the large carnivore P. chalcites, was positively related to the intensity of soil disturbance in year 1 of both Starts, but not in years 2 and 3, which may have been due to the field preparation of cover crops in the fall before the rotation year. Spring breeders that overwinter as adults may be protected from fall tillage activities by burrowing deep in the soil profile and escaping direct disturbance (Holland and Luff, Reference Holland and Luff2000). Alternatively, P. chalcites is more active in conventionally tilled fields as found in other studies (Menalled et al., Reference Menalled, Smith, Dauer and Fox2007; O'Rourke et al., Reference O'Rourke, Liebman and Rice2008).
In S2, the intensity of disturbance was a positive indicator for medium carabids and omnivores, and a negative indicator for carnivores. The frequency of disturbance was a negative predictor for granivores in S2. In RDAs, the small omnivores B. quadrimaculatum and T. quadristriatus, as well as the medium granivore, H. herbivagus, were positively associated with disturbance vectors. Large carnivores with a negative association with the vectors for disturbance in S2 included C. tricolor, and the dominant species, C. punctulata and P. lucublandus. Unlike in year 1, P. chalcites was negatively associated with vectors for disturbance in year 2. The inclusion of this species as a significant responder to disturbance in opposing ways at different times in multivariate ordinations suggests that it is insensitive to disturbance. The consistent inclusion of soil disturbance indicators as significant variables for guilds and species in multivariate analyses suggests that future studies that aim to compare the effects of soil management treatments on Carabidae and other soil-associated arthropods should quantify disturbance associated with specific practices in an ecologically meaningful way. We chose to quantify disturbance prior to a pitfall sample by intensity and frequency within the season and accumulated over the rotation. However, there may be other disturbance variables, such as time since last disturbance or disturbance during the breeding season, that we did not include that are important to the A–D, reproduction and survivorship of carabids.
Soil copper
We measured several soil minerals, including Cu, S and Zn. In S1, Cu was a negative predictor for A–D, richness (S), large-sized species, carnivores in S1 and for granivores in both Starts. Copper had a direct acute toxic effect on mortality of larval Pterostichus cupreus L. and locomotor behavior of adults produced from surviving larvae was impaired (Bayley et al., Reference Bayley, Baatrap, Heimbach and Bjerregaard1995). These authors suggested that such changes in locomotor behavior are likely to reduce carabid fitness under field conditions. In our site, Cu concentrations were within normal ranges for crop production, and were likely increased by the application of animal manure and manure-based compost used to provide soil fertility. In organic production systems, animal manures are very commonly used to manage soil fertility. The negative association between Cu and carabids at our site suggests that the broader relationship between soil Cu and epigeal arthropod predators should be examined.
Entomopathogenic fungi
Cosmopolitan EPF in the genus Metarhizium (Metschnikoff) Sorokin (Hypocreales: Clavicipitaceae) occurs primarily in soil and have a broad arthropod host range and are well-adapted to agricultural systems (Meyling and Eilenberg, Reference Meyling and Eilenberg2007). In S2, infection of sentinel insects by Metarhizium was a positive predictor for small-sized species, and a negative predictor for large-sized species, carnivores and granivores. Some practices or environmental conditions may result in increases of infection by pathogens and survival of eggs, larvae, pupae or adults (Holland and Luff, Reference Holland and Luff2000), but relatively few studies have focused on the association between agricultural practices and epigeal predators and EPF. Steenberg et al. (Reference Steenberg, Langer and Esbjerg1995) found a high prevalence of infection by EPF, from 19 to 50%, in carabid larvae from lucerne and cabbage fields in Denmark. Specifically, they noted infection of larvae of the granivore, Amara fulva (Müller), Harpalus sp. and ‘other carabids’. At our study site, we detected Metarhizium more frequently in the FT × TIM treatment and this fungus was negatively associated with soil moisture, organic matter, and zinc, sulfur and copper concentrations (Jabbour and Barbercheck, Reference Jabbour and Barbercheck2009). Although we did not directly observe or test for fungal infections of carabids, it is interesting that soil moisture was a positive predictor for carabids but a negative predictor for Metarhizium. This pattern could reflect either lower mortality of carabids in areas of high moisture and low Metarhizium prevalence, or avoidance of beetles of areas or conditions that favor Metarhizium (Fry et al., Reference Fry, Fergusson-Kolmes, Kolmes and Villani2019).
Conclusion
We tested the effects of two levels of tillage intensity (moldboard plow vs chisel plow) and two different cover crop mixes (a rye cereal with hairy vetch vs a sod-forming timothy grass with clover) on carabid beetles. We used several carabid response variables including total A–D, richness, individual species, size classes and trophic behavior. While tillage had a significant effect on granivores and small beetles, both preferring the RT treatment, cover crop treatments had a significant effect on carnivores and in particular on P. chalcites, which was found in greater numbers in the RYE treatment, which provided a more open habitat and potentially other resources that persisted into the third year of the rotation. Our research also shows how the level of disturbance is more complex than reflected by nominal treatments. Our RT treatments generally experienced a similar frequency of disturbances, but lower intensity of disturbance compared with full tillage treatments over the 3-yr transition period. The frequency and intensity of disturbance negatively affected A–D for some carabid guilds and species, but not all. P. chalcites, e.g., was positively associated with other environmental variables, such as weed density, soil moisture, pH and soil copper. The habitat affinity of agriculturally adapted carabid species is likely the result of a combination of environmental variables that make a habitat suitable based on the species phenology and behavior (Thiele, Reference Thiele1977; Holland and Luff, Reference Holland and Luff2000). We found that management practices that encourage soil moisture support a diverse weed community, and reduce the frequency and intensity of disturbance support total carabid A–D, richness and the majority of guilds, which may increase biological control services during the transition to organic production.
Supplementary material
The supplementary material for this article can be found at https://doi.org/10.1017/S1742170519000255
Acknowledgements
This research would not have been possible without Dr Randa Jabbour, who led the pitfall data collection from the plots. We thank S. Harkcom, D. Heggenstaller, V. Houck, B. Jones, S. Kinneer, C. Nardozzo, D. Sandy and S. Smiles for providing technical assistance, and many undergraduate students who diligently sorted insects. We gratefully acknowledge the advice provided by our advisory board: C. Altemose, L. Garling, J. Moyer, B. Snyder, K. Yoder, P. Yoder, A. Ziegler and L. Zuck. Funding for this research was provided by the USDA NIFA Competitive Grants Program-IPM-ORG-112.E.