

Background
The archaeological landscape of the eastern United States contains numerous stone structures of various forms, constructed by stacking rocks without mortar. These include cairns, walls, platforms, open enclosures, roofed chambers, and other shapes. One compilation lists 5,500 such structures across 16 states and three Canadian provinces, mostly in New England, New York, and Pennsylvania (Hoffman Reference Hoffman2018). The structures have not received much professional attention because of controversy in the twentieth century about who built them (Hoffman Reference Hoffman2018).
Reflecting extreme diffusionist views, antiquarians such as William Goodwin (Reference Goodwin1946) proposed the structures were built by precolumbian European migrants. This led many archaeologists to counter that they were simply the by-product of colonial farmers trying to scratch a living from the New England hill country (e.g., Cole Reference Cole1982). These archaeologists also dismissed the possibility of Native American origins, maintaining that all professional investigations of these structures have “invariably demonstrated that these features are associated with the activities of European settlers and have no Native American (or other) origin” (Provencher and Mahlstedt Reference Provencher and Mahlstedt2007). Ives (Reference Ives2015) argued that cairn fields in Rhode Island resulted from farmers clearing upland fields of stones in the early nineteenth century before the agricultural potential of the land was exhausted and the land returned to forest. An argument against this would be if the stones in the structures were of distant origin. However, with some exceptions (Feathers and Muller Reference Feathers and Muller2020), the rocks in these structures are locally available. Neudorfer (Reference Neudorfer1979) cites historical evidence, primarily oral testimony bolstered by historical context, that various stone chambers in Vermont were used as root cellars. Feder (Reference Feder2019) argues that more unusual structures—such as stone circles or tables with channels—served as mills for pressing cider, making soap, or extracting tannin from bark.
A hypothesis of Native American origins has its adherents (Mavor and Dix Reference Mavor and Dix1989), including Native Americans themselves. United South and Eastern Tribes, organized in 1969 by 33 federally recognized tribes in the eastern United States, passed a resolution in 2007 identifying these structures as part of a sacred ceremonial stone landscape and demanding government agencies to recognize them as such. They particularly singled out State Historical and Preservation Offices (SHPOs) for mistakenly attributing them to colonial farmers (Patterson and Downing Reference Patterson and Downing2007). Hoffman (Reference Hoffman2018) constructs a series of conditions that should be met if the structures were built by colonists, precolumbian migrants, or Native Americans. Reviewing the evidence, he comes down solidly in favor of Native Americans.
Resolution of the issue will not proceed without procuring convincing evidence. Determining their age is a start, particularly whether they are precolonial or not. Comprehensive dating strategies have been employed recently in other contexts to resolve Indigenous/colonial interpretations of the archaeological record (Birch Reference Birch2022; Holland-Lulewicz et al. Reference Holland-Lulewicz, Thompson, Wettstaed and Williams2020; Panich and Schneider Reference Panich and Schneider2019).
The colonial period in the northeastern United States begins AD 1620, the year the Pilgrims landed in Massachusetts; or in Canada, AD 1608, when the French founded Quebec. Assorted European explorers and adventurers visited New England earlier, but their influence did not extend beyond the coast or major rivers such as the St. Lawrence, and they did not establish any permanent settlements. The Pilgrims—and later, Puritans—in Massachusetts were at first confined to the coast as well. Concord, Massachusetts, one of the earliest inland communities, just 25 km west of Boston, was founded in AD 1635.
Providing ratio-scale ages for construction of these structures is not simple. Hoffman (Reference Hoffman2018) lists 20 radiocarbon ages, and Whittall (Reference Whittall1991) lists 25, but only 11 ages appear on both lists. The ages range from radiocarbon years 4340 to 130 BP, with only four younger than 400 BP. Almost all ages were determined on charcoal from fill in and around the structures, but old charcoal can find its way into younger deposits. Whittall (Reference Whittall1991) lists some ages taken from “hearths,” but hearths are not easily related to structures either. The event dated by radiocarbon is the isolation of carbonaceous material from the carbon cycle to prevent any replenishment of 14C. This is usually the death of some organism. A bridging argument must be made to relate this carbon clock start to the event of interest—in this case, the construction of the stone structures. Few such arguments have demonstrated to us the validity of the radiocarbon ages in this case.
Fifty-eight luminescence ages are available, determined for both sediments and rocks. The sediments come from either underneath or within the structures, whereas the rocks are part of the structures. The event dated by luminescence is the last exposure to sunlight. With carefully collected samples, this event can relate directly to a construction event.
The luminescence ages were processed at the University of Washington (UW) and the United States Geological Survey (USGS). Two technical reports have been published (Feathers, Frouin, and Bench Reference Feathers, Frouin and Bench2022; Mahan et al. Reference Mahan, Martin and Taylor2015), plus another report in an archaeological journal (Feathers and Muller Reference Feathers and Muller2020); a USGS dataset is available publicly (Mahan Reference Mahan2021). The reports and dataset include 33 luminescence ages. Technical data on the other 25, along with a brief description of luminescence principles, are given in Supplemental Texts 1–4.
Luminescence and Stone Structures
Using luminescence to date structures has a history almost as long as the method itself, but most work has occurred in the last 20 years (Bailiff Reference Bailiff, Rink and Thompson2015). Work has targeted either material making up the structures or sediments associated with them. Except for heated building materials such as bricks (Bailiff Reference Bailiff2007), the dating event in these analyses is last exposure to sunlight.
Most samples in this study are sediments associated with the structures. Some overlie the structures, making them stratigraphically younger, providing only a minimum age for construction. Most, however, were collected from underneath the structure. The rationale for this lies in soil turbation. Before the bottom rocks of the structure were put in place, sediment forming the surface was subject to turbation processes that brought grains to the surface, including tree fall, root pressure, animal burrowing, and freeze-thaw processes. Farmers in New England are well aware of these processes because of the continual need to remove rocks from their fields (Gage Reference Gage, Lavin and Thomas2023). Once on the surface, grains are exposed to sunlight, which removes their luminescence signal either wholly or partially before being turbated back into the soil. The top layers of sediment then contain grains that range in age from the very recent to the time of original deposition. Rock placement stops grains moving to the surface. The youngest grains in these top layers should then date the rock placement. This rationale has been used with success in dating rock structures in the Great Plains (Feathers et al. Reference Feathers, Zedeño, Todd and Aaberg2015; Feathers, Aaberg, et al. Reference Feathers, Frouin and Bench2022), the Near East (Holzer et al. Reference Holzer, Avner, Porat and Horwitz2010; Porat et al. Reference Porat, Rosen, Boaretto and Avni2006), Australia (Kemp et al. Reference Kemp, Olley, Stout, Pietsch and Aboriginal Corporation2022), and Europe (Outram et al. Reference Outram, Batt, Rhodes and Dockrill2010; Vafiadou et al. Reference Vafiadou, Murray and Liritzis2007). There are reasons why the assumptions of this idea might not hold; for example, lateral movement of grains after rock placement. Also, the builders may have removed the original surface before placing the rocks, allowing sediment below the rocks to provide accurate construction ages only if grains were exposed during this preparation.
We have also dated the rocks themselves. If a rock surface was exposed to sunlight just prior to being placed in the structure and that surface has not been exposed since, then that surface could date the time of construction. Dating rock surfaces has become popular in recent years (Sohbati Reference Sohbati, Rink and Thompson2015). To make sure the luminescence signal from the surface was sufficiently reset prior to placement, a depth profile is constructed, plotting a measure of luminescence against depth into the rock. If a rock surface has not been exposed to light for several hundred thousand years or so, the luminescence signal measured at the surface will be saturated, because all traps in the mineral crystal lattice have been filled, and the luminescence signal no longer grows with dose. When exposed to light, luminescence will be progressively removed as a function of depth and time (Sohbati, Murray, Chapot, et al. Reference Sohbati, Murray, Chapot, Jain and Pederson2012). An idealized example of a depth profile is shown in Figure 1.
Depth profile plotting depth below the surface of the rock and the intensity of the luminescence signal. The plateau at deeper depths represents luminescence saturation. The plateau at shallow depths represents bleaching at some point in the past. Partial bleaching is shown in between.

The plateau at deeper depth is the region of saturation, where light has not penetrated at all. The plateau at shallower depth is the region that was completely bleached during exposure for a particular time. A weak or no plateau at shallow depth indicates that the time of exposure was very short before burial or that the opacity of the rock limited light penetration. The level of luminescence at this plateau is used to estimate the date of burial. One can imagine several plateaus in the lower section if the rock had been exposed and buried multiple times, displaying a history of light exposure (Freiesleben et al. Reference Freiesleben, Sohbati, Murray, Jain, al Khasawneh, Hvidt and Jakobsen2015; Sohbati, Murray, Buylaert, et al. Reference Sohbati, Murray, Buylaert, Almeida and Cunha2012). A rock currently exposed will have a plateau at shallow depths of near zero luminescence.
Sampling
Samples listed in Table 1 and Supplemental Tables 1-1 and 1-2 were collected over several years, mostly in 2020–2021. The counties in which they are located are shown in Supplemental Figure 1-1. No attempt was made to collect a representative sample, but a variety of different kinds of sites were selected. At any individual site, an attempt was made to sample different kinds of structures. Most sampled structural forms were walls (14), roofed chambers (12), and rock piles (12).
Summary of the Ages.

a Probable maximum age.
Most sediments were collected from underneath rocks without light exposure. Rock portions in the immediate vicinity of the sediment samples were collected for additional radioactivity assay. A CaSO4 dosimeter was usually placed at the sample location. Rock samples were extracted under an opaque tarp. The rocks had at least one unexposed surface, which presumably was last exposed at the time of construction. An adjacent rock opposite the surface to be tested was collected for radioactivity assay. A dosimeter was also left at some rock locations.
All sampled structures are clearly anthropogenic, except the three boulders at Council Rocks, which are believed to be anthropogenic because of their location. Only four samples were taken from a structure of known age. UW4106 and UW4108 are rocks that formed part of a house cellar in Milford, New Hampshire, constructed between AD 1740 and 1760, according to historic records (Gage Reference Gage2022). Neara #28 and Neara #87 are sediments from underneath the foundation.
Methods
Luminescence methods are detailed in the technical articles cited earlier and Supplemental Texts 3–4. Here a general description of methods is outlined.
Dose Rate (Dr)
Dr involves rates of alpha, beta, gamma, and cosmic radiation. Short-ranged alpha radiation is not too significant for coarse-grained analysis of quartz and feldspars. Medium-ranged betas are determined from the samples themselves, although in the case of rock surfaces, some of the betas contributing to the luminescence stem from an abutting rock. If potassium feldspar grains are being dated, there is also an internal beta contribution from 40K. This was assumed to be 10 ± 3%, after Smedley et alia (Reference Smedley, Duller, Pearce and Roberts2012) with a slightly higher error. For quartz, variation in the beta dose rate to individual grains can vary according to how far grains are from beta sources. The beta radiation from the U and Th decay chains—likely associated with clay minerals—is probably evenly distributed, but betas from K-feldspars, micas, or other coarse-grained minerals may have a less uniform distribution. This heterogeneity was modeled by Mayya et alia (Reference Mayya, Morthekai, Murari and Singhvi2006) and Chauhan et alia (Reference Chauhan, Selvam, Anand, Shinde, Mayya, Feathers and Singhvi2021) and applied to the UW samples to see if the equivalent dose (De) distribution could be attributed to such heterogeneity (Feathers et al. Reference Feathers, Evans, Stratford and de la Peña2020).
The long-range gamma Dr is difficult to determine accurately for these samples. The immediate environment of the samples is a complex juxtaposition of rocks, sediment, and air. One estimate of gamma Dr measures the radioactivity in the laboratory on various parts of the environment and calculates the contribution of each considering the geometry and gradients of dose with distance (Aitken Reference Aitken1985:Appendix H; Mahan et al. Reference Mahan, Martin and Taylor2015:Supplement). Additional rocks and sediments were collected for this purpose. We call this the “laboratory measurement.” The complexity of the geometry makes this calculation error prone, partly because the exact geometry behind the sample is unknown.
A more direct method is to use a field dosimeter. The UW used a CaSO4:Dy dosimeter, which builds up a large luminescence signal for a small amount of dose. We call this the “field measurement,” although only the gamma and cosmic radiation dose is measured by the dosimeter, with beta and alpha radiation determined in the laboratory. The problem here is being able to place the dosimeter so it detects exactly what the sample detected, because the sample has been removed. In addition, the dosimeter is only in one spot, whereas the sample covers a larger area. In this complex environment, dose rate can vary on the order of centimeters. For most UW samples, both field and laboratory approaches were applied and compared. Where the total dose rates differed by more than 1σ between laboratory and field measurements, we considered the more direct field measurement as the best estimate. The USGS made only laboratory measurements but with extensive analysis of sample geometry (Mahan et al. Reference Mahan, Martin and Taylor2015:Supplement).
For rocks, an abutting rock adjacent to the surface being dated was collected. Some beta dose affecting the luminescence of the surface of the dated rock arises from the adjacent rock. At the interface between the two rocks, the beta dose rate will be 50% from the dated rock and 50% from the adjacent rock. For a few samples, an adjacent rock could not be obtained without damage to the structure. The gamma dose rate was calculated as it was for the sediments. For some rocks, only field measurements were available for the gamma dose rate. For other samples, even though a dosimeter was placed, the laboratory measurements might be more accurate because it was difficult to determine a representative dosimeter measurement given that both dated and adjacent rocks were removed. The laboratory measurements were used for these.
Cosmic radiation was determined following Prescott and Hutton (Reference Prescott and Hutton1994), taking into consideration latitude, longitude, altitude, depth, density, and the geometry and height of the structures.
Equivalent Dose (De)
For rocks, at least three 1.5 cm cores were drilled into the surface using a diamond-tipped bit. These cores were cut into approximately 1 mm thick slices using a diamond-tipped saw. Portions of each slice were then measured for De, with no attempt to differentiate grain size or mineral. Types of rocks included granitic gneiss or schists, granite or granodiorite, quartzites or quartz-rich sandstone, and metamorphic amphibolite. Inspection through a low-power binocular microscope revealed the grain size to be in the 150–250 μm range.
For sediments, luminescence was measured on 180–212 μm single grains of quartz and potassium feldspars, isolated from the samples following standard procedures. Luminescence was measured using optically stimulated luminescence (OSL) for quartz and infrared stimulated luminescence (IRSL) for feldspars. For most UW samples, both quartz and K-feldspar were measured; for USGS samples, quartz was measured on all samples, but feldspar only on the two Pratt Hill samples. De was determined on single grains for all UW samples for the Upton samples at USGS, and on 10–50 grain aliquots for the other USGS samples.
De was measured on sediment grains using the single-aliquot regeneration (SAR) protocol (see Supplemental Table 2-1). This produces a De value for each grain (or small aliquot) and therefore a distribution of De values for the entire sample. The distribution was evaluated using statistical measures commonly used in luminescence (Galbraith and Roberts Reference Galbraith and Roberts2012). One measure is called the “central age model,” which determines a geometric mean and computes an overdispersion value as a standard deviation. Overdispersion is a measure of spread. Where all values are statistically consistent with a single value, the overdispersion is zero.
Because many samples are thought to be of mixed age, with only the youngest grains related to rock placement, a minimum age model (MAM)—which statistically isolates the youngest grains from a truncated normal distribution—is also applied. The MAM requires input of an overdispersion value typical of a single-aged sample. Determination of this value begins with the overdispersion from a dose recovery test, although typical overdispersion is usually more than that. For quartz, overdispersion due to beta heterogeneity can be factored in by increasing the typical overdispersion until, from the model, differences between the central age and the minimum age can no longer be attributed to beta heterogeneity. For feldspar, most beta heterogeneity probably stems from differential concentration of internal potassium (K). A large enough error term on the K content can account for beta heterogeneity. It is often useful to experiment with different overdispersion values. Minimum age values often do not vary much over a wide overdispersion range. Distributions of De values can also be evaluated visually using radial graphs, which plot precision against a standardized De value in relation to a reference, similar to a z-score. Radial graphs are preferred over histograms because they account for differential precision, which is important for single grains that differ widely in their luminescence sensitivity. For some samples, a finite mixture model (FMM) was used to divide the distribution into components, each statistically consistent with a single value. For the Upton samples, the USGS analyses used the youngest component as the best estimate of depositional age.
Unlike quartz, feldspars suffer from anomalous fading, or loss of luminescence signal through time from deep traps, which, from kinetic considerations, should not lose their signal at ambient temperatures. Fading is thought to result from quantum tunneling through energy barriers. A variety of methods are used to correct or circumvent it. For young samples such as these, correction by the Huntley-Lamothe method (Huntley and Lamothe Reference Huntley and Lamothe2001) is robust and is applied here.
For rocks, because quartz and feldspar were not physically separated, a double SAR protocol is used (Banerjee et al. Reference Banerjee, Murray, Bøtter-Jensen and Lang2001). In this procedure, the normal SAR protocol includes an infrared stimulation preceding a blue-light stimulation. The rationale is that infrared only stimulates feldspar luminescence, so applying it first removes most of the feldspar signal, and the subsequent blue stimulation only measures quartz luminescence. Banerjee et alia (Reference Banerjee, Murray, Bøtter-Jensen and Lang2001) used the revised protocol to eliminate feldspar signals in a quartz sample, but here we use it to determine De from both feldspar and quartz. Although feldspar is also stimulated by blue light, in most cases, the separation of the signals generated from feldspar and quartz is sufficient to compare De values from the two minerals. An anomalous fading test is applied to both signals.
Results
Results are detailed in Feathers, Frouin and Bench (Reference Feathers, Frouin and Bench2022), Feathers and Muller (Reference Feathers and Muller2020), Mahan et alia (Reference Mahan, Martin and Taylor2015), Mahan (Reference Mahan2021), and in Supplemental Texts 1, 3–4. A general discussion is provided here.
Dose Rate (Dr)
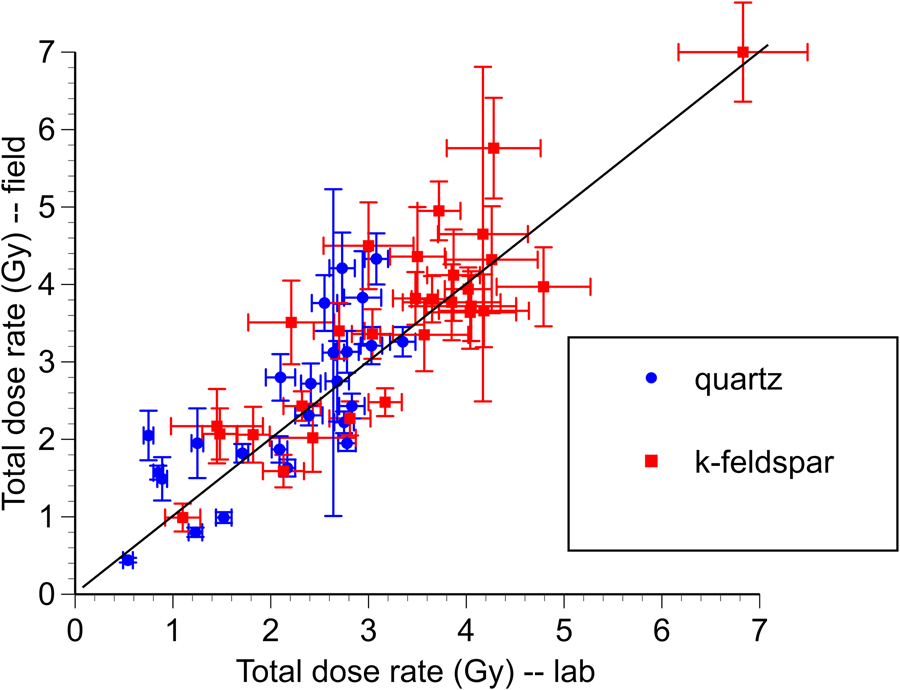
The largest uncertainty in Dr lies with the external gamma dose rate because of sample exposure to complicated environments. A larger error can be tolerated in the gamma dose rate for samples that have a high beta dose rate. Therefore, we compare total Dr for all UW samples where both field and laboratory measurements were made (Figure 2); data for UW4102 are not included in the figure because the dosimeter reading was abnormally high. The comparisons cluster around the 1:1 correspondence line, suggesting that overall differences are not great. For quartz, nine of 25 comparisons were within 1σ, and 15 of 25 were within 2σ. For K-feldspars, where the Dr also includes internal K, differences for 20 of 29 comparisons were within 1σ, and 28 of 29 were within 2σ (Supplemental Tables 1-3 and 1-4). The difference between ages using either laboratory or field measurements is even less significant because error terms are dominated by errors on De. Where the age differences are significant, we use the age calculated using the field measurements.
Comparison of dose rates between laboratory and field measurements for UW quartz and feldspar samples. The straight line is a 1:1 correspondence. Error bars are 1σ. The field measurements include laboratory-determined alpha and beta dose rates.

Selection Criteria and Sensitivity: Sediments
To determine a grain's De value, the signal from the grain must meet certain requirements. Criteria—many related to meeting the assumptions of the SAR protocol—are established to screen grains so that only those with reliable signals are accepted (see technical articles and Supplemental Tables 3-5 and 3-6). The criterion resulting in the vast majority of rejections is the requirement that the grain have a measurable signal above background, or good sensitivity. Where this criterion dominates rejections, the acceptance rate or the percentage of grains that pass all criteria is then a good proxy for sensitivity. Supplemental Table 1-5 gives the acceptance rate of quartz and feldspars for all UW single-grain sediment samples. Feldspar has higher acceptance rates and is therefore more sensitive than quartz, with five exceptions, the two largest being UW4178 and UW4179, located 16 km from each other on the south slope of Blue Mountain in eastern Pennsylvania.
Areas subject to recent glaciation during the Pleistocene tend to have quartz with low sensitivity. The University of Quebec–Montreal laboratory has found very little sensitive quartz in Quebec—especially for glacial and postglacial sediments—according to its director, Michel Lamothe. Adjacent parts of New England and New York were thought to have the same problem, but several samples collected in these areas for this study did have sensitive quartz. Low quartz sensitivity for UW4169, UW4175, and UW4176, all in Vermont and Massachusetts, prevented derivation of a quartz De on these samples, given limits on machine time. Quartz was not measured on UW4079 and UW4097.
Sawakuchi et alia (Reference Sawakuchi, Blair, DeWitt, Faleiros, Hyppolito and Guedes2011) identified two main factors that control OSL sensitivity of quartz: (1) thermal history (temperature of crystallization) and (2) number of cycles of burial and solar exposure (see also Bartyik et al. Reference Bartyik, Magyar, Filyó, Tóth, Blanka-Végi, Kiss and Marković2021; Sharma et al. Reference Sharma, Chawla, Sastry, Gaonkar, Mane, Balaram and Singhvi2017; and Souza et al. Reference Souza, Pupim, Mazoca, del Río, Mineli, Rodrigues, Porat, Hartmann and Sawakuchi2023). Their discussion found that quartz sensitivity was lower in fluvial sediments than in coastal sediments, and that it was highest in dunes. It was higher in downstream sediments than those near headwaters. Grains with short preburial sedimentary histories (such as fluvial or glaciofluvial) have much lower sensitivity than those with relatively long sedimentary histories (such as dunes or coastal sediments). Although there are exceptions, northern New England samples in this study tend to have quartz with sensitivity that is lower than those in southern New England and southern New York. Although all New England was glaciated during the last glacial maximum at 20 ka, southern New England was ice-free by 15,000 years ago (Oldale Reference Oldale1992). Upton sits in south Massachusetts, and the quartz is unusually sensitive for the location. Surrounding bedrock geology of granites that have been battered by glaciers, reworked in streams and—in some significant spots (atop Pratt Hill)—worked by wind have increased sensitivity of quartz for luminescence dating.
The cause of low feldspar sensitivity in Blue Mountain is not known, but it must relate to the peculiar geology of this area. Original Blue Mountain sediments, deposited in the Silurian, were coarse, gray, and poorly sorted (Commonwealth of Pennsylvania 2020) and then scraped by successive glaciation and dumped into glacial rivers. These conditions are not ideal for sensitivity of any sediment; however, the quartz was sensitive. A De value for feldspars from these two samples was not derived.
Another aspect of the quartz signal is the contribution of various components to the signal. The quartz signal is known to be a composite of different signals that bleach at different rates (Jain et al. Reference Jain, Murray and Bøtter-Jensen2003). The easiest bleached signals are called the “fast” component, and laboratory protocols such as SAR are premised on the sample being dominated by the fast component. If the measured luminescence is instead dominated by “medium” or “slow” components, then such protocols cannot be used (Duller Reference Duller2012; Wintle and Murray Reference Wintle and Murray2006) without risk of inaccurate results.
Equivalent Dose (De) and Age: Sediments
A dose recovery test was performed on both quartz and K-feldspar single grains at UW. For quartz, 241 grains from 9 samples yielded a ratio of given to derived dose of 1.00 ± 0.01, with an overdispersion of 9.9%—near perfect. For feldspar, 672 grains from 14 samples gave a ratio of 1.07 ± 0.02, with an overdispersion of 48.3%—a little overestimated with a very high overdispersion. Excluding four feldspar samples, all run in the same batch and each individually with an overdispersion more than 40%, makes overdispersion on the other 10 samples of only 30%. The overdispersion considered typical of a single-aged sample for MAM and FMM was initially set at 15% for quartz and 30% for feldspar for UW samples. Using 30% for quartz and 15% for feldspars resulted in few differences in number and values of FMM components and no differences at 1σ in minimum ages. Using FMM and the model from Chauhan et alia (Reference Chauhan, Selvam, Anand, Shinde, Mayya, Feathers and Singhvi2021), the difference among components could not be explained by beta heterogeneity at either 15% or 30% overdispersion. With the 3% error term on internal K, any beta heterogeneity in the K-feldspars is likely not significant either. For USGS samples at Upton, an overdispersion of 15% was used for FMM, the youngest component of which was used for age determination.
A correction for anomalous fading was applied to the derived age for each K-feldspar grain at UW. Fading rates, or g-values, vary considerably for single-grain data, and the precision can be low, but fading rates on single grains—and particularly summary statistics—have been shown to be broadly reproducible, including for samples from this study (Feathers et al. Reference Feathers, Evans, Stratford and de la Peña2020; Feathers, Frouin, and Bench Reference Feathers, Frouin and Bench2022). A similar correction was applied for small aliquots measured at Pratt Hill (Supplemental Table 1-7).
Supplemental Tables 1-6 and 1-7 give the De from the Central Age Model for each sample for both quartz and K-feldspar. Overdispersion values are much higher than the 20%–30% or so one might expect for a single-aged sample. Beta dose heterogeneity does not explain this high overdispersion, nor do differential fading rates for feldspars. The overdispersion of the corrected ages is just as high as that for De (data not shown). High overdispersion is expected for samples collected under rocks, if the turbation model explained earlier is correct. The minimum age model should provide the age of rock placement if there was no lateral turbation after placement. The extent of turbation after placement is partly a function of depth, given that shallower samples are more likely to have younger grains moving laterally. Most samples were collected from 0.5 to 0.37 cm below the current ground surface, but a few samples were from chambers, and they were more than 2 m below the current ground surface at depths where lateral turbation is not expected. Two samples collected in these deeper areas show older ages, but two have ages in the same range as the others. One sample at 2 m depth is the same age as another at 5 cm depth. This is not expected if post-placement movement did occur. It also cannot explain why most of the ages are similar, as we shall see. The MAM ages (and FMM for the Upton samples) are also given in Supplemental Tables 1-6 and 1-7. The laboratory Dr values are used for these ages except for samples where the laboratory and field Dr differ by more than 1σ—in which case, the field Dr values are used. The only exception is UW4102, where the laboratory Dr was used because the field dosimeter measurement was abnormally high.
The feldspar ages are generally older than the quartz ages (Figure 3) aside from three samples: UW4076, UW4103, and PR-1a. Only on UW4103 is the difference between quartz and feldspar ages more than 1σ. Interestingly, the quartz age for this sample is similar to the feldspar age of the other sample from that site, UW4102.
Comparison of quartz and K-feldspar minimum age model (MAM) ages from the same samples. The straight line is 1:1 correspondence. Errors are 1σ. PR-1b is not included in the figure because both quartz and feldspar gave very old ages that were off the scale of the figure.

Feathers, Frouin, and Bench (Reference Feathers, Frouin and Bench2022) gave several reasons why the quartz ages are likely wrong. One argument has to do with the nature of the quartz signal. Various tests showed that the OSL signal of these New England samples contained a significant slow bleaching component. Rajapara et alia (Reference Rajapara, Chauhan, Feathers, Garnett, Wasson, Jaiswal and Singhvi2024) have argued that De derived from slower bleaching components can result in age underestimation because of sensitivity changes. Quartz signals were also much weaker than K-feldspar signals. The possibility that the feldspar ages might be overestimated because feldspar is known to bleach slower than quartz was discounted on grounds that the MAM isolated the best bleached grains. The possibility that high fading rates can result in age overestimation was also discounted by showing that the grains with low fading rates also produced older ages. It was concluded that K-feldspar produced the more reliable ages.
Due to low feldspar sensitivity, UW4178 and UW4179 from Blue Mountain only produced quartz ages. Because these two samples came from an area of geology different from that of New England, it cannot be argued that the quartz ages are underestimated for these two samples. Sample UW4179 had a quartz age that was similar to the bulk of feldspar ages from other sites.
Figure 4 shows a radial graph of the feldspar ages. The reference line encompassed by the shaded area is the average age. All ages are consistent with a single average except for three older ones and three younger ones. Two older ages, UW4169 and UW4176, are from chambers in Vermont and Massachusetts. For PR-1a, from Pratt Hill, Massachusetts, the age is only slightly older than the rest. Its analysis was also performed on small aliquots, so there could be some averaging that makes the age slightly older. The other sample from that site, PR-1b, was not included in the graph because its very old age—2400 BC—is considered anomalous. Both samples were collected from dust that was blown into the structure. The older date may reflect an incorrect Dr or deposition during a particularly low-light event, such as at night.
Radial graph showing the K-feldspar ages. The reference is the average age (0.45 ka).

Of the younger samples, UW4103 is the sample with the older quartz age that is consistent with the feldspar age from UW4102; both are from Crown Farm. UW4088 is from the Manitou site in Rhode Island. It was collected only 10 cm from UW4087, which returned an age similar to the others. UW4096 is from the Rocky Hill Road site in Rhode Island. The other two samples from that site were consistent with the main group of samples. Aside from these outlying samples, the others give an average age (using the central age model) with which they are all statistically consistent: 450 ± 20 years ago, or AD 1570 ± 20. This is prior to initial colonial settlement, although after initial European contact.
Feldspar ages were not obtained for most of the USGS samples. However, the quartz ages averaged 490 ± 30 years ago, in agreement with the main body of feldspar ages. This average did not include seven samples (Upton #10; Tolba-3; Tolba-4A; and Neara #28, 87, 66, and 72) because these samples are thought to date the landform on which the structures were built. Except for the Upton samples, which were single grain, these quartz ages were drawn from small aliquots, which could mean they are overestimates.
Equivalent Dose and Age of Rocks
Cores from several rocks showed no increase in De with depth, suggesting no bleaching at the surface. Supplemental Table 1-8 shows cores for which both OSL and IRSL values increased with depth. The De values have been corrected for anomalous fading, so they are presented as ages. De values are shown in the Supplemental Table 3-13 and Feathers, Frouin, and Bench (Reference Feathers, Frouin and Bench2022). Slice number, starting with 1 at the surface, is given as an approximate proxy for depth. Each slice is about 1 mm thick, with variation between and within cores, and width of the saw blade was 0.4 mm.
Several considerations should be noted in evaluating ages. First, several samples are not listed either for OSL or IRSL. The surface slice on these gave a very old age, indicating that the surface was not bleached prior to placement in the structure. Some samples are listed for OSL but not for IRSL, or vice versa. This indicates that one or the other stimulation method produced poor data—or less commonly, that a particular signal was not bleached.
Second, in some cores where there is some bleaching, deeper slices have younger ages than more shallow slices. For example, it is sometimes the case that the second slice has a younger age than the surface slice. This may be a matter of precision but may also be caused by variable light path. Light does not travel along a strictly perpendicular path through a rock (Meyer et al. Reference Meyer, Gliganic, Jain, Sohbati and Schmidmair2018). The path can be rather circuitous in heterogenous rocks due to encounters with areas of differential light attenuation properties. Light may more likely go around mafic minerals than quartzites, for example.
Third, on many samples, there is no age plateau at the shallow depth, as shown in Figure 1. On these, the age for the surface slice is significantly younger than subsequent slices, but it may represent partial bleaching, and the true age of the rock placement is much younger. Figure 5 shows two examples of depth profiles using De—one for a rock with a plateau and one without, or at least poorly defined. The profiles contain results from more than one core. Even though the Bear's Den sample, UW4171, had a poorly defined plateau for both OSL and IRSL, the IRSL age was not significantly different from the OSL age, although it had a much higher error. Because OSL and IRSL bleach at different rates, their agreement in age for the surface slice could mean the surface was well bleached. Supplemental Table 1-9 gives the best estimates for rock ages.
Depth profiles for (top) UW4106 (IRSL), Milford, New Hampshire; and (bottom) UW4171 (OSL), Bear's Den Chamber, Massachusetts.

Four of seven granitic gneiss and schist samples did not produce a date, and one of the ones that did is probably an underestimate. The one metamorphic amphibolite sample was also poorly bleached. Poor bleaching properties seem to characterize these rocks, and they should probably be avoided for future work. Unfortunately, they are common rocks in New England and are often used in stone structures. Four of six granites or granodiorites produced ages. The two that did not were poorly bleached, although it is not clear if this was because the rocks are poorly suited for aging or just not exposed when placed in the structure. All six quartzite or quartz-rich sandstones produced ages. These are probably ideal rocks for age determination.
The age of UW4191 (from Ed Wood Estate) is in the same range as most of the sediment samples. UW4109 (from Deerfield) and UW4078 (from Gungywamp) are younger, but the samples from Oley Hills, Alpenglow, Richard's Chamber, and Twin Columns are older. The two rock ages from Oley Hills are not in agreement, but both are precolonial. The rocks were from different structures, so they could have been built at different times. The rocks from Hunt's Brook Souterrain, West Berlin Wall, and Bear's Den Chamber are also older, but they had poor plateaus, so they may just represent partial bleaching—although as mentioned, this may not be true for Bear's Den. The Council Rocks samples are older, but at least two of them may be partially bleached. Nevertheless, all three date to the later Holocene and their position is not due to earlier glacial retreat.
Discussion
Table 1 is a summary of the most reliable ages for structures using calendar dates, arranged roughly north to south. Samples thought to date underlying landforms are not included, which leaves 43 ages on various anthropogenic features. Are the ages accurate?
If different chronological methods applied at the same site provide the same ages or ages in the right stratigraphic order, confidence in their accuracy is increased. There are two sources of independent ages for the rock structures: historic records and radiocarbon dating methods.
How do the luminescence ages compare with historical facts? The rock sample from Milford, a granite, was the only sample with a known age. The structure from historical records is known to have been built between AD 1740 and 1760. The age of AD 1730 ± 50 (range AD 1680–1780) agrees with this constraint. However, it needs to be said that the fading correction for this IRSL age is rather uncertain, but using a range of possible values for the fading rate yielded ages still within the error terms of the known age (Feathers, Frouin, and Bench Reference Feathers, Frouin and Bench2022).
How do luminescence ages compare with radiocarbon? Radiocarbon is well regarded as a dating method and provides a keystone upon which other chronological techniques are compared. However, many radiocarbon ages obtained for these structures may not date the construction event. Nevertheless, there are some consistencies. The radiocarbon ages are reported uncalibrated (Hoffman Reference Hoffman2018; Whittall Reference Whittall1991). We have calibrated them at 2σ using OxCal, working with IntCal20. Richard's Chamber has a radiocarbon age (cal AD 245–998, p = 0.95) that is within error of the IRSL sediment age (AD 710 ± 300), although both ages have high errors. The radiocarbon age (Whittall Reference Whittall1991:64) was from soil humus (bulk organics) taken from the original surface prior to the deposition of what is believed to be fill from excavation during chamber construction (Whittall Reference Whittall1979). A reasonable argument can be made that the humus age corresponds to when the original soil was buried by chamber fill.
A radiocarbon age of radiocarbon years 470 ± 150 BP (Whittall Reference Whittall1991:63) was obtained from a “hearth” at Calendar I, a chamber located within the same town and of similar architecture as Calendar II. The calibrated range of AD 1255–1688 (p = 0.90) is consistent with the luminescence age of AD 1620 ± 80 obtained at Calendar II.
Two radiocarbon ages from the north part of Gungywamp were obtained from a “hearth” and scattered charcoal, both associated with a collapsed chamber (Whittall Reference Whittall1986:10). The two ages, radiocarbon years 130 ± 75 BP and 580 ± 240 BP, were calibrated to ranges of AD 1661 to the present (p = 0.95) and AD 990 to AD 1710 (p = 0.87). The ranges are extensive because of high errors on the original radiocarbon ages and a relatively flat calibration curve for that period, but the second one is consistent with the luminescence age of AD 1490 obtained nearby. A third age of radiocarbon years 1495 ± 175 BP (Whittall Reference Whittall1991:63) from another part of the site calibrates to AD 202–895 (p = 0.94), inconsistent with any luminescence ages.
There are a few radiocarbon ages from American Stonehenge, none of which directly relate to the luminescence ages. Gage (Reference Gage2021) has published a comprehensive study of the architecture at the site. She has arranged the various structures in chronological order based mainly on architectural patterns and other stylistic features, anchoring the sequence with a few radiocarbon ages. She suggests that the wall dated by UW4101 was one of the last additions to the site, and that UW4098 was collected from sediment on top of a large chamber called the Oracle Chamber and is therefore younger. Two rocks were collected from within this chamber, but unfortunately neither could be dated. Consequently, the luminescence ages do not address older parts of the structure. The oldest radiocarbon assays related to any structure are two processed on charcoal on the exterior of a wall of the Collapsed Chamber. The uncalibrated ages of radiocarbon years 3475 ± 210 BP and 2995 ± 180 BP (Whittall Reference Whittall1991:63–64) are out of stratigraphic order, which Gage (Reference Gage2021) uses to suggest that the sediment was backfill from construction, but the calibrated ranges, 2409–1381 cal BP (p = 0.94) and 1616–811 cal BP (p = 0.95), overlap. Whether the sediment represents backfill or not, the charcoal could have come from anywhere, so the ages do not relate to the building. Another old age, radiocarbon years 2120 ± 95 BP (cal 389 BC to AD 75, p = 0.95), was obtained from charcoal from fill of a quartz quarry scar (Whittall Reference Whittall1991:64). Although quartz rocks were used in structures at the site, this age does not relate to any structure; again, the charcoal could have come from anywhere. The Oracle Chamber was radiocarbon dated on charcoal from fill of a rock-lined drainage ditch that proceeded the construction of the chamber. The age of radiocarbon years 1430 ± 135 BP (Whittall Reference Whittall1977:18) calibrates to AD 342 to 892 (p = 0.95); again, the origin of the charcoal is uncertain. A better argument for the antiquity of the chamber is the luminescence ages from other chambers in the area (Richards, Twin Columns, and maybe Bear's Den). The luminescence date from Richard's Chambers falls in the Oracle Chamber radiocarbon range.
How internally consistent are the luminescence ages? Another argument for the sediment ages being accurate is the fact that most of them are statistically the same age. American Stonehenge, Calendars II, Goshen, Upton, Pratt Hill, Tolba Lewis Hollow, Manitou Hassannash, Ed Wood Estate, Rocky Hill Road, Crown Farm, Hopkinson Madison Lithic, Gungywamp, Hunt's Brook Souterrain, and West Berlin Wall all have estimated ages in the AD 1390 to AD 1670 range. Given the uncertainties around external Dr, fading corrections and turbation processes, it would be highly unlikely that these ages would all be similar unless they really were similar (Feathers, Frouin, and Bench Reference Feathers, Frouin and Bench2022). Additionally, at sites where more than one sample was dated, the ages are in reasonable agreement with each other. For American Stonehenge, Crown Farm, and Madison Lithic, the ages are within 1σ of each other. For Manitou Hassannash and Gungywamp, two of three ages agree at 1σ. The two in agreement at Gungywamp are from the same part of the site.
Why were these structures built around the same time? Feathers, Frouin, and Bench (Reference Feathers, Frouin and Bench2022) speculated that they could be an Indigenous response to disruptions caused by initial European contact. The mechanism for this is not clear, but modern Native Americans do consider the sites to be sacred. Whatever the explanation, there are also older ages that require a different explanation. The early ages at three different chambers—Richards, Twin Columns, and maybe Bear's Den—the wall at Alpenglow, and the structures at Oley Hills provide evidence of a longer chronology for this technology. Are they precursors to later constructions, or are they completely unrelated? The old ages for the Council Rocks boulders show that the rocks have moved since the last glaciation. Whether humans moved them requires elimination of other possible causes.
Conclusion
Laurie Rush, a cultural resource manager from New York, thinks many professional archaeologists have been remiss in not applying “robust scientific methodology” to the stone features found throughout the Northeast and have too easily accepted the dogma that the structures are colonial in origin (Rush Reference Rush, Lavin and Thomas2023). However accurate this assessment, we hope this article offers a correction. We have applied scientific chronological methods to determine the construction age of several of these features. We have found that many are precolonial, although most that we tested are not pre-European contact and date between that first contact and European settlement. Nevertheless, ages of some structures—some chambers in northern New England and other structures in Pennsylvania—indicate precontact by a considerable amount of time. Our hope is that archaeologists will build on our work and begin to understand these enigmatic features.
Acknowledgments
Members of New England Antiquities Research Association and the Narragansett Indian Tribal Historic Preservation Trust assisted in the fieldwork. The work benefited from reviewers, including Jake Holland-Lulewicz (Penn State) and Harrison Gray (USGS). Any use of trade, firm, or product names is for descriptive purposes only and does not imply endorsement by the US government. No permits were required for sampling.
Funding Statement
This work was funded by the New England Antiquities Research Association and the United States Geological Survey.
Data Availability Statement
Luminescence data are available from the authors on request.
Competing Interests
The authors declare no conflict of interest.
Supplemental Material
For supplemental material accompanying this article, visit www.journals.cambridge.org/[Journal].
Supplemental Text 1. Tables and figures relevant to the main text.
Supplemental Text 2. Principles of luminescence.
Supplemental Text 3. Technical data for UW samples not included in Feathers, Frouin, and Bench (Reference Feathers, Frouin and Bench2022) and Feathers and Muller (Reference Feathers and Muller2020).
Supplemental Text 4. Technical data for USGS samples not included in Mahan et alia (Reference Mahan, Martin and Taylor2015) and Mahan (Reference Mahan2021).
Supplemental Figure 1-1. Map showing counties where samples were collected.
Supplemental Table 1-1. Samples collected by University of Washington (UW).
Supplemental Table 1-2. Samples collected by United States Geological Survey (USGS).
Supplemental Table 1-3. Dose rates for UW samples.
Supplemental Table 1-4. Dose rates for USGS samples.
Supplemental Table 1-5. Acceptance rates for quartz and feldspars.
Supplemental Table 1-6. Equivalent dose and age for quartz samples.
Supplemental Table 1-7. Equivalent dose and age for feldspar samples.
Supplemental Table 1-8. Age as function of depth for rocks.
Supplemental Table 1-9. Rock ages.
Supplemental Table 2-1. SAR protocol.
Supplemental Table 3-5. UW acceptance rates for quartz.
Supplemental Table 3-6. UW acceptance rates for feldspars.
Supplemental Table 3-13. UW equivalent dose for rock slices.