Implications
The effect of production potential or physiological status of dairy cattle is not always adequately described in applied models for nutrient requirements and feeding management. Accordingly, we developed a model of homeorhetic regulation, technically complementary to current feed unit systems that generate dietary net energy content. The model was calibrated based on two large data sets characterized by groups of animals under the same ration but expressing large differences in production potential and breed. The model is not sensitive to nutrition but it provides a robust basis for future incorporation of performance responses to dietary changes because it simulates the baselines against which to predict the environmentally driven responses.
Introduction
Prediction of dairy cow performance requires the quantification of two main regulation. The first is the effect of nutrition, that is the animal responses to dietary changes. The second is the effect of homeorhesis, as described in Bauman and Currie (Reference Bauman and Currie1980), that is the driving forces that alter nutrient partitioning as the physiological state of the animal changes through lactation. Without some quantification of homeorhetic regulation through time, it is difficult to include in simulations the effects of milk production potential, parity, days in milk and days in pregnancy on nutrient partitioning. Therefore, this type of regulation has been the subject of numerous modeling approaches, in particular to describe whole lactation curve of milk yield (Wood, Reference Wood1967; Neal and Thornley, Reference Neal and Thornley1983; Emmans and Fisher, Reference Emmans and Fisher1986; Dijkstra et al., Reference Dijkstra, France, Dhanoa, Maas, Hanigan, Rook and Beever1997). All these models, either implicitly or explicitly relate to potential production, that is the performance the cow would achieve if it were not limited by diet or environment. As predicted potential milk yield is useful to design rations that can capitalize on the genetic ability of the cow, feed unit systems have also proposed their own equations (National Research Council (NRC), 2001; Faverdin et al., Reference Faverdin, Delagarde, Delaby and Meschy2010; Volden, Reference Volden2011). The large contribution of body energy reserve in early lactation to sustain milk production has also stimulated the development of model that predict genetically driven body energy change (Friggens et al., Reference Friggens, Ingvartsen and Emmans2004). Consideration of such homeorhetic trajectories can substantially improve the prediction of the cow’s energy requirements. Therefore driving forces that alter milk production and body composition change as the physiological state of the animal changes have been included in various dynamic animal research models (Baldwin et al., Reference Baldwin, France, Beever, Gill and Thornley1987; Danfaer, Reference Danfaer1990; Martin and Sauvant, Reference Martin and Sauvant2007; Martin and Sauvant, Reference Martin and Sauvant2010). Similarly, dynamic models developed to predict dairy cow performance under practical conditions (Baudracco et al., Reference Baudracco, Lopez-Villalobos, Holmes, Comeron, Macdonald, Barry and Friggens2012; Jacquot et al., Reference Jacquot, Delaby, Pomiés, Brunschwig and Baumont R2015; Johnson et al., Reference Johnson, France and Cullen2016; Ruelle et al., Reference Ruelle, Delaby, Wallace and Shalloo2016) have also explicitly integrated homeorhetic trajectories for milk yield and body condition score (BCS). However, homeorhetic curves of milk component yields for lactose, fat and protein is not always represented in those models.
The aims of the current paper are: (1) to develop a model of homeorhetic regulation in order to simulate curves of milk component yields (lactose, fat and protein), milk yield, body composition changes and dry-matter intake (DMI) relative to days in milk for different parities. (2) To calibrate the model within-breed across milk production potentials using a large data set of Holstein cows. (3) To evaluate the model and calibrate it for breed differences (Danish Red, Holstein and Holstein) using another large data set. Given the objective of this study to describe homeorhetic changes, data sets were chosen to minimize the interference of nutrition on the lactation curves simulated by the model. As such this paper do not deal with effects of nutrition on dairy cows performance.
Model description
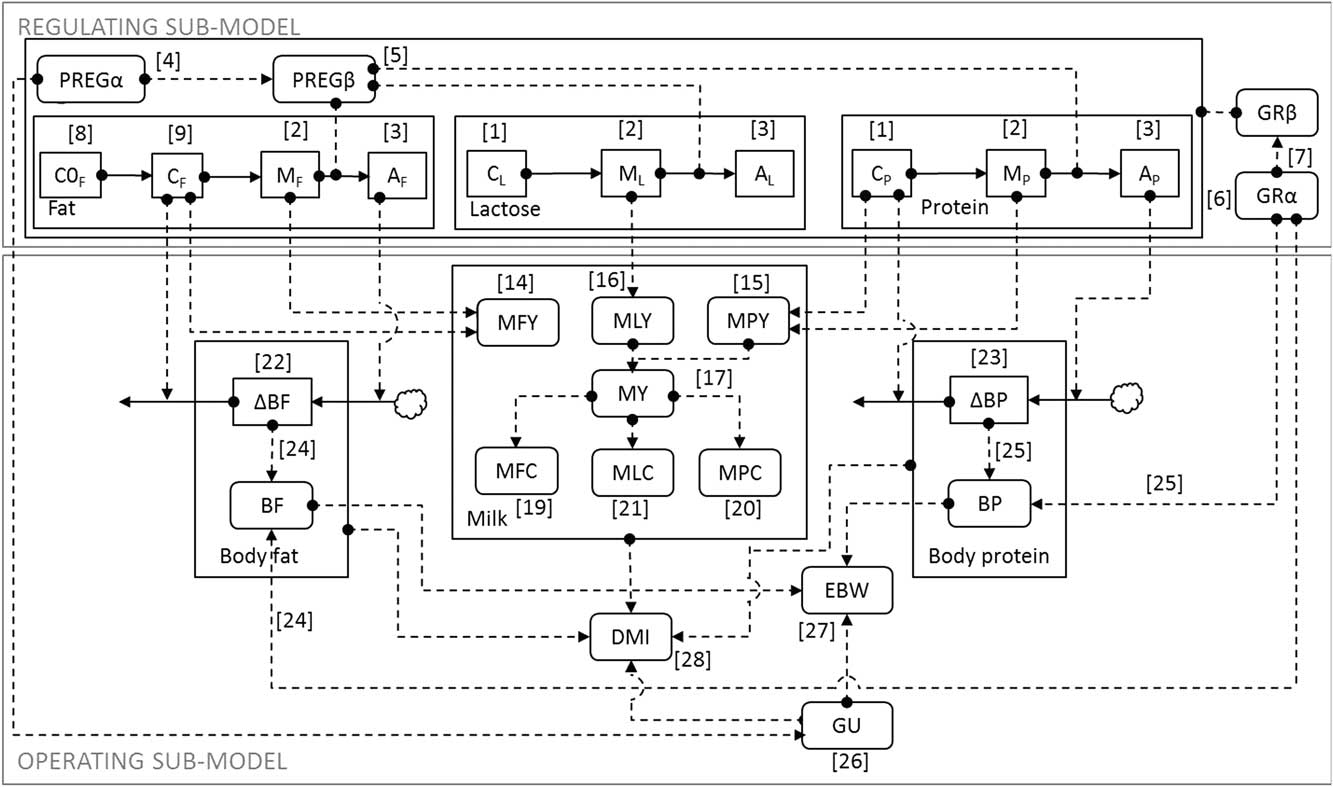
The structure of the model is characterized by two sub-models, a regulating sub-model of homeorhetic control, which sets dynamic partitioning rules along the lactation, and an operating sub-model that describes animal performance and major underlying nutrients flows (Figure 1). This approach was proposed by Sauvant (Reference Sauvant1994) and has been previously used in a dairy goat model (Puillet et al., Reference Puillet, Martin, Tichit and Sauvant2008), and in a dairy cow model of lifetime partitioning (Martin and Sauvant, Reference Martin and Sauvant2010). The final equations used in the model are listed in Supplementary Material S1.
Model diagram of the regulating and operating sub-models. Solid arrows indicate fluxes and stippled arrows indicate information. Rounded rectangles indicate model variables and rectangle indicate model state variables. C0F=Fictitious dynamic priority (detailed in Supplementary Material S2); C, M and A=catabolism, milk and anabolism relative priorities for fat, lactose and protein (subscript F, L and P, respectively); PREG(α,β)=pregnancy functions; GR(α,β)=growth functions; MFY=milk fat yield; MLY=milk lactose yield; MPY=milk protein yield; MY=milk yield; MFC=milk fat content; MLC=milk lactose content; MPC=milk protein content; GU=Gravid uterus; EBW=empty BW; BP=body protein; BF=body fat; ΔBP and ΔBF=change in BP and BF induced by lactation and pregnancy; DMI=dry-matter intake. Equations are presented in the text.

Description of the regulating sub-model
Rationale
The regulating sub-model represents the driving forces that alter nutrient partitioning as the physiological state of the animal changes through lactation. It pilots the operating sub-model with respect to allocation of resources for growth, gestation, milk and body reserves. The two major physiological processes that occur during the productive life of a dairy cows are pregnancy and lactation. Therefore, the basis behind those coordinated physiological changes is the cycle of shift in reproductive priorities, between the current and future offspring, respectively, lactation and pregnancy (Friggens, Reference Friggens2003). To ensure the survival of the new-born calf, a large part of body energy is genetically mobilized in early lactation (Friggens et al., Reference Friggens, Ingvartsen and Emmans2004). Therefore the priority for the current offspring can be split into a priority to mobilize body reserves (called C, as in catabolism) and a priority to acquire new resources to sustain the growth of the calf (called M, as in milk). The priority for the future offspring (body reserve) is to acquire new resources to safeguard the reproductive investment and therefore replenish body reserves (called A, as in anabolism). Successive changes of priorities are described by the following differential equations, which follow a simple mass action law, applied to theoretical state variables, representing priorities C, M and A:
 $${{dC} \over {dt}}\left( {{\rm /day}} \right)\,{\equals}\,{\minus}{\rm kCM}{\times}C,\,{\rm with}\,C{\rm \,{\equals}\,1}\,{\minus}\,{\rm Mt0}\,{\rm at}\,t{\rm \,{\equals}\,0}$$
 $$\eqalignno{ &{{dM} \over {dt}}\left( {{\rm /day}} \right){\equals}\left( {{\rm kCM}{\times}{\rm }C} \right)\,{\minus}\,\left( {{\rm kMA}{\times}M} \right),\,\cr &\qquad {\rm with}\,M{\rm \,{\equals}\,Mt0}\,\,{\rm at}\,\, t{\rm \,{\equals}\,0}$$
 $${{dA} \over {dt}}\left( {{\rm /day}} \right)\,{\equals}\,{\rm kMA}{\times}M,\,{\rm with}\,A{\rm \,{\equals}\,0}\,{\rm at}\,t{\rm \,{\equals}\,0}$$
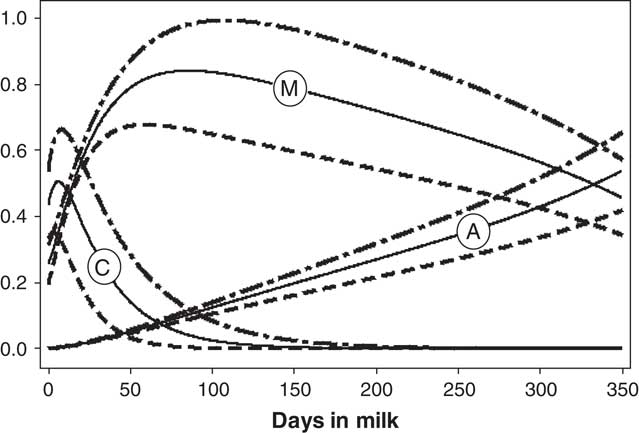
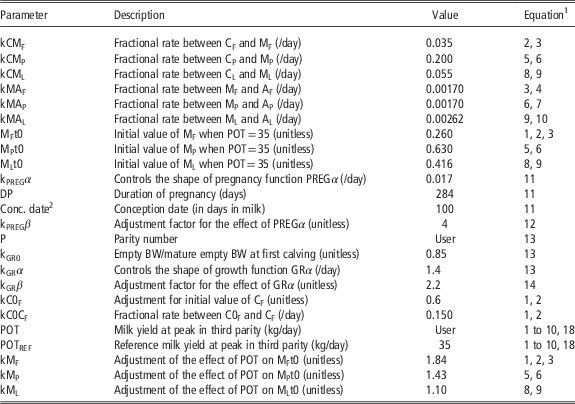
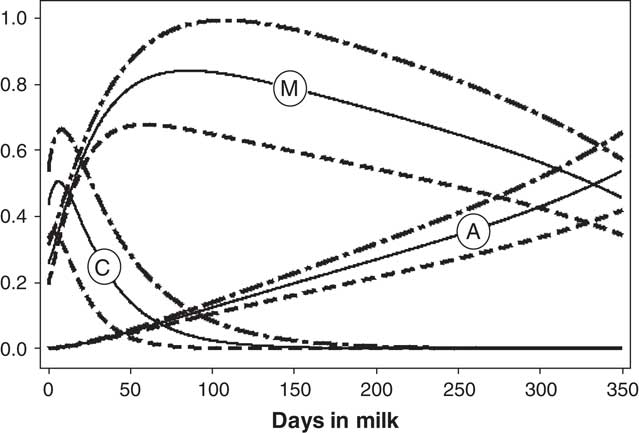
Where parameters kCM and kMA control the kinetics of the shift between C, M and A, and Mt0 control the initial compartment size of C and M. All definitions and values of the parameters of the regulating sub-model are presented in Table 1. Figure 2 shows the kinetics of C, M and A (applied to fat, see later in the text). The exponential decay in time of C is consistent with principles applied in the mammary gland model of Neal and Thornley (Reference Neal and Thornley1983). Beyond the inherent recognition of two successive reproductive priorities, this model structure also introduces a substitution between mobilization (C) and feed intake (M and A). However, as mobilization and intake occur simultaneously from the 1st day of lactation, initial values of priority C and M are set, respectively, to (1−Mt0) and Mt0. The priority for the future offspring is assumed to be null at onset of the lactation. So, the initial value of A is 0. Therefore, as modeled previously (Baldwin et al., Reference Baldwin, France, Beever, Gill and Thornley1987; Martin and Sauvant, Reference Martin and Sauvant2007) there is a clear substitution between trajectories of catabolism and anabolism (Figure 2). For completeness, these driving forces are also modulated by pregnancy and growth (see Supplementary Material S2).
Dynamic of CF, MF and AF from the regulating sub-model of fat relative to dry-matter intake for a third lactation dairy cow with a conception date at 100 days in milk. Effect of potential parameter (POT) is shown for levels 20 (even stippled line), 35 (solid line) and 50 kg/day (uneven stippled line). See Table 1 for parameters.
Parameters of the regulating sub-models for fat, protein and lactose describing the dynamics of relative priorities C, M and A

1 Equation numbers are from Supplementary Material S1.
2 Conc. date triggers DIP.
Dissociation between secretion of fat, protein and lactose
For a long time, ratios between lactose, protein and fat have been known to change with days from calving. However, this outcome is difficult to achieve when regulation of fat, protein and lactose secretion is solely controlled by the same regulating sub-model (milk). To simulate milk composition, it was therefore decided to have three regulating sub-models: one for fat, one for protein and one for lactose based on the model structure described above with a minor modification (see Supplementary Material S2). In this way, different patterns of priority through time for C, M and A can be created for each nutrient using the same basic principle described above but with different values of parameters kCM, kMA and Mt0. Parameters for the regulating sub-models of fat, protein and lactose can be found in Table 1. A greater value of parameter kCMP relative to kCMF indicates a shorter protein mobilization phase as compared with the fat mobilization phase. Persistencies of fat and protein secretion, indicated by values of kMAF and kMAP, were assumed to be identical in the model but higher than lactose secretion persistency.
With the above elements, the regulating sub-model described above is sufficient to simulate dynamic priorities required to generate the lactation performance of an average dairy cow.
Effect of production potential
Within a given favorable environment, where dairy cows are fed an identical ration, individual cows typically have different levels of production. One key objective of the model was to accurately simulate those differences in performances (milk yield and composition, empty BW, DMI) between animals that differ in potential (POT). With that objective, a single parameter POT was introduced in the regulating sub-model. As there is a regulating sub-model for each milk component, there are associated conversion factors to scale the overall POT to the different milk components (see Supplementary Material S2). For calibration purposes, POT was defined as the observed milk yield at peak of lactation for third parity cows (=mature cows) in a favorable environment. In the model, POT was included so that it does not affect performance of the average animal, arbitrarily set at 35 kg of milk at peak. Therefore the ratio POT/POTREF was used, with POTREF=35 as detailed in Supplementary Material S2.
Description of the operating sub-model
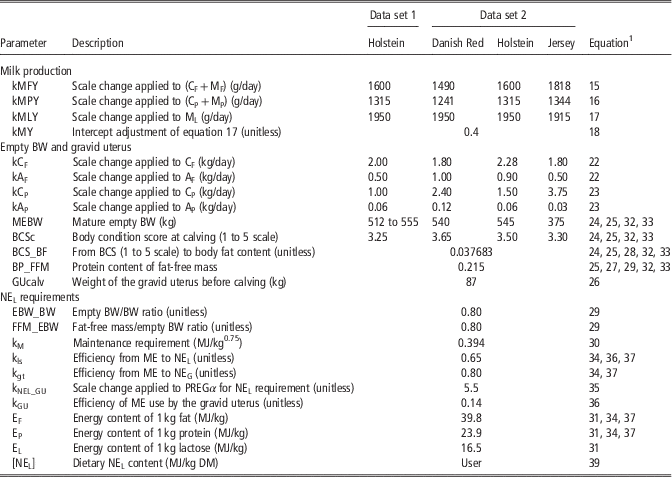
The operating sub-model describes performance of the dairy cow in term of body composition as well as milk yield and composition (Figure 1). This sub-model also describes the fluxes of net energy (NEL) associated with performance, growth, pregnancy and maintenance. Finally a description of how DMI is estimated as an output of the model is provided. All parameters of the operating sub-model are presented in Table 2.
Parameters of the operating sub-model

ME=metabolizable energy; NEL=net energy for lactation; NEG=net energy for body gain.
1 Equation numbers are from Supplementary Material S1.
Milk yield and composition
To construct curves of milk fat yield (MFY, g/day) and milk protein yield (MPY, g/day), qsimple scaling parameters kMFY and kMPY are used to convert kinetics of C and M, generated by the regulating sub-models of fat and protein, into grams of fat and protein (equations 15 to 16 in Supplementary Material S1). As no storage of glucose was considered in the model, milk lactose yield (MLY, g/day) is simply predicted from the dynamic priority ML and a scaling parameter kMLY (equation 17 in Supplementary Material S1). An empirical equation was developed from a large database of the literature (Daniel et al., Reference Daniel, Friggens, Chapoutot, Van Laar and Sauvant2016) to predict milk yield (MY, kg/day) from milk component yields. Based on 787 treatments means (179 experiments), the following within-experiment relationship (i.e. adjusting for differences between laboratories in milk analyses) was obtained, with a RMSE of 0.24 kg/day:
 $$\eqalignno{{ \hskip 1pt \rm MY}\left( {{\rm kg/day}} \right){\rm \,{\equals}&\,a{\plus}0}{\rm .0173}\left( {\pm{\rm 0}{\rm .0002}} \right)\cr & \hskip -100pt \qquad {\rm {\times}MLY{\plus}0}{\rm .0043}\left({\!\pm{\rm 0}{\rm .0004}} \right){\rm {\times}MPY}{\rm .}$$
The intercept of the equation was significantly different from 0 (mean±SE, 1.26±0.15), which could reflect the effect of mineral contents on the osmotic pressure of milk. It can be noted that the effect of MFY was largely insignificant and was consequently removed from the equation. The coefficients 0.0173 and 0.0043 indicate that for 1 kg of lactose, 17.3 kg of milk are secreted and for 1 kg of protein, 4.3 kg of milk are secreted, highlighting the importance of lactose in milk secretion. In the model, an intercept a was used to reflect observed decrease in milk lactose content with milk production potential (equation 18 in Supplementary Material S1). Milk composition was simply predicted as the ratio between secretion of fat, protein and lactose and milk yield (equation 19 to 21 in Supplementary Material S1).
Empty BW and composition
Changes of body fat and body protein during lactation were predicted from kinetics controlled by regulating sub-models of fat (AF and CF) and protein (AP and CP) with the following differential equations:
 $${{d{\rm \Delta BF}} \over {dt}}\left( {{\rm kg/day}} \right){\rm \,{\equals}}\,\left( {\left( {A_{{\rm F}} {\times}{\rm GR}\beta } \right){\times}{\rm kA}_{{\rm F}} } \right)\,{\rm -}\,\left( {\left( {C_{{\rm F}} {\times}{\rm GR}\beta } \right){\times}{\rm kC}_{{\rm F}} } \right){\rm ,}$$
 $${{d{\rm \Delta BP}} \over {dt}}\left( {{\rm kg/day}} \right){\rm \,{\equals}}\,\left( {\left( {A_{{\rm P}} {\times}{\rm GR}\beta } \right){\times}{\rm kA}_{{\rm P}} } \right)\,{\rm -}\,\left( {\left( {C_{{\rm P}} {\times}{\rm GR}\beta } \right){\times}{\rm kC}_{{\rm P}} } \right).$$
The parameters kAF, kCF, kAP and kCP are used to convert kinetics A and C (adjusted for the effect of growth) into kilograms of fat/protein being deposited/mobilized. A first set of values for these parameters were obtained based on measured body fat and protein changes from literature (see Supplementary Material S3). These values were then adjusted by calibration against the changes in empty BW observed in data set 1 (Table 2). To construct curves of total body fat (BF) and total body protein (BP), start of lactation values of BF and BP are required. This is done using two input parameters: Mature empty BW (MEBW, kg), assumed to be reached in third parity, and BCS at calving under favorable conditions, that is reflecting the animals genetically determined level of fatness (BCSc, 1 to 5 scale). Body fat is calculated as:
 $$\eqalignno{ &{\rm BF}\left( {{\rm kg}} \right){\rm \,{\equals}\,0}{\rm .037683}{\times}\left( {{{\left( {{\rm BCSc - 0}{\rm .5}} \right){\times}{\rm 8}} \over 4}} \right){\times}{\rm MEBW}\cr &\qquad \qquad {\times}\left( {{\rm 1-GR}\alpha } \right){\rm {\plus}\Delta BF,}$$
where 0.037683 is the coefficient from the relationship established in NRC (2001) between body fat content and BCS. The calculation ((BCSc−0.5)×8/4) is used to convert the 1 to 5 BCS scale into 1 to 9 BCS scale (originally used by the NRC to establish the previous relationship). A small comparison with other equations from literature is given in Supplementary Material S3. The function (1-GRα) represents the degree of maturity of the animal (see description of the regulating sub-model in Supplementary Material S2) and is used to multiply MEBW. When the animal is mature, GRα=0 and MEBW is unaffected. Body protein is then calculated from the fat-free mass (empty BW−BF) assuming a protein content of this fraction of 21.5% (NRC, 2001):
 $$\eqalignno{ &{\rm BP}\left( {{\rm kg}} \right){\rm \,{\equals}}\,{\bigg ( } \left {{\left ( {{\rm MEBW{\times}}\left( {{\rm 1}\,{\minus}\,{\rm GR}\alpha } \right)} \right)\,{\rm -\,0}{\rm .037683 }}}\right \right \cr & \qquad \qquad \left {{\times}}\left( {{{\left( {{\rm BCSc - 0}{\rm .5}} \right){\rm {\times}8}} \over {\rm 4}}} \right){\rm {\times}MEBW{\times}}\left( {{\rm 1}{\minus}{\rm GR\alpha }} \right) \right{\bigg ) } \cr &\qquad \qquad {\rm {\times}0}{\rm .215{\plus}\Delta BP,}$$
Assuming that the water fraction of body fat is negligible, empty BW can be calculated as:
 $${\rm Empty}\,{\rm BW}\left( {{\rm kg}} \right){\rm \,{\equals}\,BF{\plus}}{{{\rm BP}} \over {{\rm 0}{\rm .215}}}{\rm {\plus}GU,}$$
where GU is the weight of the gravid uterus (see Supplementary Material S2). Finally, BCS can be calculated according to NRC (2001) with:
 $${\rm BCS}\,\left( {{\rm 1\,\, to\,\, 5 \,\, scale}} \right){\rm \,{\equals}}\,\left( {\left( {{{\left( {{{{\rm BF}} \over {{\rm Empty}\,{\rm BW}}}} \right)} \over {{\rm 0}{\rm .037683}}}} \right){\times}{4 \over 8}} \right){\rm {\plus}0}{\rm .5}{\rm .}$$
Scaling parameters between breeds
The parameter POT was calibrated on a Holstein data set to simulate differences in performance between low and high producing cows within this breed. As such, POT does not permit simulation of different milk composition for animals that produce the same amount of milk from, for example, different breeds. To achieve this, scaling parameters for milk composition traits (kMFY, kMPY, kMLY) and body composition traits (kCF, kAF, kCP and kAP) were adjusted depending on the type of animals (as detailed in Supplementary Material S4).
NEL requirements and dry-matter intake
To calculate NEL maintenance requirements, a BW standardized for lipid content and gut fill proportion was calculated as:
 $${\rm BWstd}\,\left( {{\rm kg}} \right){\rm \,{\equals}}\,{{\left( {{{{\rm BP}} \over {{\rm 0}{\rm .215}}}} \right)} \over {{\rm 0}{\rm .8{\times}0}{\rm .8}}}{\rm ,}$$
This assumes that maintenance requirements for NEL are not influenced by body fat change but only by body protein change (Birnie et al., Reference Birnie, Agnew and Gordon2000). The parameters used to calculate BWstd were derived from experiments with measured body composition (see Supplementary Material S3) in which the average empty BW/BW ratio was 0.80 (n=60, SE 0.04), that is gut fill represented 0.25×empty BW, and average fat-free mass/empty BW ratio was 0.80 (n=69, SE 0.05), that is lipid content was 0.20×empty BW. The NEL requirement for maintenance was assumed to be:
 $$\eqalignno{ & {\rm NE}_{{\rm L}} \,{\rm maintenance}\,\left( {{\rm MJ/day}} \right)\cr & {\rm \qquad \,{\equals}\,0}{\rm .394}{\times}{\rm BWstd}^{{{\rm 0}{\rm .75}}} \,{\rm (Sauvant}\,et\,al{\rm .},\,2015).$$
The NEL requirement for milk was simply the sum of energy from fat, protein and lactose secreted in the milk:
 $$\eqalignno{ {\rm NE}_{{\rm L}} \,{\rm milk}\left( {{\rm MJ/day}} \right)&{\rm \,{\equals}\,39}{\rm .8}{\times}{{{\rm MFY}} \over {{\rm 1000}}}{\rm {\plus}23}{\rm .9}\cr &\quad {\times}{{{\rm MPY}} \over {{\rm 1000}}}{\rm {\plus}16}{\rm .5}{\times}{{{\rm MLY}} \over {{\rm 1000}}}{\rm ,}$$
Growth requirement in NEL was:
 $$\eqalignno{ &{\rm NE}_{{\rm L}} \,{\rm growth}\,\left( {{\rm MJ/day}} \right)\cr &\qquad {\rm {\equals}}{{\left( {\left( {{\rm BP}\,{\rm growth{\times}23}{\rm .9}} \right){\rm {\plus}}\left( {{\rm BF}\,{\rm growth{\times}39}{\rm .8}} \right)} \right)} \over {{\rm k}_{{{\rm gt}}} {\rm {\times} k}_{{{\rm ls}}} }}{\rm ,}$$
with kgt, the efficiency of conversion from ME to NEG and kls, the conversion of ME to NEL (Sauvant et al., Reference Sauvant, Ortigues-Marty, Giger-Reverdin and Nozière2015; Table 2). Growth rates for BP and BF are, respectively, derived from equations 32 and 33 in Supplementary Material S1. The calculated NEL requirement for growth was in agreement with other feed unit systems (Agricultural and Food Research Council, 1993; NRC, 2001). For pregnancy the net energy content of the gravid uterus (NEGU) was first calculated as:
 $${\rm NE}_{{{\rm GU}}} \,{\rm preg}\,\left( {{\rm MJ/day}} \right)\,{\rm \,{\equals}\,k}_{{{\rm NEL\_GU}}} {\times}{\rm PREG}\alpha {\rm ,}$$
where kNEL_GU corresponds to the maximum value of NEGUpreg reached at the last day of the pregnancy. This value was chosen so that NEGUpreg is consistent with the data from Bell et al. (Reference Bell, Slepetis and Ehrhardt1995). The pregnancy requirement in NEL was then calculated assuming an efficiency of ME use by the gravid uterus, kGU, of 0.14 (Ferrell et al., Reference Ferrell, Garrett, Hinman and Grichting1976):
 $${\rm NE}_{{\rm L}} \,{\rm preg}\left( {{\rm MJ/day}} \right){\rm \,{\equals}}\,\left( {{{{\rm NE}_{{{\rm GU}}} {\rm preg}} \over {{\rm k}_{{{\rm GU}}} }}} \right){\rm {\times}k}_{{{\rm ls}}} {\rm ,}$$
The resulting shape of the exponential function for pregnancy NEL requirement was in agreement with INRA (Faverdin et al., Reference Faverdin, Delagarde, Delaby and Meschy2010) and NorFor (Volden, Reference Volden2011) feed unit systems. Additionally this model simulates an average of NELpreg of 12.4 MJ/day during the last 100 days of gestation. This value was consistent with average prediction (13.0 MJ/day) of the NRC (2001), which only considered NELpreg after 190 days of gestation with a linear increase. Requirements for energy balance (positive for anabolism, negative for catabolism) are calculated based on body fat and protein changes with corresponding efficiencies:
 $${\rm NE}_{{\rm L}} \,{\rm body}\left( {{\rm MJ/day}} \right){\rm \,{\equals}}\,{{\left( {{{d{\rm \Delta BF}} \over {dt}}{\rm {\times}39}{\rm .8{\plus}}{{d{\rm \Delta BP}} \over {dt}}{\rm {\times}23}{\rm .9}} \right)} \over {{\rm k}_{{{\rm gt}}} {\rm {\times} k}_{{{\rm ls}}} }}{\rm ,}$$
Adding these factors together we can predict all NEL requirements (maintenance, milk, growth, pregnancy and body mass change). Thus providing that dietary NEL content is known, desired DMI, can be estimated as follows:
 $${\rm DMI}\,\left( {{\rm kg/day}} \right){\rm \,{\equals}}\,{{{\rm Total\,\, NE}_{{\rm L}}\,\, {\rm requirement}} \over {{\rm Dietary \,\,NE}_{{\rm L}}\,\, {\rm content}}},$$
with dietary NEL content in MJ/kg DM.
Data used for model calibration and testing
For the purpose of the calibration, two data sets were selected. They both respect the important criterion that within each data set the ration fed was identical for all animals. Therefore, differences in production between animals from the same data set are largely unaffected by the diet offered and therefore should reflect differences in potential. In the first data set (called data set 1), weekly data of milk component yields and BW of Holstein cows from the experimental dairy farm of Trouw Nutrition R&D (Kempenshof, Boxmeer, the Netherlands) recorded between 2003 and 2012 were used. All animals were fed forages separately, mainly a mixture of maize and grass silages, ad libitum in roughage boxes and concentrates in concentrate feeders (calculated nutritional values of the diet presented in Supplementary Material S5). The provision of concentrate was determined individually based on observed milk yield and adjusted weekly to match NEL and MP requirements. Consequently the amount of concentrate fed follows the lactation curve. This data set was used to calibrate all model parameters. In data set 2, weekly average milk component yields, empty BW and BCS data of three dairy breeds (Danish Red, Holstein and Jersey) were used. Data originated from an experiment conducted at Aarhus University (Denmark). A detailed description of this experiment can be found in Nielsen et al. (Reference Nielsen, Friggens, Lovendahl, Jensen and Ingvartsen2003). For the purpose of the present study, only cows receiving the normal energy density diet (6.64 MJ/kg DM) were used (calculated nutritional values of the diet presented in Supplementary Material S5). The particularity is that these cows were fed the same TMR ad libitum during the whole lactation. Data set 2 was used for evaluation of the model (previously parameterized using data set 1), and a subset (parity 2) was also used to derive the seven breed scaling parameters, that is adjust the relative secretion of milk components (kMFY, kMPY, kMLY) and changes in body composition (kCF, kAF, kCP and kAP) according to breed.
The ability of the model to fit the observed data was evaluated using the concordance correlation coefficient (CCC), calculated as described in Lin (Reference Lin1989), and the root mean square prediction error (RMSPE), computed as previously described (Bibby and Toutenburg, Reference Bibby and Toutenburg1977). The RMSPE can be decomposed into error due to overall bias, error due to deviation of the regression slope from unity and error due to the disturbance (random error; Bibby and Toutenburg, Reference Bibby and Toutenburg1977). Model was evaluated against weekly average data for each subset created (seven from data set 1 and six from data set 2). Description of the subsets is given in Supplementary Material S5.
Model implementation
The model was implemented with the Modelmaker 3.0 software (Cherwell Scientific Ltd, 2000) using the Runge–Kutta four numerical integration procedure and a fixed integration step of 1 day for t ranging from 0 to 350 days. For clarity, a summary of model calibration is given in Supplementary Material S4. The model was also tested for identifiability (Supplementary Material S4).
Results
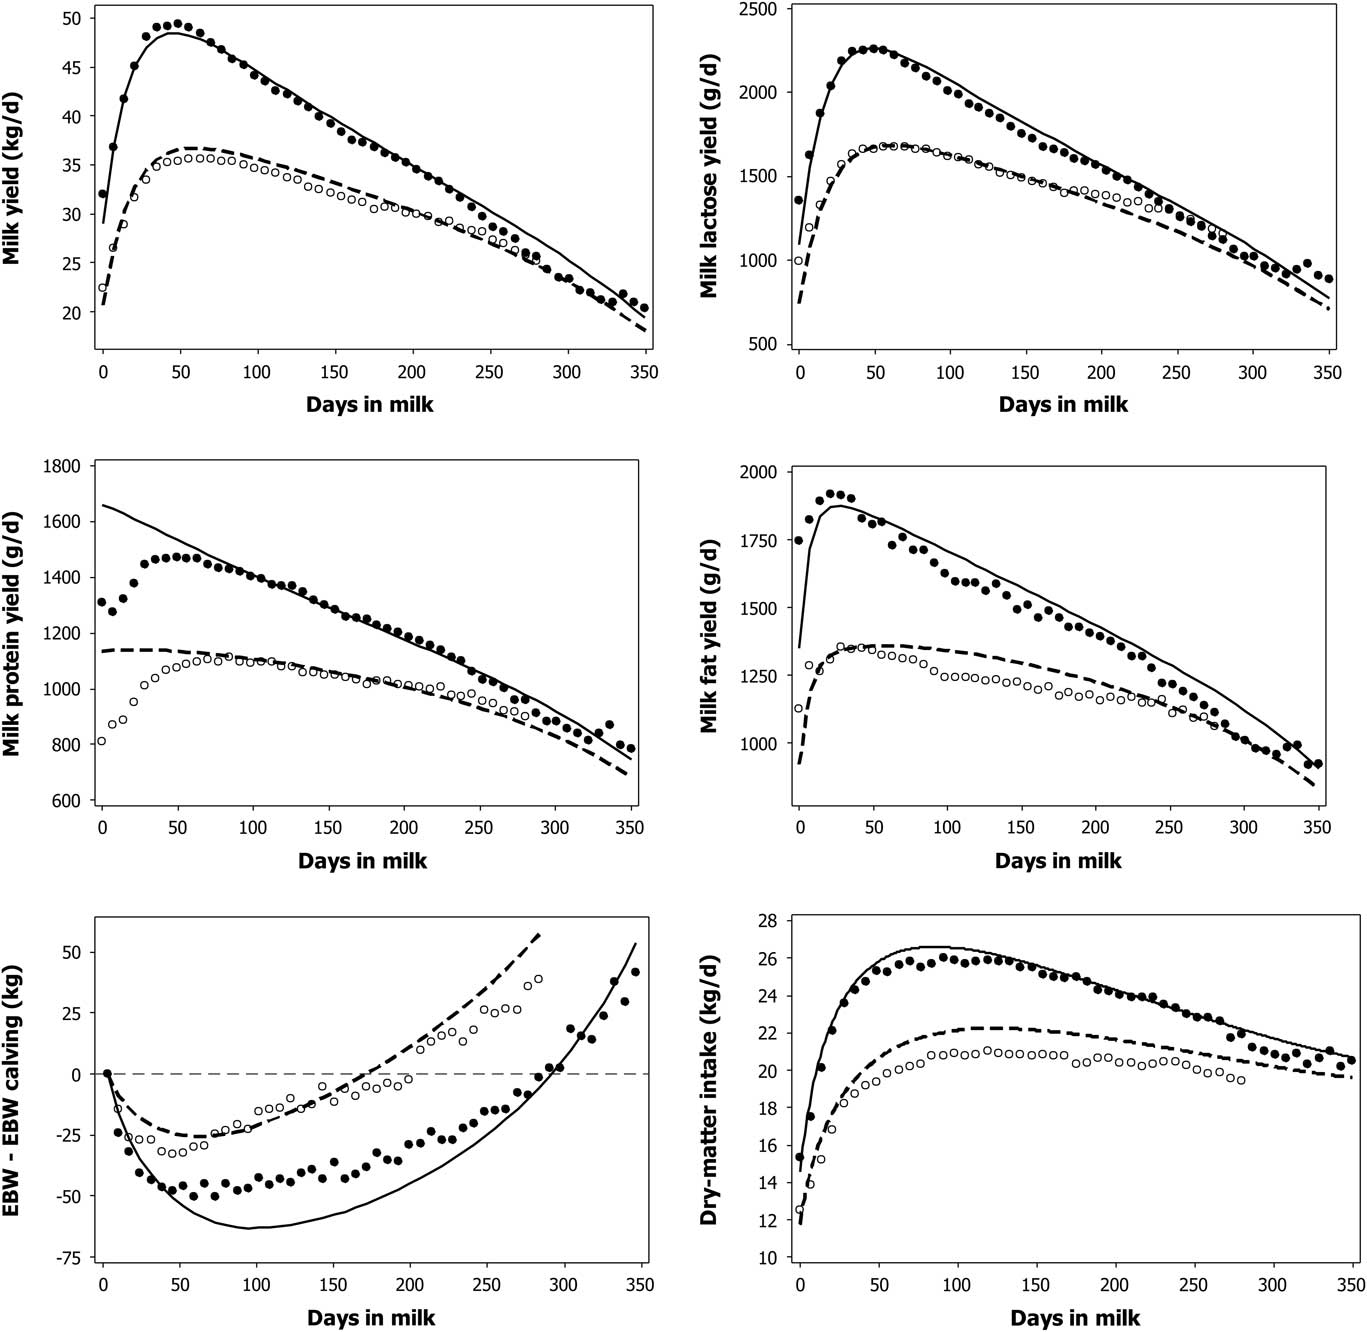
The effect of parity, within data set 1, between primiparous and multiparous (average parity number=3.4±1.5) of the highest producing groups (POT=49.4 kg/day) is plotted on Figure 3 with lines and circles representing, respectively, the predicted values and observed weekly values. It can be seen that differences between primiparous and multiparous simulated by the model are in good agreement with data. The only exception was observed for milk lactose content. The model predicted higher milk lactose content for multiparous than for primiparous (45.3 v. 44.6 g/kg) whereas the data shows the opposite (44.8 v. 46.4 g/kg). Complete statistics from the model calibration on data set 1 are presented in Supplementary Material S6.
Comparison between observed (circles) and predicted values (lines) of milk yield, milk component yields, empty BW change from calving and dry-matter intake relative to days in milk for primiparous (open circle, stippled line) and multiparous (solid circle, solid line) Holstein cows. Model differences between primiparous and multiparous were obtained by changing parity number P from 1 to 3. Parameters POT and conception date (Conc. date) were set to 49.4 kg/day and 100 days in milk, respectively.

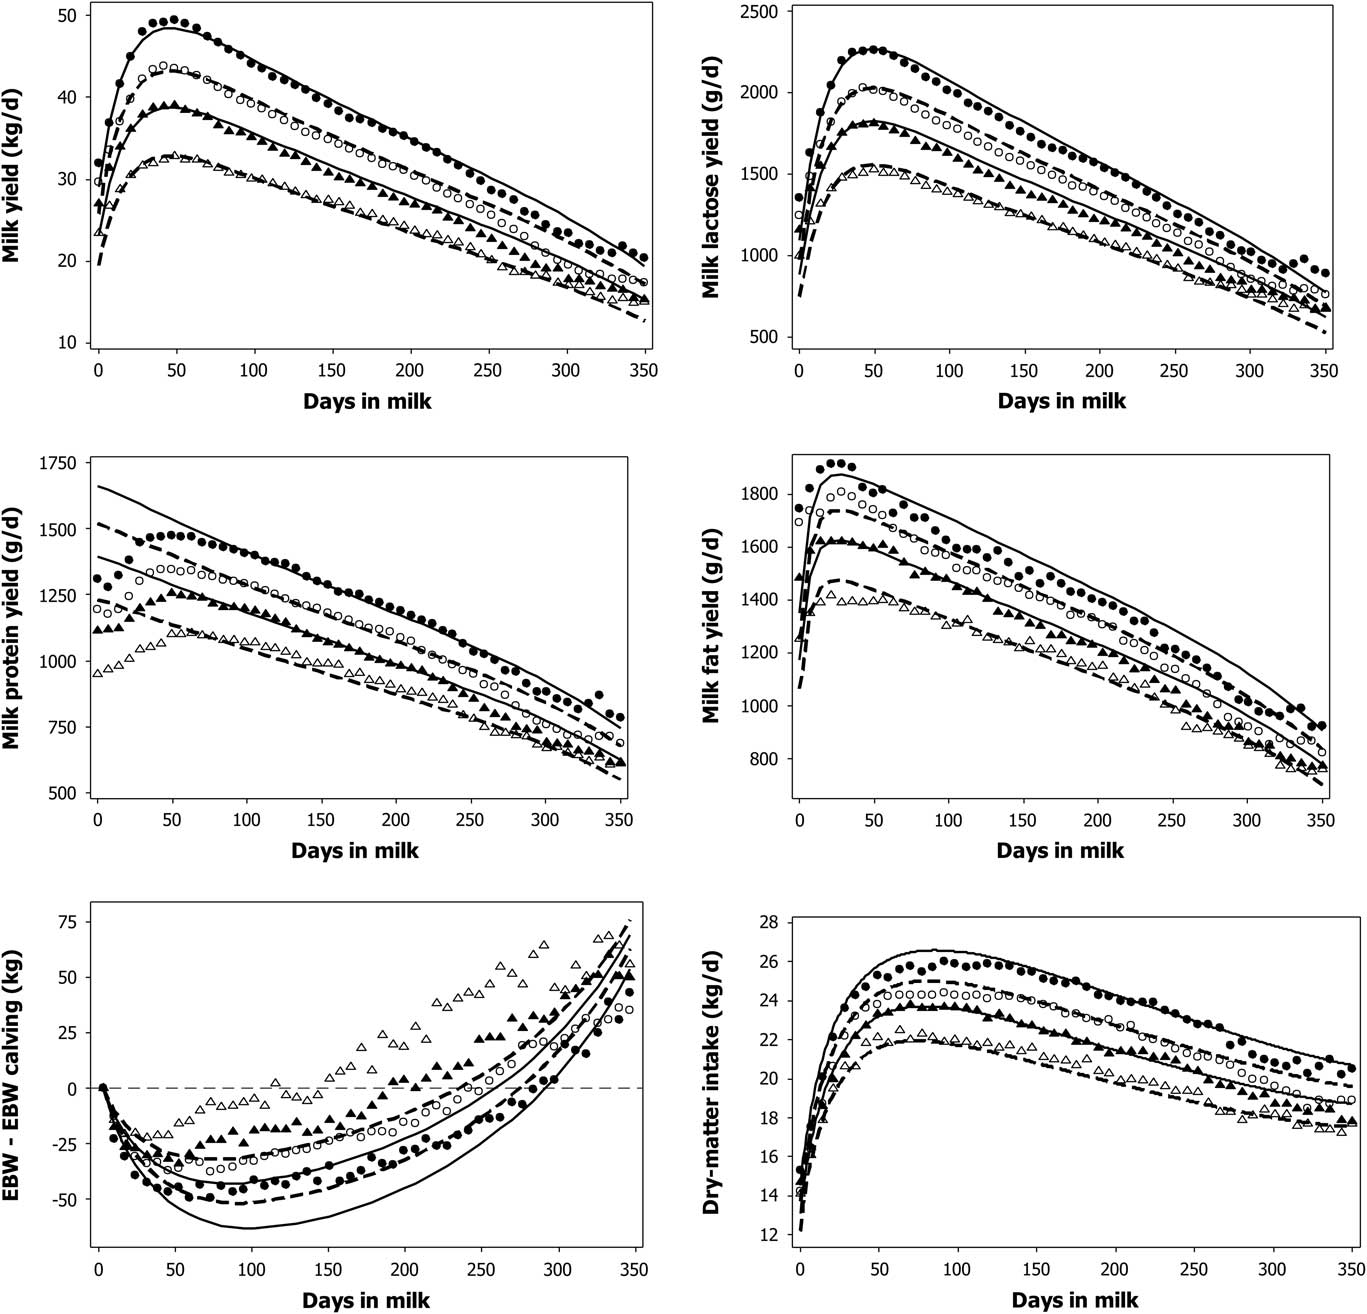
The observed and simulated effect of potential (POT=32.8, 39.1, 43.8 and 49.4 kg/day) within multiparous Holstein cows of data set 1 is shown in Figure 4 for milk yield, milk component yields, empty BW (expressed relative to empty BW at calving for clarity) and DMI. Assessed visually with Figure 4, differences between groups of production were globally satisfactorily captured by the model. Although this effect was calibrated with the multiparous set, the simulated differences between groups of primiparous were also in agreement with observations (Supplementary Material S6). The time of the peak of milk yield, mainly determined by the peak of MLY, was unaffected by animal potential and this was correctly simulated by the model. Within multiparous, the error of prediction of empty BW decreased with production level POT, from RMSPE=5.5% for the lowest producing group to RMSPE=2.7% for the highest producing group (Supplementary Material S6). The error of empty BW prediction was larger for multiparous (RMSPE=3.8%) than for primiparous (RMSPE=1.7%) and this was mainly due to an over prediction of empty BW loss in early lactation for multiparous, therefore inducing an under prediction of empty BW.
Comparison between observed (marker) and predicted values (lines) of milk yield, milk component yields, empty BW change from calving and dry-matter intake relative to days in milk for multiparous Holstein cows with different potential (POT). Differences between simulated lines were achieved by adjusting parameter POT to the observed milk yield at peak of lactation, respectively, 32.8 (Δ, stippled line), 39.1 (▲, solid line), 43.8 (○, stippled line) and 49.4 kg/day (●, solid line). Parameters P and Conc. date were set to 3 and 100 days in milk, respectively.

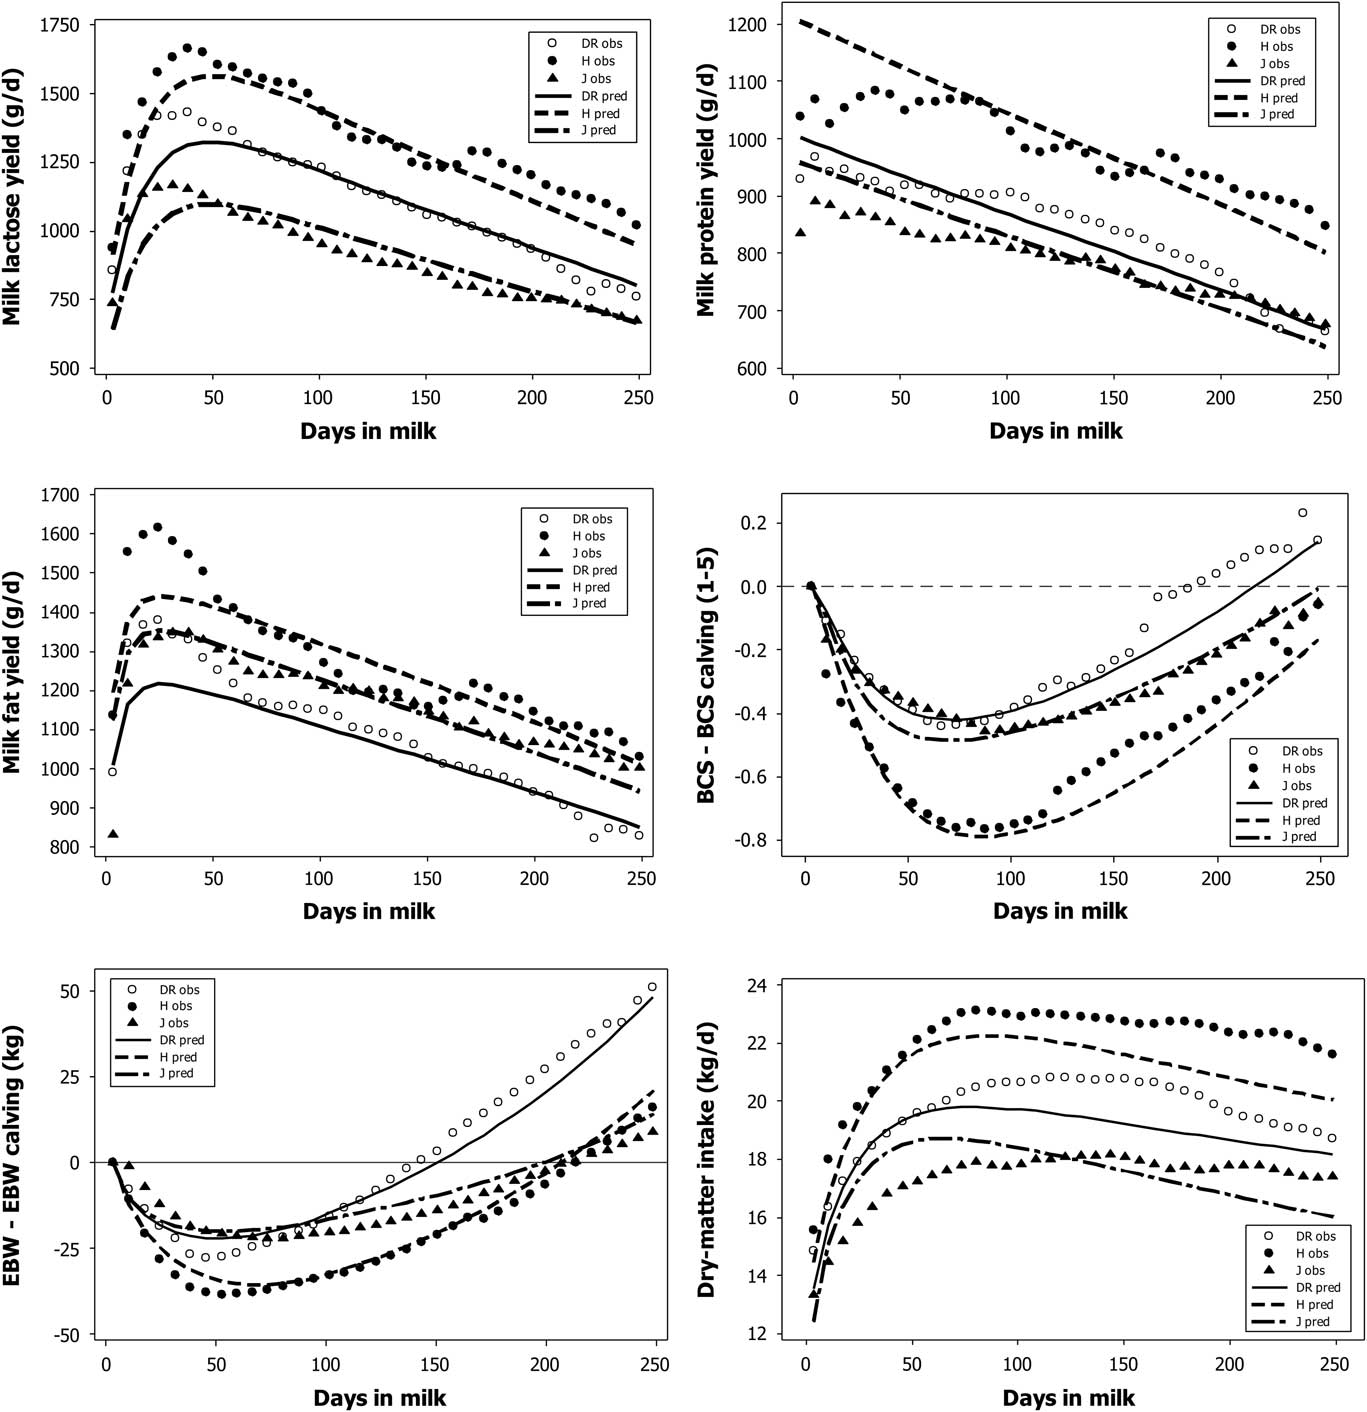
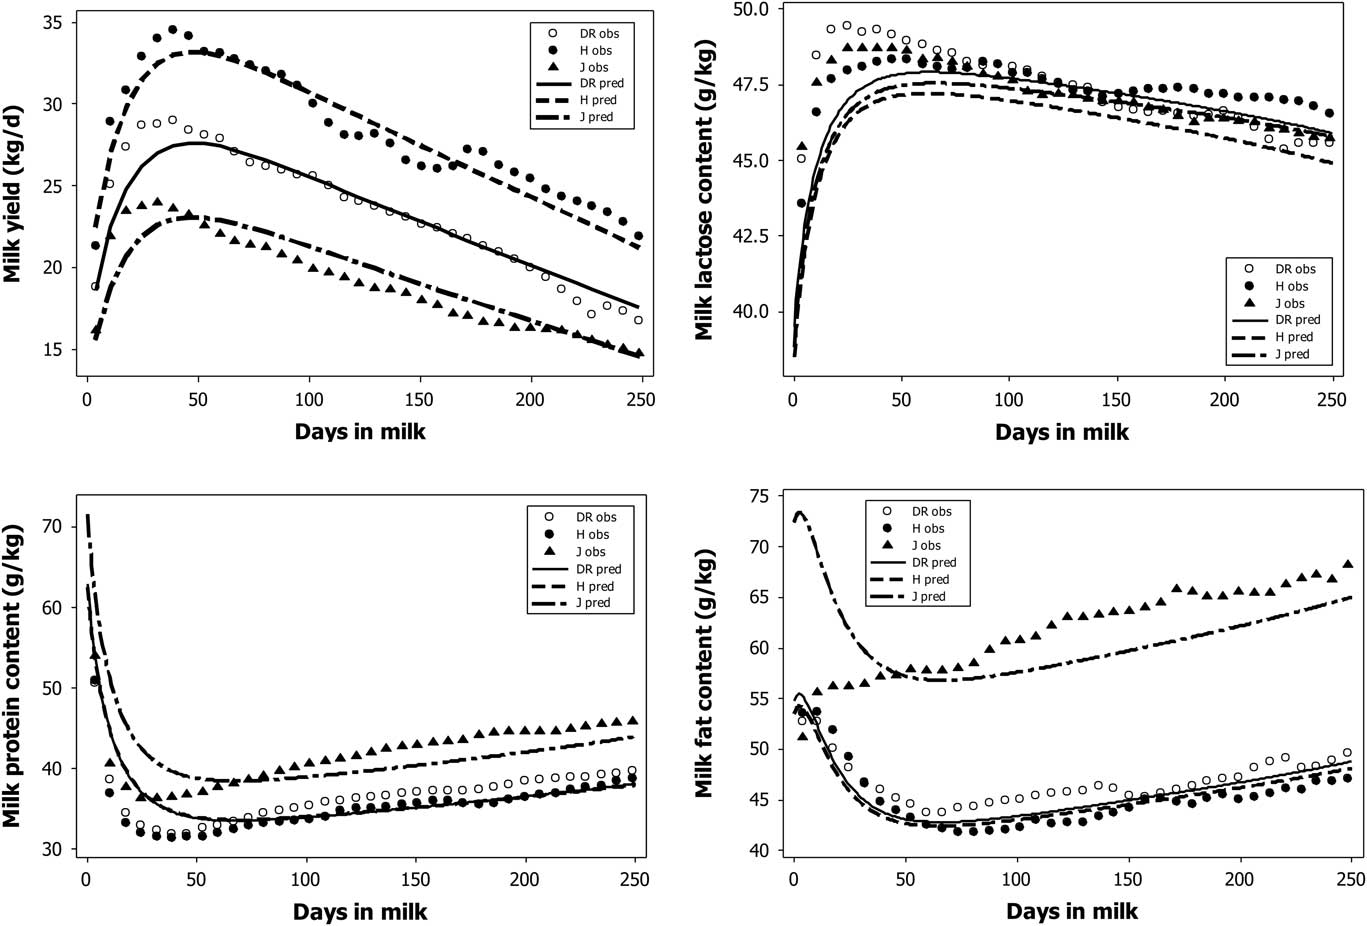
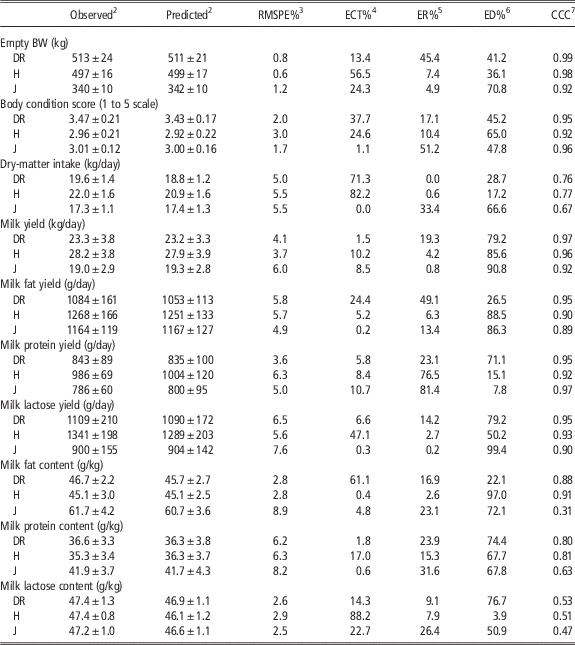
The fitted breed scaling parameters used to adjust differences in reference curves between Holstein (POT=35.0 kg/day), Danish Red (POT=29.1 kg/day) and Jersey (POT=24.0 kg/day) breeds are presented in Table 2. Intentionally, scaling parameters for milk production of the Holstein breed were unchanged as compared with value obtained on the first data set. However, after fitting BCS and empty BW curves, kCF, kAF, kCP and kAP were changed for all breeds. This change substantially improves the fit of BCS and empty BW of Holstein from data set 2 and allows better comparisons of scaling parameters estimates between breeds. The comparison between predicted and observed milk component yields, empty BW, BCS (expressed relative to empty BW and BCS at calving for clarity, respectively) and DMI is shown in Figure 5. Errors of prediction across breed for parity 2 are presented in Table 3 (statistics for parity 1 are in Supplementary Material S6). Mean RMSPE per variable and breed were systematically lower than 8.9%. This illustrates the overall ability of the model to adequately simulate sets of performance for Danish Red, Holstein and Jersey breeds. These results were obtained using the same overall model calibrated on data set 1 (Holstein), by simply changing the seven scaling parameters. The comparison between predicted and observed milk yield and milk composition is shown in Figure 6. The largest error in the prediction of milk fat and protein content was observed for the Jersey breed (RMSPE of 8.9% and 8.2%, respectively). Those errors were largely explained by an over prediction in early lactation (first 7 weeks) as observed in Figure 6. As in data set 1, milk lactose content decreased with parity (1.07 g/kg lower for second parity cow) but the model simulated a slight increase (+0.28 g/kg in average, Table 3 and Supplementary Material S6).
Comparison between observed (marker) and predicted values (lines) of milk component yields, empty BW change from calving, body condition score change from calving and dry-matter intake relative to days in milk for second lactation Danish Red (DR), Holstein (H) and Jersey (J) cows. Breed scaling parameters are presented in Table 2. Values of POT were 29.1, 35.0 and 24.0 kg/day for DR, H and J cows, respectively. Parameters parity (P) and conception date (Conc. date) were set to 2 and 100 days in milk, respectively.

Comparison between observed (marker) and predicted values (lines) of milk yield and milk component contents relative to days in milk for second lactation Danish Red (DR), Holstein (H) and Jersey (J) cows. Breed scaling parameters are presented in Table 2. Values of the potential parameter (POT) were 29.1, 35.0 and 24.0 kg/day for DR, H and J cows, respectively. Parameters parity (P) and conception date (Conc. date) were set to 2 and 100 days in milk, respectively.

Summary of observed v. predicted outputs (empty BW, body condition score, dry-matter intake, milk yield, milk component yields, milk component contents) for second parity cows across breeds (Danish Red (DR) with POTFootnote 1 =29.1, Holstein (H) with POT=35.0, Jersey (J) with POT=24.0) of data set 2

1 POT is the parameter controlling the overall effect of milk production potential (see Table 1). Breed scaling parameters used for the simulation can be found in Table 2.
2 Mean±SD.
3 Root mean squared prediction error expressed as a percentage of the observed mean.
4 Error due to intercept bias, as a percent of total MSPE.
5 Error due to slope bias, as a percent of total MSPE.
6 Error due to disturbance, as a percent of total MSPE.
7 Concordance correlation coefficient (scale from −1 to 1).
Discussion
The model presented here is based on a high-level description of homeorhesis expressed as relative priorities between life functions (regulating sub-model) that drive the partition of nutrients to different physiological processes through lactation (maintenance, milk components, body and pregnancy). This high-level description of homeorhesis fits within the top–down approach to modeling nutrient partitioning described in the review of Friggens et al. (Reference Friggens, Brun-Lafleur, Faverdin, Sauvant and Martin2013). With this approach and a relatively simple model structure, animal performance (body, milk, intake) was predicted in average with RMSPE=4.4% and CCC=0.83 (see Table 3). Further, as a result of the unified structure, the model simulates a mutually consistent set of outputs, in term of milk yield, milk composition, empty BW, BCS and DMI for dairy cows of different parity and potential.
A key element of this model is its ability to simulate differences in performance trajectories that are due to differences in potential and for different breeds. These effects were regulated by the model at two levels: (1) in the regulating sub-model, by the parameter POT which allows the relative priorities to be globally adjusted for milk production potential across the different biochemical units (fat, protein and lactose). (2) In the operating sub-model, by independent scaling parameters which allow adjustment for specific correlations between outputs such as those capturing the differences between breeds in milk composition. This model structure was sufficient to predict performance of Danish Red, Holstein and Jersey cows.
Milk yield and composition
Nutrition can have a strong influence on the shape of the lactation curves. However, given the objective of this study to describe homeorhetic changes, data sets were chosen to minimize the interference of nutrition on the lactation curves simulated by the model. The shapes of the curves for milk fat, protein and lactose yields were calibrated with data set 1, in which amount of concentrate offered was determined weekly based on observed milk yield. A possible effect of this feeding regime on the lactation shape could have been expected. However, when tested on the data set 2, where animals were fed a TMR ad libitum throughout lactation, the shape of the lactation curves simulated were consistent with the data (Figure 5) and RMSPE of milk yield for Holstein was even lower than for data set 1 (3.7% v. 4.0%, Table 3 and Supplementary Material S6). Furthermore, the lactation curves simulated here were in close agreement with published average lactation curves (NRC, 2001; Leclerc, Reference Leclerc2008; Spurlock et al., Reference Spurlock, Dekkers, Fernando, Koltes and Wolc2012) or equations developed to predict potential milk yield (Faverdin et al., Reference Faverdin, Delagarde, Delaby and Meschy2010; Volden, Reference Volden2011; Zom, Reference Zom2014). The use of different parameters between breeds to control the shape of the lactation curve as applied in the NorFor system (Volden, Reference Volden2011), was not necessary in this model (Figure 6).
The model structure assumes a simple linear decrease of MPY from the first day of lactation onwards. However the Holstein data (data set 1) of different productions levels (Figure 4) showed a clear increase during the first 50 days in milk. Consequently MPY of the first data set was over predicted in early lactation (by 250 g/day the first week). In this data set, concentrate-to-forage ratio increased from 0.28 to 0.45 during the first 4 weeks of lactation thus it is not clear to what extent this early lactation increase of milk protein was nutritionally driven, which could partly explain the observed increase in MPY. Although this early lactation increase was not observed in data set 2, MPY was still over predicted in early lactation, and this was mainly due to a slope bias (Table 3). However, as in other prediction curves (Faverdin et al., Reference Faverdin, Delagarde, Delaby and Meschy2010; Zom, Reference Zom2014), we chose to simulate maximum MPY at the onset of lactation. Further comparison with other MPY curves would be useful to better characterize the homeorhetic regulation of protein secretion in early lactation.
The negative genetic correlation observed between milk yield and milk fat content (−0.51) or milk yield and milk protein content (−0.55, Loker et al., Reference Loker, Bastin, Miglior, Sewalem, Schaeffer, Jamrozik, Ali and Osborne2012) was reproduced in this model. Nevertheless, the CCC of milk lactose content, characterized by the lowest variation throughout lactation, was low (0.50, Table 3). In particular, and in common for both of the data sets, milk lactose content was under predicted in early and late lactation. This coincides with times where the relative role of protein compared with lactose in the empirical equation used to predict milk yield is the highest. This further suggests that the fixed coefficient of osmotic pressure attributed to protein (4.3 g milk/g protein) is confounded with the effect of minerals in milk. With this coefficient, higher milk lactose content was predicted for multiparous than for primiparous whereas data in this study and others (Miglior et al., Reference Miglior, Sewalem, Jamrozik, Bohmanova, Lefebvre and Moore2007) shows a negative effect of parity on milk lactose content. Knowledge of the effect of stage of lactation and parity on minerals content would help in improving the milk lactose content prediction.
Empty BW and composition
In the data set 1, there was a positive relationship between empty BW at 1st week after calving and potential. Animals with average values of POT of: 32.8, 39.1, 43.8 and 49.4 kg/day had empty BW of 500, 514, 523, 541 kg, respectively. However, this positive trend disappeared when empty BW was calculated as the average across lactation (first 41 weeks). This is in agreement with the reported genetic correlations between milk yield and live weight, which are positive and moderate (0.18 to 0.37) in the 1st week post-calving (Veerkamp and Thompson, Reference Veerkamp and Thompson1999) but low (−0.01) in the overall lactation (Berry et al., Reference Berry, Buckley, Dillon, Evans, Rath and Veerkamp2003). However, the main purpose in simulation of body composition was not to predict empty BW and BCS at calving but to quantify changes in empty BW and BCS through lactation. With the dissociation of empty BW into body protein and body fat, the model was able to simulate different rates of mobilization/reconstitution between protein and lipid through the lactation. In particular, a shorter protein mobilization phase as compared with lipid mobilization was simulated resulting in an increasing fat-to-protein ratio within the mobilized tissue, in agreement with literature values of body fat and protein change (see Supplementary Material S3). As a consequence, the observed difference in DIM between nadir empty BW and nadir BCS (Spurlock et al., Reference Spurlock, Dekkers, Fernando, Koltes and Wolc2012) was appropriately reproduced by the model. The regulating sub-model explicitly creates a positive correlation between body fat mobilization and production levels. Using the scaling parameters obtained with data set 1, Holstein cows producing 20 and 50 kg of milk at peak mobilized 17 kg and 64 kg of lipid, respectively. This increase in body fat mobilization with potential results in a greater and longer negative energy balance for high producing animals, consistent with literature (Faverdin et al., Reference Faverdin, Hoden and Coulon1987; Coffey et al., Reference Coffey, Simm, Oldham, Hill and Brotherstone2004). The greater mobilization in early lactation and greater reconstitution in late lactation for multiparous than for primiparous simulated in this model was also consistent with previous observations (Coffey et al., Reference Coffey, Simm and Brotherstone2002; Spurlock et al., Reference Spurlock, Dekkers, Fernando, Koltes and Wolc2012). However, as observed in Figure 4, empty BW mobilization was clearly overestimated for multiparous cows in data set 1. The model structure was developed such as one extra unit of NEL mobilized decreases desired NEL intake by 1 unit. Therefore increasing the fit of empty BW will result in decreasing the fit of DMI. In the model calibration, DMI data were considered more reliable than empty BW (that had to be estimated from BW) and were consequently favor during the calibration. In contrast, for data set 2, where BCS data were also available, the objective was to obtain breed specific parameters on rates of mobilization/reconstitution of body protein and body fat. Therefore the fit of BCS and empty BW were favored over the fit of DMI. Despite this, DMI was predicted across breed and parity with a RMSPE lower than 5.7%.
The Holstein breed was represented in both data sets, 1 and 2. Interestingly parameters controlling the rates of mobilization/reconstitution of body protein and body fat obtained with data set 1 and 2 were substantially different for the Holstein breed (greater in data set 2). The different plan of nutrition, with for example the lower dietary NEL content in data set 2 (6.64 v. 7.17 MJ/kg DM in data set 1) could be one explanation for such results. Future incorporation of animal response to dietary changes in the model could help in explaining those differences. However, specific farm effects (i.e. overall management) cannot be discarded.
Dry-matter intake
Desired DMI was predicted based on the energy requirements defined by the model. Therefore, DMI was considered as pull-driven by energy requirements. As such, a positive relationship between energy balance and DMI was introduced. Therefore, the low DMI in early lactation simulated by the model was the consequence of energy mobilization. The DMI curve simulated for the average multiparous animal (POT=35 kg/day) was in agreement with empirical equation developed for lactating dairy cows (NRC, 2001; Fox et al., Reference Fox, Tedeschi, Tylutki, Russell, Van Amburgh, Chase, Pell and Overton2004). The effect of parity ‘traduced’ by a lower and flatter DMI curve for primiparous than multiparous was also in line with curves reported for first and later parities (Coffey et al., Reference Coffey, Simm and Brotherstone2002; Spurlock et al., Reference Spurlock, Dekkers, Fernando, Koltes and Wolc2012).
Model limitations
It is relevant to discuss the limitations of the model presented here. The model is explicitly designed to simulate homeorhesis, and as such it does not predict dairy cows responses to change in dietary composition. Thus this model in its current state is of limited interest to predict dairy cow performance. However, an important step towards generating such models is being able to describe the underlying genetically driven partition of nutrients between milk and body reserves. The current model provides a basis for achieving this as it could be incorporated with existing equations that predict milk component yields responses to dietary changes (Brun-Lafleur et al., Reference Brun-Lafleur, Delaby, Husson and Faverdin2010; Daniel et al., Reference Daniel, Friggens, Chapoutot, Van Laar and Sauvant2016). Another important aspect for this current model to be useful would be its ability to set animal potential parameter (i.e. POT) from observed dairy cows performance. In this paper, the data sets used had well-fed dairy cows where POT could easily be determined. However, for a dairy cow fed a diet which does not allow the expression of its milk production potential, setting an appropriate value for POT is not an easy task. The recent method developed to estimate cow potential, from NEL and metabolizable protein efficiency (Daniel et al., Reference Daniel, Friggens, Van Laar, Ferris and Sauvant2017) could represent a valuable solution to solve that problem. As this method is based on equations that predict dairy cow responses, integration of such approach into the current model would also extend its ability to predict dairy cow performance under varying nutrition.
Similarly, effect of prior nutritional insult on performance are not included in this model. However, it has been shown that when given favorable feeding, cows compensate for prior nutritional insult by rapidly regaining body condition (Friggens et al., Reference Friggens, Ingvartsen and Emmans2004). Further development of the model would be needed to simulate such compensatory trajectory.
Finally this model was evaluated against group average. This represents the most common situation, where currently feeding data are available on a group basis. In the context of the increasing development of precision livestock feeding, a next step would be to evaluate the accuracy of the model when applied at the level of individual cows.
Conclusion
The model presented here predicts a mutually consistent set of trajectories for milk yield and composition, empty body composition change and DMI through lactation, as affected by homeorhetic regulation. Further, this model allows the prediction of differences in those trajectories between animals of different milk production potential within Holstein breed, and between Danish Red, Holstein and Jersey breeds. Using a model structure which requires few user-input parameters, dairy cow performance (body, milk and intake) were predicted in average with RMSPE of 4.4% and CCC of 0.83.
Acknowledgments
We gratefully acknowledge the work of Rafael Munoz Tamayo (INRA, Paris, France) who tested the model for identifiability.
Supplementary material
To view supplementary material for this article, please visit https://doi.org/10.1017/S1751731117002828