For high-risk post-operative cardiac surgical infants, the first 24–48 hours is critical. Standard paediatric cardiac intensive care unit monitoring does not always show subtle or gradual deterioration. Cerebral near-infrared spectroscopy has been used for some time during cardiac surgery to detect impaired cerebral oxygenation and is increasingly used in the pre- and post-operative phase for high-risk cases, for example Norwood operations.Reference Durandy, Rubatti and Couturier 1 – Reference Booth, Dukatz, Ausman and Wider 3 However, there are limited paediatric data to suggest values that may predict adverse events or poor outcome or indeed whether near-infrared spectroscopy can predict earlier deterioration – compared with standard monitoring – in the intensive care unit post-operatively.Reference Phelps, Mahle and Kim 4 There is one prospective study on hypoplastic left heart syndrome infants that has explored the effect of near-infrared spectroscopy on developmental outcome.Reference Hoffman, Brosig, Mussatto, Tweddell and Ghanayem 5 However, no prospective studies have examined other “high-risk” post-operative cardiac surgical infants in terms of how near-infrared spectroscopy changes over the first post-operative 24 hours. A systematic review found that although near-infrared spectroscopy has promise, there remains a lack of robust data demonstrating improved outcomes in congenital heart disease.Reference Hirsch, Charpie, Ohye and Gurney 6 Furthermore, the use of near-infrared spectroscopy is expensive, and thus in an economically constrained healthcare system like the UK National Health Service evidence of effectiveness is needed to justify the use of this monitoring for post-operative cardiac surgical children. The aim of this pilot study was to establish whether the use of near-infrared spectroscopy is potentially beneficial in a group of high-risk cardiac infants in a UK paediatric intensive care unit.
Materials and methods
A prospective observational pilot study was undertaken. The pilot study of 10 infants was undertaken at an intensive care unit in the North West of England. This study aimed to demonstrate associations between near-infrared spectroscopy and haemodynamic and biochemical variables, see how near-infrared spectroscopy changed over the first 24 hours post-operatively both in biventricular and single-ventricle infants, and see whether near-infrared spectroscopy showed earlier prediction of serious adverse events than standard paediatric intensive care monitoring. As a pilot study, potential benefit, parental consent rates, and refinement of data collection methods were also determined, as recommended before further definitive trialsReference Arnold, Burns, Adhikari, Kho, Meade and Cook 7
The inclusion criteria were:
-
1. Group 1 Biventricular group: high-risk biventricular repair infants: arterial switch operations, aortic arch repairs (n=5).
-
2. Group 2 Univentricular group: high-risk single-ventricle surgery: Norwood Sano operation, pulmonary artery bands, modified Blalock–Taussig shunts (n=5) in single-ventricle children or similar high-risk single ventricle surgery (where the child was expected to progress down the Fontan circulation route).
The Equanox (Model 7600; Nonin Medical, Plymouth, Minnesota, United States of America) near-infrared spectroscopy device was used to monitor 2 channel (cerebral and somatic) near-infrared spectroscopy for 24 hours post-operatively. The EQUANOX Advance™ Neonatal/Pediatric Sensor were applied over the infant’s right lateral forehead and the larger adult probe was used over the right flank area to monitor somatic near-infrared spectroscopy. This device is a third-generation near-infrared spectroscopy device with four light emitters, which records and saves data every 4 seconds. Near-infrared spectroscopy was not standard practice in our intensive care unit, and thus the display of data was blinded to staff, to avoid affecting interventions specific to near-infrared spectroscopy values. Serious adverse events were defined as: cardiopulmonary arrest in the study period, cardiac tamponade or other event requiring emergency chest re-exploration, need for extracorporeal membrane oxygenation, acute kidney injury defined as the need for renal replacement therapy, including peritoneal dialysis for fluid removal, in the paediatric intensive care unit period, necrotising enterocolitis (suspected or confirmed) where treatment was initiated, acute neurological events (stroke or seizures) or re-do surgery cardiac required within 14 days of initial operation. The infants were followed up for 30 days post-operatively or until they left the hospital for serious adverse events, length of paediatric intensive care unit stay, re-do surgery, and length of hospital stay.
The cerebral and somatic near-infrared spectroscopy probes – cerebral placed over right-sided forehead and somatic probe placed in a latero-posterior location over the right flank at the approximate level of T12-L2 – were placed by one of two study investigators before anaesthetic induction (time point 0) and were left in situ for 24 hours post-operatively from the time of arrival in the paediatric intensive care unit. Both cerebral and somatic near-infrared spectroscopy were continuously monitored and recorded by the device at 4-second intervals for 24 hours with significant events recorded and marked on the device and recorded on a data collection form. Near-infrared spectroscopy was also correlated at defined time points (an average score taken over 2 minutes) Time 0 (pre-operative in anaesthetic room), Time 1 (baseline post operation in theatre), Time 2 (1 hour post intensive care unit admission), Time 3 (4 hours on paediatric intensive care unit), Time 4 (8 hours on paediatric intensive care unit), Time 5 (12 hours on paediatric intensive care unit), and Time 6 (24 hours of paediatric intensive care unit) with a central venous oxygen saturation (taken from the child’s central line), serum lactate (measured on arterial blood gas), and other clinical and laboratory parameters (heart rate, blood pressure, arterial oxygen saturation, central venous pressure, haemoglobin, and arterial blood gas parameters). The position of the central line was not standardised for the purposes of this study, but was defined by institutional policy and the preference of the anaesthetist.
Standard cardiac intensive care unit haemodynamic monitoring was used that included: continuous electrocardiogram, continuous intra-arterial blood pressure, central venous pressure monitoring, continuous arterial oxygen saturation monitoring, and end tidal carbon dioxide monitoring. Both arterial and mixed venous blood gases were sampled regularly but intermittently for the partial pressure of oxygen and carbon dioxide, oxygen saturation, blood pH, base deficit and serum lactate, haemoglobin, and key electrolytes (potassium, ionised calcium, sodium, and chloride). These infants were nursed with a nurse: patient ratio of 1:1. These infants were kept heavily analgised, sedated, and usually muscle relaxed for the first post-operative night, with interventions kept to a minimum.
The statistical analysis was guided by a medical statistician and performed on Microsoft Excel and IBM SPSS v 20. Descriptive analyses were undertaken first, then where possible inferential analysis was undertaken. Normally distributed data were analysed using parametric tests with a p-value of <0.05 considered significant. Two-tailed tests were used. For correlations, a strong correlation was defined as r-value >0.6. Non-normally distributed and categorical data were analysed using non-parametric tests (Spearman’s ρ). Normality of data was confirmed by the Shapiro–Wilks test. For normally distributed data, repeated measures analysis of variance was used to test the change in near-infrared spectroscopy over time.
In addition to the planned analysis of near-infrared spectroscopy at fixed time points, an opportunistic analysis was conducted post hoc. The objective of this was to provide additional data points to allow more detailed examination of associations indicated by the planned analysis. For the opportunistic analysis, short-term variations in the near-infrared spectroscopy were eliminated by use of smoothing function. An exponentially weighted average was calculated by the function Zi =λXi+(1−λ)Zi−1, where Xi is the actual near-infrared spectroscopy value at time point I, and Zi is the exponentially weighted average at this point. Z0 is the mean of the first 75 recorded values. λ is the weight given to the most recent measurement. The choice of λ is largely arbitrary and in this case a value was chosen such that weighting of an individual measurement had a half-life of 20 minutes: this is similar to the plasma half-life of lactate in healthy adults.Reference Plowman and Smith 8 The analysis was repeated with raw near-infrared spectroscopy data and values averaged over shorter and longer periods to identify the effect of such smoothing. Correlation between lactate and near-infrared spectroscopy values was used to explore any association.
The value represented by near-infrared spectroscopy reflects both venous and arterial oxygen saturation within the tissue. Values will be lower in patients with lower arterial saturation despite equivalent oxygenation of the tissue; higher blood flow, for example, compensating for low oxygen content. Oxygenation of the tissues may be better represented by values calculated from regional, or venous, saturation and arterial saturation – measured by co-oximetry. Further analysis was undertaken for association between lactate and such values: “arterial-regional saturation difference” (SaO2 near-infrared spectroscopy); “regional venous saturation” and “oxygen excess” – arterial saturation divided by arterial-venous saturation difference.Reference Li, Zhang and Holtby 9 “Regional venous saturation” is intended to represent the oxygen saturation of the venous blood within the tissue. This requires an assumption as to the ratio of venous and arterial blood within the tissue – often taken as 70% venous and 30% arterial; such assumptions have been previously used in the calibration of tissue oximeters.Reference Chakravarti, Mittnacht, Katz, Nguyen, Joashi and Srivastava 10 , Reference MacLeod, Ikeda, Keifer and Moretti 11
Ethical approval was obtained by Liverpool East NHS research ethics committee (12/NW/0192) and the hospital research department approved this study. Written parental consent was obtained for this study.
Results
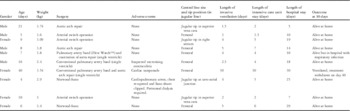
A total of 10 infants were recruited to this pilot study over 7 months in 2012, five with biventricular repairs and five with single-ventricle physiology undergoing palliation (Table 1). Only one set of parents declined consent. There were four serious adverse events in our study: one cardiopulmonary arrest and chest re-exploration, leading to clipping of the Sano shunt, one cardiac tamponade – that was electively re-opened in the paediatric intensive care unit – one infant treated for suspected necrotising enterocolitis, and one child with acute kidney injury required peritoneal dialysis for 48 hours (Table 1). In all, six of the central venous lines were placed in the femoral vein and four placed in the jugular vein; the details are presented in the Table 1.
Patient details.

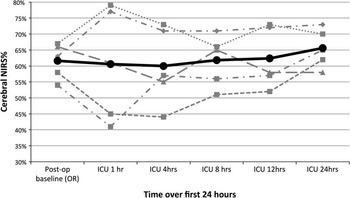
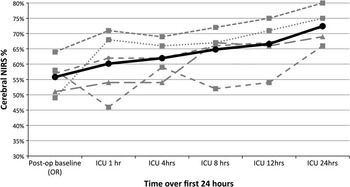
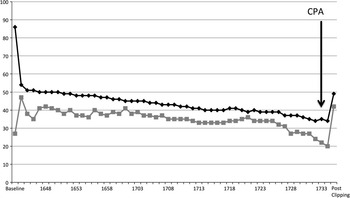
From the child’s baseline cerebral near-infrared spectroscopy value post-operatively (Time point 1), on average there was a significant increase in cerebral near-infrared spectroscopy – when all infants were combined – over the 24 hour period (p=0.02). However, in the single-ventricle infants the cerebral near-infrared spectroscopy remained essentially unchanged for the first 24 hours, compared with the biventricular infants where the rise in cerebral near-infrared spectroscopy was very marked (Figs 1 and 2). In the infant who suffered a cardiopulmonary arrest, cerebral near-infrared spectroscopy did give an indication of deterioration with a consistently reducing value – a 27.4% reduction from baseline – over 43 minutes until event (Fig 3). The value of somatic near-infrared spectroscopy was highly variable in our sample. Somatic near-infrared spectroscopy did not predict or differentiate abdominal adverse events.
Cerebral near-infrared spectroscopy over 24 hours in single-ventricle infants (n=5).

Cerebral near-infrared spectroscopy over 24 hours in biventricular infants (n=5).

Near-infrared spectroscopy trend over time before cardiopulmonary arrest in a Norwood Sano. CPA=cardiopulmonary arrest

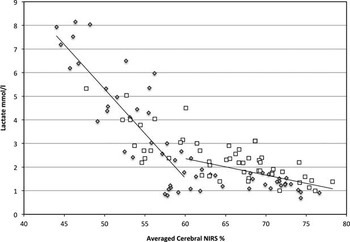
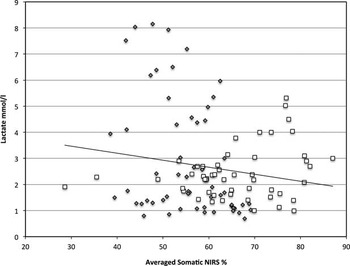
When all data points were considered, there was no strong correlation between cerebral near-infrared spectroscopy and mixed venous oxygen saturation (r=0.48). At individual time points, the correlation was only strong (r=0.74) 1 hour after admission. The correlation was stronger for the biventricular patients (r=0.68) than single-ventricle infants (r=0.31). A strong inverse correlation could be demonstrated between cerebral near-infrared spectroscopy and serum lactate at 3 of the 5 post-operative time points (1, 4, and 12 hours: r=−0.76, −0.72, and −0.69). The opportunistic analysis allowed comparison of cerebral near-infrared spectroscopy and serum lactate at 110 data points. The inverse correlation between (averaged) cerebral near-infrared spectroscopy and serum lactate was confirmed (r=−0.72). The correlation was stronger when the cerebral near-infrared spectroscopy was <60% (n=46) than when it was 60% or higher (n=64). For cerebral near-infrared spectroscopy <60%, the inverse correlation with lactate was strong (r=−0.82) compared with those cerebral near-infrared spectroscopy >60%, which was not (r=−0.50) (Fig 4). No correlations could be demonstrated between (average) somatic near-infrared spectroscopy and serum lactate (r=−0.13, n=110) (Fig 5) or mixed venous oxygen saturation and serum lactate (r=−0.11, n=43). These correlations were not improved by considering only the lower near-infrared spectroscopy values. The lack of relationship between mixed venous oxygen saturation and serum lactate was not affected by the position of the central line (r=0.40, n=15 jugular lines, r=−0.22, n=28 femoral lines).
Relationship between averaged cerebral near-infrared spectroscopy and lactate. The single ventrical group is represented by grey diamonds, the biventricular group by white squres. The two regression lines represent cerebral near-infrared spectroscopy values above and below 60%. A stronger correlation was identified when the average cerebral NIRS values were below 60%.

Relationship between averaged somatic near-infrared spectroscopy and lactate. The single ventrical group is represented by grey diamonds, the biventricular group by white squres. The regression line represents sNIRS.

Values calculated from a combination of regional saturation or venous saturation with arterial saturation were also examined. The ranges for these values were surprisingly wide (Table 2) and included values that would not be plausible physiologically. Correlation to lactate was not improved compared with uncorrected regional oxygenation. The exception was that the correlation of “oxygen excess” calculated from central venous saturation correlated better – but weakly – with lactate concentration than central venous saturation alone (r=−0.46). Individual values for oxygen excess, however, were clearly misleading, including negative and implausibly large values.
Correlation between measured and calculated values of oxygenation and lactate.

* Cerebral and somatic regional oxygenation are given as exponentially weighted averages – weighted such as the half-life of an individual measurement is 20 minutes
** Regional venous saturations are calculated from the regional saturation at that point in time and arterial SaO2 measured by co-oximetry, such that regional venous saturation=(regional saturation−0.3×SaO2)/0.7 (explained in text)
Arterial saturation differences are the difference between arterial saturation and either venous or regional saturation
“Oxygen excess” is calculated as the arterial saturation divided by arterial-venous saturation difference – using either measured central venous saturation or calculated regional venous saturation. It is a dimensionless ratio
Discussion
In a small sample of 10 infants undergoing cardiac surgery, we have described how cerebral and somatic near-infrared spectroscopy changed from baseline in the first 24 hours. We have found that cerebral near-infrared spectroscopy was related to mixed venous oxygen saturation – in the biventricular infants – and serum lactate in all patients, but somatic near-infrared spectroscopy was not correlated to either of these.
We did not see a reduction in cerebral near-infrared spectroscopy by 30–40% in the arterial switch babies in the 24 hours after surgery, as reported by others.Reference Toet, Flinterman and van der Laar 12 A retrospective review after Norwood surgery found the mean cerebral near-infrared spectroscopy at 1 and 4 hours was 51±7.5% and 50±9.4%, respectively.Reference Phelps, Mahle and Kim 4 The two infants in our study who underwent Norwood Sano operations had similar cerebral near-infrared spectroscopy to this at 1 hour (45% and 41%) and 4 hours (44% and 57%). The first patient suffered an early cardiopulmonary arrest, whereas the second patient suffered no adverse events and was discharged home after 29 days.
We have shown how in one case post-operative cerebral near-infrared spectroscopy monitoring predicted impeding cardiopulmonary arrest with a decline by 27% from baseline over 43 minutes. Although few would recommend it be used as a stand-alone parameter, used in conjunction with other clinical parameters, it showed deterioration earlier, particularly if only intermittent sampling of mixed venous oxygen saturations are undertaken. This finding is supported by other case studiesReference Kane 13 , Reference Maher, Phelps and Krishbom 14 and is probably the most useful aspect of this monitoring.
The relationship between cerebral near-infrared spectroscopy and serum lactate is of interest and has been previously noted in children after biventricular repair.Reference Chakravarti, Mittnacht, Katz, Nguyen, Joashi and Srivastava 10 Despite the small numbers, this relationship appears to be robust at least for patients with lower near-infrared spectroscopy values: though the impact of unrecognised confounding factors, especially on the opportunistic analysis, cannot be discounted. Increased levels of lactate has previously been linked to poor outcome in paediatric intensive care patientsReference Morris, McShane, Stickley and Parslow 15 and children after heart surgeryReference Basaran, Sever and Kafali 16 and is widely measured clinically.
In children with cyanotic heart disease – and significant arterial hypoxaemia – lower “regional” saturations are to be expected despite adequate tissue perfusion; this is confirmed by our data. We examined a number of methods to reconcile this; however, results of this were disappointing. We would hypothesise that errors in both clinical measurements (regional/venous saturations and arterial saturations) and in the presumption of the ratio of venous and arterial blood are magnified by such calculations. A more pragmatic approach is to set lower limits of “acceptability” for cyanotic children.
The lack of a relationship between somatic near-infrared spectroscopy or mixed venous oxygen saturation and lactate is disappointing. The poor performance of somatic near-infrared spectroscopy may be related to the variability in probe position. A more rigorous approach to this with use of ultrasound and placement over the liver – a large relatively immobile and homogeneous organ – may have improved performance. In children, following Norwood procedures, a relationship has been shown between acid base parameters and venous saturations.Reference Hoffman, Ghanayem and Kampine 17 However, a relationship between venous saturation and lactate (in critically ill patients) has not been consistently shown in previous studies.Reference Kasnitz, Druger, Yorra and Simmons 18 – Reference Meastiz, Rackow and Kaufman 20 In this study, variability in the position of the central line tip and use of both femoral lines and jugular lines may have added to our failure to demonstrate a useful relationship. The results here may be due to the small number of samples and the influence of a few outliers. A lack of correlation may also have been due to variability in line position: both femoral versus jugular and a position of the line tip in the inferior and superior vena cava, respectively, which we assume would have different venous saturations values.
We have shown how cerebral and somatic near-infrared spectroscopy varies in biventricular compared with univentricular infants, with lower mean values in the univentricular group, although both groups see an improvement over the 24 hour period (Graphs 1, 2). Previous studies have either studied Norwood and Norwood Sano infants exclusively,Reference Phelps, Mahle and Kim 4 , Reference Hoffman, Brosig, Mussatto, Tweddell and Ghanayem 5 , Reference Li, Zhang and Holtby 9 , Reference Li, Zhang and Holtby 21 – Reference Johnson, Hoffman and Tweddell 23 excluded the single-ventricle infants and only studied biventricular repairs,Reference Chakravarti, Mittnacht, Katz, Nguyen, Joashi and Srivastava 10 , Reference Toet, Flinterman and van der Laar 12 studied a mixture of children post-operatively,Reference Dodge-Khatami, Gottschalk and Eulenburg 24 – Reference Zulueta, Vida and Perisinotto 31 or examined only somatic or renal oximetry,Reference Bhalala, Nishisaki and McQueen 32 – Reference Schultz, Weiss and Bauersfeld 37 but none have examined or presented a comparison of the two groups separately in a prospective study.
As this was a pilot study with a sample of 10 infants, the statistical analyses were limited. However, the intention of the pilot study was to determine some feasibility of benefit of the monitoring, refine the data collection methods, and determine parental consent rates as recommended before larger scale trial work.Reference Arnold, Burns, Adhikari, Kho, Meade and Cook 7 There were few adverse events that further limited our analysis. The mixture of our use of internal jugular and femoral central may have affected our mixed venous oxygen saturation values. However, taking samples from the child’s central line as a surrogate for true mixed venous oxygen saturations is standard practice in UK paediatric intensive care units and pulmonary artery lines or continuous oximetric catheters are seldom used. Despite these limitations, this prospective pilot study has demonstrated the potential usefulness and feasibility of this monitoring, in a cost-constrained UK cardiac paediatric intensive care unit that warrants further exploration in a larger trial.
Conclusions
Our study shows that cerebral near-infrared spectroscopy may be beneficial as a non-invasive and continuously displayed parameter and may be valuable to use in selected “high-risk” patients, even in a cost-constrained healthcare service. Intra-operatively, cerebral near-infrared spectroscopy is widely used in the United Kingdom during high-risk cardiac surgery, and thus the cost of the consumable probe is negated and can be left in situ from the surgery. We remain uncertain about the value of somatic near-infrared spectroscopy, though greater consistency in somatic near-infrared spectroscopy might be gained by more precise placement. For any new monitoring parameter to improve outcomes or prevent adverse events, the intensive care team need to be cognizant of near-infrared spectroscopy and its limitations. In the future, it may be useful to develop and test a near-infrared spectroscopy guided algorithm (to be used in conjunction with other clinical monitoring parameters) for the management of post-operative high-risk univentricular and biventricular infants.
Acknowledgements
None.
Financial Support
Intravent Direct Ltd (the UK distributor of Nonin Medical at the time of this study) provided the Equanox near-infrared spectroscopy device on loan for the study duration, 10 Advanced Neonatal Sensors for this study, and the software to enable data download. The cost of the adult sensors was provided by the Research & Development department of Alder Hey Children’s NHS Foundation Trust. Alder Hey charitable funds paid for some research nurse time for the study.
Conflicts of Interest
None.
Ethical Standards
The authors assert that all procedures contributing to this work comply with the ethical standards of the National Health Service and with the Helsinki Declaration of 1975, as revised in 2008, and has been approved by the institutional committee NRES Committee North West – Liverpool East (No. 12/NW/0192) and the Alder Hey NHS FT, Research and Development Department (No. 12/10/RE).