I. INTRODUCTION
Thermoelectric materials enable the direct conversion of heat into electricity and are, therefore, the focus of intensive research and development efforts because of their potential to improve energy efficiency by harvesting waste heat from industrial processes and internal combustion engines.Reference Yang and Tritt1–Reference Tritt, Böttner and Chen3 Thermoelectric generators have already been used to power space probes to the outer solar system and are being investigated for improving fuel efficiency of automobiles by reducing the electrical load on the alternator, if not entirely eliminating it.Reference Yang and Tritt1 However, the use of thermoelectric generators is limited by the low efficiency of current thermoelectric materials. Thus, there is an ongoing search for new thermoelectric materials that can combine a high Seebeck coefficient and electrical conductivity with low thermal conductivity to maximize the figure-of-merit (ZT) and, therefore, the efficiency of thermoelectric generators.
Cu–Sb–Se intermetallic phases are currently being investigated as potential new thermoelectric materials with potential operating temperatures around 230 °C. Several ternary compounds exist in this system, including Cu3SbSe3, Cu3SbSe4, and CuSbSe2. Cu3SbSe3 is of particular interest as its thermal conductivity is very low (<1 W m−1 K−1 at room temperature),Reference Skoug, Cain and Morelli4 making it a good candidate for improving the thermoelectric ZT. The room temperature crystal structure of Cu3SbSe3 is orthorhombic, with Pnma (no. 62) symmetry.Reference Pfitzner5 The atomic structure consists of a three-dimensional network of edge-sharing Se tetrahedra. The Cu sits in Se tetrahedra and the Sb sits off-center in Se trigonal prisms. The purpose of this study was to examine the crystal structure of Cu3SbSe3 up to 390 °C and to investigate the thermal expansion behavior of Cu3SbSe3 and its thermal conductivity and general suitability for thermoelectric applications.
II. EXPERIMENTAL METHODS
The samples were synthesized by a direct fusion process. Elemental shot (Cu 99.99%, Alfa-Aesar, Ward Hill, MA; Sb 99.9999%, Alfa-Aesar; Se 99.999%, American Smelting and Refining Co., Tucson, AZ) were mixed in the desired proportion (3 mol Cu:1 mol Sb:3 mol Se) and sealed in an evacuated quartz ampoule. The precursors were held for 12 h at 900 °C, which is above the antimony (631 °C) and selenium (221 °C) melting temperatures and near the copper melting temperature (1085 °C). After 12 h, the sample was quenched in water at room temperature and then annealed at 325 °C for 3 days. The resulting ingot was ground for powder diffraction analysis.
Nonambient x-ray diffraction (XRD) was collected on a X’Pert Pro diffractometer (PANalytical B.V., Almelo, The Netherlands) with Cu Kα radiation and a position-sensitive detector. The diffractometer was in parafocusing geometry, with variable slits to improve the signal-to-noise ratio at higher diffraction angles, while avoiding spill over at low angles. (All scans were converted to fixed slit intensities before analysis.) The powder sample was heated with an XRK900 reaction chamber (Anton Paar GmbH, Graz, Austria) attachment under the flow of forming gas (4% H2 in N2) to prevent oxidation. XRD scans were collected every 25 °C from 25 °C to 375 °C and at 390 °C, with a heating rate of 20 °C/min. A hold for 30 min at each step provided time for the XRD scan from 20 to 90° 2θ values. The furnace was held before each scan for 1 min for temperature equilibrium. The maximum temperature was limited to 390 °C to avoid any potential for melting. XRD data were collected on heating and cooling over three full cycles. The XRD spectra were analyzed with the HighScore Plus computer program (version 3.0.1; PANalytical B.V., Almelo, The Netherlands). Quantitative phase analysis, where appropriate, was determined by Rietveld refinement. Le Bail refinements were used to determine the lattice parameters. Charge flipping analysis was conducted with the Superflip program.Reference Palatinus and Chapuis6
The FL5000 laser flash system (Anter Corp., Pittsburgh, PA) was used to obtain thermal diffusivity of the specimen. The system uses a Nd:Y3A15012 laser to deposit a short heat pulse on the sample surface and an InSb IR detector to record the back surface temperature rise. Using the ASTM 1461 for flash diffusivity and the Clark and Taylor method, thermal diffusivity was calculated. The specimen was measured from 75 to 300 °C in a graphite furnace with 25 °C increments. The testing environment was flowing Ar. A DSC-404C differential scanning calorimeter (DSC; Netzsch-Gerätebau GmbH, Selb, Germany) was used to determine the specific heat capacity of a 6-mm diameter by 1-mm thick disk of Cu3SbSe3 in the temperature range from 50 to 300 °C. The measurements were made using the three run ratio method described in ASTM E 1269. Platinum pans and lids were used during the DSC runs, and all runs were conducted in flowing titanium-gettered Ar at 50 sccm after multiple vacuum evacuation and backfill cycles. Heating and cooling rates of 20 °C/min were used. The standard reference material was a synthetic sapphire disk that had a total heat capacity that closely matched that of the specimen under test. The uncertainty of the specific heat results is estimated to be less than ±3%. The thermal conductivity was calculated as the product of diffusivity, heat capacity, and density.
III. RESULTS
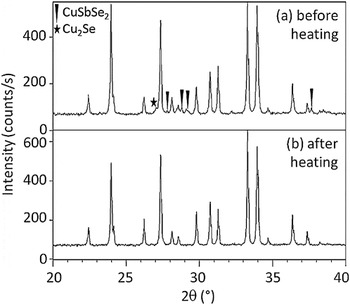
After annealing at 325 °C for 3 days, the material obtained is a mixture of three phases, as seen in Fig. 1(a). The desired phase, Cu3SbSe3, is the major constituent (∼90 wt%), with small amounts of CuSbSe2 and Cu2Se. With further heating, during the nonambient XRD data collection, the amount of CuSbSe2 and Cu2Se secondary phases decreases. By the end of the first cycle of heating to 390 °C and cooling, only the Cu3SbSe3 phase remains, as seen in Fig. 1(b).
Room temperature x-ray diffraction (XRD) patterns of the Cu3SbSe3 sample (a) before and (b) after one cycle of heating to 390 °C. CuSbSe2 peaks are marked with triangles and Cu2Se peaks with stars. The unlabeled peaks are indexed to Cu3SbSe3. Traces of CuSbSe2 and Cu2Se secondary phases present before heating are absent after heating.

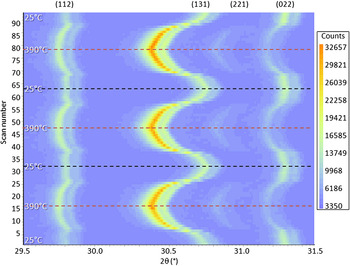
Nonambient XRD patterns collected over all three cycles of heating to 390 °C and cooling back to 25 °C are shown in Fig. 2. Only the range from ~29.5 to ~31.5° 2θ values is displayed for clarity. From the data, two main effects are observed, both of which are reversible: nonlinear peak shifts and large changes in the relative peak intensities. Nonlinear peak shift is clearly observed in the (131) peak, with an increased rate of shift around 175 °C. For peaks with relatively large ℓ indices, such as the (112) peak shown in Fig. 2, the peaks are observed to shift to higher angles (i.e., lower spacings) with increasing temperature, again around 175 °C.
High temperature XRD (HTXRD) patterns of the Cu3SbSe3 sample over three cycles of heating to 390 °C and cooling back down to 25 °C, showing the (112), (131), (221), and (022) peaks of Cu3SbSe3.

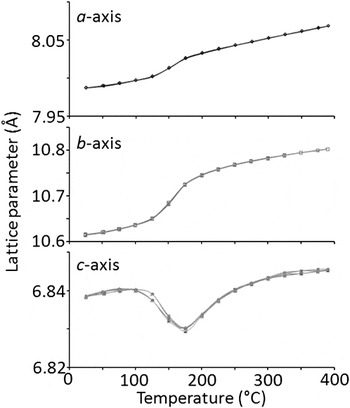
To further investigate the nonlinear peak shifts, Le Bail fitting was used to extract the lattice parameters, which are plotted versus temperature in Fig. 3. Le Bail refinements ignore the atomic structure of the material and, therefore, fit the peak intensities independently, allowing the peak positions, and therefore the lattice parameters, to be determined with a higher degree of accuracy. For the a and b axes, the thermal expansion is approximately linear and the slopes are the same from 25 to 125 °C and from 175 to 390 °C. Between 125 and 175 °C, however, the lattice expands at a higher rate. The observed changes are reversible and repeatable, with the results from all three cycles lying on top of each other. For the c axis, the thermal expansion behavior is more complex. The c axis contracts with increasing temperature between 100 and 175 °C, showing negative thermal expansion. Above 175 °C, the thermal expansion again becomes positive, gradually decreasing until the c axis regains its initial (<100 °C) trajectory around 300 °C. The scale of the changes in the c axis is an order of magnitude lower than that in the a and b axes. Therefore, the volumetric thermal expansion behaves in a similar manner as the a and b axes, with a lower rate of thermal expansion from 25 to 125 °C and from 175 to 390 °C and a higher rate between 125 and 175 °C. The changes in all three axes and the unit cell volume are continuous.
Lattice parameters as a function of temperature for the Cu3SbSe3 phase over three heating cycles.

The other main effect observed in the XRD patterns is changing peak intensities with temperature. Some peaks gain intensity with temperature [e.g., (111) and (131)], whereas others lose intensity [e.g., (020) and (022)]. With these large intensity changes, the high-temperature XRD data (above the transition around 175 °C) can no longer be fit with the same crystal structure as the room-temperature XRD data using Rietveld refinement, even when refining the atomic parameters (positions, occupancies, or thermal displacement parameters). Attempts to refine the atomic parameters lead to large thermal displacement parameters and low occupancies of the Cu atoms. No large shifts are observed in the Sb or Se atom. The Rietveld fitting suggests that the transition, evidenced by changes in the lattice parameters and peak intensities, involves primarily the Cu atoms.
The Rietveld refinement results also suggest that the scattering power of the Cu atoms above the transition cannot be easily described with the traditional atomic parameters of position, occupancy, and displacement parameters. Therefore, another analysis method, which does not rely on atomic parameters, such as charge flipping, can be a useful tool. Charge flipping analysis uses the integrated peak intensities, as determined by a Le Bail fit, to determine the distribution of electron density in the unit cell. Maxima in the electron density distribution can be correlated to atomic positions according to the relative atomic number (maxima with the highest intensity correspond to the atoms with the highest atomic number and, therefore, the highest scattering power).
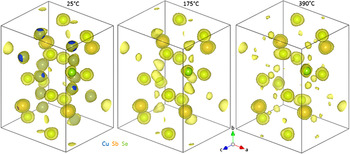
Charge-flipping electron density maps from Cu3SbSe3 are shown in Fig. 4, calculated from scans below the transition at 25 °C, in the middle of the transition at 175 °C, and above the transition at 390 °C. Below the transition, well-defined maxima are observed, which can be clearly correlated with the Sb, Se, and Cu atoms. The results from the charge-flipping analysis of the scan at 25 °C reproduce the known room temperature crystal structure of Cu3SbSe3, validating the analysis. In the middle of the transition at 175 °C, the electron density maxima correlated with Sb and Se are still well defined, but the intensities of the Cu maxima are reduced while the level of the background is increased. Above the transition at 390 °C, the electron density maxima correlated with Sb and Se are still well defined while the intensity of the Cu maxima have diminished almost to the level of the background, which is increased. These charge flipping results indicate that above the transition, the Cu atoms become delocalized, no longer centered on the fixed atomic positions.
Electron density maps before (25 °C), during (175 °C), and after (390 °C) the transition, as determined by charge flipping analysis of HTXRD data. The Cu, Sb, and Se atom positions are marked with orange, blue, and green spheres, respectively.

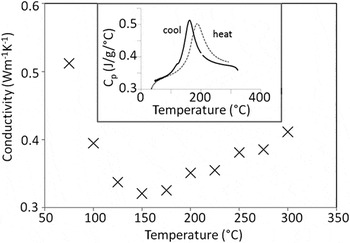
The thermal conductivity measurements are shown in Fig. 5. The minimum conductivity is ∼0.3 W m−1 K−1, which is very low, less than that of glass. The low thermal conductivity is consistent with values (0.7−1 W m−1 K−1at room temperatureReference Skoug, Cain and Morelli4) previously reported for this material at low temperatures, from room temperature down to 80 K. Because the diffusivity samples were cut from cast ingots, the possible presence of microcracks or other defects could contribute to the low thermal conductivity. The minimum thermal conductivity occurs between 150 and 175 °C, approximately the same temperature as the order/disorder transition observed in the high-temperature XRD analysis. DSC heating and cooling curves are shown in the inset of Fig. 5. A peak is observed in both the heating and cooling curves, corresponding to the order/disorder transition.
Thermal conductivity of Cu3SbSe3 as a function of temperature from 75 to 300 °C. The minimum conductivity is approximately 0.3 W m−1 K−1 around 150–175 °C. The inset shows the differential scanning calorimeter curve, with the heating curve as a dotted gray line and the cooling curve as solid black.

IV. DISCUSSION
The nonlinear, yet continuous, changes observed in the lattice parameters of Cu3SbSe3 with temperature considered together with the changes observed in the electron density distribution of the Cu atoms point toward a phase transition occurring around 175 °C involving ordering of the Cu atoms. At room temperature, the Cu atoms are ordered, fully occupying well-defined sites within the unit cell. As the sample is heated, the Cu atoms gain thermal energy, allowing them to move off the atomic sites of the ordered structure and become disordered. At the same time, the unit cell lattice parameters shift to accommodate the movement of the Cu atoms.
Similar transitions have been observed in the S-(Cu3SbS3) and Bi-S-(Cu3BiS3) analogs around 122 and 135 °C, respectively.Reference Pfitzner7, Reference Makovicky8 Both these analogous phases have similar crystal structures as Cu3SbSe3. Above the transition, the Cu atoms become distributed across multiple sites in a disordered arrangement. Cu3SbS3 and Cu3BiS3 have been reported to be ionic conductors above the transition temperaturesReference Makovicky8, Reference Makovicky9 because of the mobile Cu atoms. Given the similarity in the crystal structures and order/disorder transitions observed for Cu3SbS3, Cu3BiS3, and Cu3SbSe3, it is likely that the Cu3SbSe3 will also exhibit ionic conductivity.
The thermal conductivity behavior of Cu3SbSe3, in particular the change from decreasing to increasing conductivity near the same temperature as the order/disorder transition detected in the high-temperature XRD analysis, suggests an important structure–property relationship. The increasing conductivity is likely due to the transition to the high-temperature, disordered state, perhaps because of a high temperature ionic conductivity contribution to the thermal conductivity.
V. CONCLUSION
In summary, structural changes in Cu3SbSe3 were investigated at temperatures from 25 to 390 °C. The lattice parameters exhibit nonlinear, but reversible and continuous, thermal expansion behavior, with an increased thermal expansion rate in the a and b axes between 125 and 175 °C and negative thermal expansion from 100 to 175 °C in the c axis. Charge flipping analysis indicates that the Cu atoms are becoming disordered above the transition temperature. These observations point to a phase transition involving ordering of the Cu atoms, similar to the transitions previously reported in the S- and Bi-S-analogs.Reference Pfitzner7, Reference Makovicky8
This order/disorder phase transition observed in Cu3SbSe3 could affect the performance of the material in thermoelectric applications. Nonlinear changes in the lattice parameters could lead to microcracking when subjected to thermal cycling during use. Such cracking could lead to a reduction in electrical conductivity, reducing the thermoelectric performance. Additionally, thermal transport measurements showed that the conductivity increased with temperature above the order/disorder transition, possibly due to the mobile Cu atoms. This increase in thermal conductivity could also reduce the thermoelectric performance of Cu3SbSe3. However, as the conductivity is still below that of glass even above the transition, Cu3SbSe3 could yet be a useful thermoelectric material.
ACKNOWLEDGMENTS
Sample synthesis at Michigan State University was supported by the National Science Foundation under award number NSH-CBET-0754029. Characterization research at Oak Ridge National Laboratory was sponsored by the Center on Revolutionary Materials for Solid State Energy Conversion, an Energy Frontier Research Center funded by the U.S. Department of Energy, Office of Science, Office of Basic Energy Sciences under Award Number DE-SC0001054 and by Oak Ridge National Laboratory’s High Temperature Materials Laboratory, sponsored by the U.S. Department of Energy, Office of Energy Efficiency and Renewable Energy, Vehicle Technologies Program.