Vocabulary size and word knowledge are the most important predictors of reading comprehension (e.g., Aarnoutse & Van Leeuwe, Reference Aarnoutse and Van Leeuwe2000; Eldredge, Reference Eldredge1990; Shiotsu & Weir, Reference Shiotsu and Weir2007). Therefore, children should acquire enough words and, of those words, sufficient knowledge. Many studies show that long words, low-frequency words, words with few derivatives, words that are acquired late, words that are acquired via language (rather than via experience), low familiar words, and low imageable words are processed more slowly and are less often accepted as words in the target language, in tasks in which participants are asked to distinguish between words and pseudowords (e.g., Brysbaert, Reference Brysbaert1996; Cortese & Fugett, Reference Cortese and Fugett2004; De Jong, Schreuder, & Baayen, Reference De Jong, Schreuder and Baayen2000; Gerhand & Barry, Reference Gerhand and Barry1998; Ghyselinck, de Moor, & Brysbaert, Reference Ghyselinck, De Moor and Brysbaert2000; Wauters, Tellings, & van Bon, Reference Wauters, Tellings and van Bon2008). Thus, it seems that words with these properties are “(more) difficult.”
Some of the word properties discussed above are highly intercorrelated, which reduces the individual predictive power of each single property. Principal component analysis or factor analysis can partly solve this problem (e.g., Baayen, Feldman, & Schreuder, Reference Baayen, Feldman and Schreuder2006). These multivariate techniques concentrate on the homogeneity or classification of variables that measure the same underlying dimension. Such methods yield scores of individual words on these underlying dimensions, and enable the researcher to assess scores of particular words on a particular dimension as relatively high or low. Furthermore, they allow the factor or component scores to be related to external variables.
Studies also commonly apply regression analysis, structural equation modeling, or other predictive techniques to investigate whether either single word properties or a set of a few highly correlated word properties predict performance on word tasks. However, words are complex wholes, and presumably the combination of word properties influences performance on word tasks. Most probably, some word properties interact with each other in particular words, whereas others do not or to a lesser degree. Although linear modeling techniques allow for the inclusion of higher order interaction effects between predictor variables, interpreting interactions between more than three predictors may quickly become rather cumbersome. However, as not all word properties correlate highly, finding out how particular combinations of word properties predict performance on word tasks would necessitate the inclusion of many interaction terms. For instance, words with many derivatives mostly will be relatively short (long words as stem of a derivative make pronunciation more difficult) and will be frequent (words with many derivatives are sociolinguistically important), so these word properties are correlated as discussed above. However, words with many derivatives not necessarily are very imageable or unimageable, and they not necessarily are learned via language or via experience. So within the group of short, frequent words with many derivatives there will be both highly imageable and lowly imageable words, and there will be words that are learned more via experience and words that are learned more via language. The shortness and high frequency of words with many derivatives would predict high performance on word tasks with such words, but their variability in imageability (IMA) and in mode of acquisition (MoA) might predict performance in different ways.
To study such interplays of word characteristics in more detail, one objective of the present study is to explore whether we can identify groups or clusters of words that share particular configurations of word properties other than those already well known in the literature: the long, infrequent, late-learned, unfamiliar, and so forth “difficult” words versus the short, frequent, early-learned, familiar, and so forth “easy” words. Another objective is to investigate whether such word clusters predict performance on word tasks. Children's vocabulary development can be investigated in more detail if more than just two patterns of word properties can be determined. To address these research objectives, we performed an exploratory latent class cluster analysis on 703 words with eight word properties. The latent class cluster model identifies clusters of words that share similar configurations of properties. In contrast to traditional clustering approaches, latent class cluster analysis is model based, which allows the researcher to choose among a range of models using statistical model fit indices. The 703 words come from widely used (in The Netherlands), standardized tests for the end of elementary school and can be viewed as a norm for the word knowledge that children should have at the end of elementary school. Next, in order to empirically verify the findings in the cluster analysis, we investigated whether the clustering of words derived from a statistically best fitting model (i.e., from a range of models) predicts performance of three different groups of elementary school children, on two different word tasks, with two different samples of words from the larger sample of 703 words. Data were taken from three earlier studies.
The two word tasks used in the three studies are a lexical decision task and a use decision task. In a lexical decision task, participants have to distinguish words from pseudowords. The pseudowords in such tasks are orthographically and phonotactically legal letter strings that do not exist as words in the language in question (for an explanation of lexical decision tasks, see Harley, Reference Harley2001). Lexical decision tasks mostly are performed under time pressure, but not always (see Perea, Rosa, & Gomez, Reference Perea, Rosa and Gomez2002, for a discussion on disadvantages of using time pressure in lexical decision tasks). Lexical decision tasks can be performed both in written form and orally. In a use decision task participants have to choose from four very short sentences, each containing the same target word, the sentence in which the target word is used semantically correct (Coppens, Tellings, Verhoeven, & Schreuder, Reference Coppens, Tellings, Verhoeven and Schreuder2011). This task taps information about deeper knowledge of words than is minimally required for lexical decision: the task shows whether a participant can recognize at least some incorrect semantic usages of the target word in a sentence.
We first discuss the sampling of scores on the eight word properties and the cluster analysis (Experiment 1). Next, we discuss our analysis of the children's data (Experiment 2). We end with a general discussion.
EXPERIMENT 1
As discussed above, factor analysis methods, which have predominantly been applied in previous studies, focus on classification and reduction of variables into (latent) dimensions or scales, which then allows positioning each word on the latent (continuous) dimension. In contrast, a latent cluster analysis of words, which is applied in the current research, distinguishes groups of words with maximal internal homogeneity and maximal external heterogeneity of word properties. In particular, it seeks to identify latent subgroups (clusters) of words within a sample, each with particular configurations of word properties rather than the detection of common, underlying dimensions on which words may be located, the latter of which is the strength of factor analysis methods.
Obviously, both methods yield different information about the data: factor analysis examines the latent structure of variables, whereas latent class analysis examines the latent structure of cases. Therefore, given the objectives of the current study, which were to explore whether a sample of words may contain underlying clusters of words, the members of which will demonstrate different patterns of word characteristics, and whether such clusters have predictive value for children's' performance, we opted for a latent cluster analysis. Performed on a sufficiently large set of words with scores for relevant properties, a latent class cluster analysis may display possible, immanent patterns of distributions of properties, which differ from, or rather complement, previous findings based on simple correlational or factor analysis methods.
In order to perform such a cluster analysis, we collected data on word class, length, frequency, family size, age of acquisition (AoA), MoA, familiarity (FAM), and IMA for 703 words. Word class here is limited to content words: nouns, verbs and adjectives. Length is simply the number of letters of a word. Frequency is the number of times a word occurs in a large and representative sample of (adult) written language. For the Dutch language, the CELEX database contains frequency data (Baayen, Piepenbrock, & Gulikers, Reference Baayen, Piepenbrock and Gulikers1995). Family size refers to the number of words that, in a given language, occur with that word as stem. For instance, to the word family of “work” belong “homework,” “workable,” and so forth (e.g., Schreuder & Baayen, Reference Schreuder and Baayen1997). AoA refers to the age at which a child acquires a particular word (e.g., Catling & Johnston, Reference Catling and Johnston2005). MoA refers to the type of information a child uses when acquiring the meaning of a word, namely, perceptual information, linguistic information, or some combination of these. Children acquire, for instance, the meaning of color names mainly by perceptual information labeled with language: when people around them say things like That's a nice red sweater! In contrast, children learn the meaning of more abstract words like multiply mainly by linguistic information. They infer the meaning of the word from purely linguistic contexts, for instance when the teacher says We multiply 3 and 5 by taking three times 5 (e.g., Wauters, Tellings, van Bon, & van Haaften, Reference Wauters, Tellings, van Bon and van Haaften2003). The other two word properties we collected data on are FAM and IMA. FAM refers to how familiar a word is for an average language user (e.g., Carlisle & Katz, Reference Carlisle and Katz2006), imageability refers to how easy a language user can form a mental picture of the referent of a word (e.g., Cortese & Fugett, Reference Cortese and Fugett2004).
The data on word class, length, frequency, and family size were collected using relevant computer programs and databases. AoA, MoA, familiarity, and imageability in numerous previous studies have been measured reliably by asking adults to rate words on 7-point scales for these properties. The ratings have turned out to predict performance on language tasks both in adults and in children (e.g., Bird, Franklin, & Howard, Reference Bird, Franklin and Howard2001; Cortese & Fugett, Reference Cortese and Fugett2004; Suprenant & Hura, Reference Suprenant and Hura1999; Wauters et al., Reference Perea, Rosa and Gomez2008). Also in the present study, data on AoA, MoA, FAM and IMA were collected via adult ratings. We investigated the reliability of the ratings and the distributions of scores on these word properties. Next, we carried out a cluster analysis on the words with the eight word properties, using the LatentGOLD software (Vermunt & Magidson, Reference Vermunt and Magidson2000), a program for model based statistical cluster analysis.
Method
Materials. The target words for this experiment have been selected from three standardized tests, namely, the Cito Test for the End of Elementary School of 2004, 2005, and 2006 (www.cito.nl). Almost all Dutch sixth grade children take this annual test. The national mean and the number of children with a 100% score are published in the Dutch newspapers every year. Most secondary schools use these scores as an admission criterion. Each test consists of a set of language tasks, mathematics tasks, and tasks that measure “study skills.” These latter tasks require students, for instance, to read diagrams and geographical charts or to arrange words in alphabetical order. These tests are developed by Cito's own specialists on teaching and learning, together with a number of elementary school teachers (www.cito.nl).
With the help of a parsing program developed by Coppen (Reference Coppen, De Haan and Oostdijk1994) we selected the different nouns, verbs, and adjectives in these tests. Subsequently, nouns, verbs, and adjectives that occurred more than once in these tests and that occurred in tests of more than 1 year (e.g., both in 2004 and 2006) were selected (N = 703; 367 nouns, 209 verbs, and 127 adjectives). For the rating task, the 703 words with their scales (see below) were listed in four different random orders, and printed in the form of booklets. The pages of each booklet were randomized before stapling them, so that there was maximum variation in the order of words for the participants.
Participants. One hundred fifty adults (98 women, 52 men) participated in the rating experiment. All were students at the university level or at the higher vocational training level, most of them in Special Education. Each participant rated only one word property; 37 participants rated the words for AoA, 37 for MoA, 38 for FAM, and another 38 for IMA. Participants filled in the lists at home. They were not paid for the job.
Procedure. The properties AoA, MoA, FAM, IMA, were measured with a paper and pencil task in which adults were asked to rate the words on 7-point scales. For AoA, the scale contained the ages 0–2, 2–4, 4–6, 6–8, 8–10, 10–12, and 13 up. Participants were asked to indicate at what age they thought each word was acquired by an “average” child. For MoA, the 1 on the scale referred to acquired entirely by perceptual information, the 7 stood for acquired entirely by linguistic information, whereas the 2 to 6 in between ranged from more by perceptual than by linguistic information to more by linguistic than by perceptual information. Participants were asked to indicate how they thought an average child would acquire the meaning of a given word. For FAM, the scale ranged from 1, meaning very unfamiliar to 7, very familiar. Participants were asked to indicate how familiar the word was to the average adult Dutch person. For IMA, the scale ranged from 1, hardly imageable to 7, very imageable. Participants were asked to indicate how imageable the word was for them, that is, how easy they could form a mental picture of the referent of the word.
Analyses
For each word, the mean of the ratings of the participants was calculated for AoA, FAM, IMA, and MoA, respectively, and thus each word obtained an average score between 1 and 7 for each of these four measures. The reliabilities of the ratings (Cronbach α) were 0.99 for AoA, FAM, and IMA, and 0.98 for MoA. This indicates that the measurements were reliable. The mean scores for the four word properties were all approximately normally distributed (AoA: M = 3.62, SD = 1.11; MoA: M = 4.01, SD = 1.2; FAM: M = 5.7, SD = 0.7; IMA: M = 5.12, SD = 1.07). The distributions for FAM and IMA were somewhat skewed, in that there were relatively more words that were very familiar and very imageable. This is probably caused by the fact that we asked adults how familiar and imageable the words were to them, whereas these words were derived from tests for children. However, we had to measure FAM and IMA in this way in order to attune to previous research in which FAM and IMA were rated like this (see above).
Latent class cluster analysis. In contrast to traditional cluster analysis approaches, the latent class cluster approach is model based, which means that a statistical model is postulated for the population from which the sample under study is taken (Vermunt & Magidson, Reference Vermunt and Magidson2000). This has the advantage that several statistical criteria to test the validity of a model are available, which helps in determining the optimal number of clusters. Because we had no a priori expectations about the number of word clusters that could be distinguished on the basis of the eight word properties, we conducted an exploratory latent class cluster analysis. In particular, we estimated eight different models, ranging from a one-class model in which it is assumed that only a single word cluster can be discerned, up to an eight-cluster model.
To test the stability of the results obtained we performed a so-called “loose” cross-validation analysis (MacCallum, Roznowski, Mar, & Reith, Reference MacCallum, Roznowski, Mar and Reith1994). This entails randomly splitting the original sample of 703 words into two subsamples of about the same size. The first subsample (351 words) was used as an exploration sample to identify the latent class model with the best fit. The second subsample was used as a confirmation sample to validate the model obtained from the exploration sample. This validation strategy implies finding a final model in which the conditional likelihood and the likelihood for the latent classes are equal for both subsamples (Varela Mallou, Rial Boubeta, Braña Tobío, & Voces López, Reference Varela Mallou, Rial Boubeta, Braña Tobío and Voces López2008).
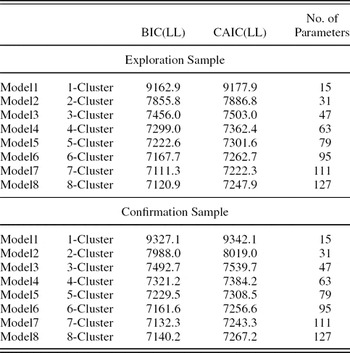
Table 1 reports the goodness of fit statistics for the different models applied to the exploration sample and confirmation sample. To assess the fit of the models, we use two well-known and often used information criteria in latent structure modeling: the Bayesian information criterion (BIC) and the consistent Akaike information criterion (CAIC). Both information criteria can be used to compare models with one another: the lower the values the better the model is in terms of fit and parsimony. BIC and CAIC introduce a penalty for the sample size and the number of parameters (Bozdogan, Reference Bozdogan1987; Raftery, Reference Raftery1999). According to these statistical criteria, the seven-cluster model fits the exploration data best, as this model has the lowest value for both the BIC (7111.3) and the CAIC (7222.3). When estimating the same models to the confirmation sample, we would expect that from the range of models the seven-cluster model would also be the best-fitting model. This hypothesis is corroborated by the findings for the second subsample: the seven-cluster model has also the best fit in terms of both BIC (7132.3) and CAIC (7243.3). From these findings we conclude that the model with seven latent clusters is the best representation of the latent structure of configurations of word characteristics of the 703 words.
Model fit statistics of latent class cluster models estimated for exploration sample and confirmation sample

Note: The number of cases in the exploration sample is 351, and the number of cases in the confirmation sample is 352. BIC, Bayesian information criterion; LL, log likelihood; CAIC, consistent Akaike information criterion.
To further assess the validity of our findings we have tested whether the hypothesis of equivalence of the seven-cluster latent class structure for both subsamples holds; to this end, we compared three multigroup models: a heterogeneous model that assumes that all model parameters differ between samples (BIC = 15,614.4, CAIC = 15,758.4), a partially homogenous model in which group-specific intercept parameters but not group-specific slopes are assumed (BIC = 15,318.5, CAIC = 15,408.5), and a completely homogenous model in which complete measurement invariance is assumed (BIC = 15,270.3, CAIC = 15,345.3). As the homogenous model has the best fit, the results indicate that the hypothesis of equivalence of the seven-cluster latent class structure between both subsamples is supported.
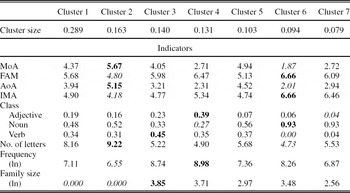
After testing and validating the seven-cluster model, we have inspected the parameters of the model, which reveals the distinctive characteristics of each of the seven clusters of words. Table 2 reports the means and conditional probabilities of word properties per cluster that show how the word clusters are related to the properties of the words.
Cluster probabilities (for class) and cluster averages (for the other manifest variables) according to the seven-cluster model

Note: Estimates are based on the seven-cluster model estimated from the full sample (703 cases). Largest and smallest averages and probabilities per variable are indicated by bold and italic, respectively. MoA, mode of acquisition; FAM, familiarity; AoA, age of acquisition; IMA, imageability.
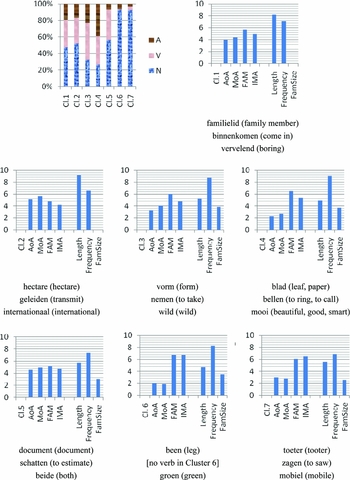
Clusters are named according to their size. Clusters 1 to 7 contain 28.9%, 16.3%, 14%, 13.1%, 10.3%, 9.4%, and 7.9% of the words of the total sample, respectively. The cluster analysis computes for every word the probability of belonging to Cluster 1, to Cluster 2, and so forth. Thereupon, words are assigned to the cluster for which they have the highest modal probability. In Figure 1 is given, first, for each cluster a stacked histogram of the relative division of words over the three-word classes. Second, for each cluster is given a histogram of scores on the other word properties and an example of a typical noun, verb, and adjective, in Dutch but with English translations. A word that is “typical” for a cluster has a very high probability to belong to that cluster; the examples in Figure 1 all have a probability of 0.98 or higher to belong to their cluster.
The clusters. Nouns, verbs, and adjectives; scores on other six word properties; examples. AoA, age of acquisition; MoA, mode of acquistion; FAM, familiarity; IMA, imageability; Length, number of letters; Frequency, CELEX frequency; FamSize, family size. [A color version of this figure can be viewed online at http://journals.cambridge.org/aps]

AoA, MoA, FAM, and IMA were scored on 7-point scales, so the maximum score on these word properties is seven. Higher scores mean a later AoA, acquisition more via language (whereas a lower score means acquisition more via experience), more FAM and higher IMA, respectively. Length, frequency, and family size were count variables, the latter two were scored as log frequencies. Scores for these three word properties on principle can be higher than seven.
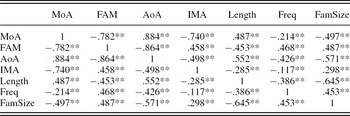
The patterns in our study, furthermore, imply that there are patterns of correlations between word intrinsic properties (e.g., length), language-bound properties (e.g., frequency), and cultural-bound properties (e.g., FAM). The correlation between each pair of properties in the complete sample can be found in Table 3.
Pearson correlations between the continuous variables

Note: MoA, mode of acquisition; FAM, familiarity; AoA, age of acquisition; IMA, imageability.
** p = .01 (two tailed).
Although all correlations are significant, they are not extremely high. However, as can be seen in Figure 1 and deducted from Table 2, the relation between properties varies per cluster: words in Cluster 3 are low imageable but highly frequent, whereas words in Cluster 4 and 6 are very imageable and highly frequent. Thus, the correlation between properties within specific clusters is probably much higher than within the complete sample.
Discussion
We discuss clusters with respect to their scores on the eight word properties, as shown in Table 2 and Figure 1; their linguistic class and their linguistic form; and some psycholinguistic and sociolinguistic aspects, based on our inspection of the words in each cluster. Finally, we discuss the correlations in Table 3.
In the upper left side of Figure 1, the division of nouns, verbs, and adjectives for the seven clusters is shown. The division is very skew in Clusters 6 and 7. Cluster 6 contains only four adjectives and no verbs, and Cluster 7 contains two words of each class. It is not very surprising that there is a relationship between word properties like IMA and AoA on the one hand and word class on the other hand. Nouns, in general, are more imageable than verbs and adjectives (Bird et al., Reference Bird, Franklin and Howard2001), and the vocabulary of young children contains more nouns than verbs and adjectives (Clark, Reference Clark2003). Cluster 6 and 7 words both have very high IMA ratings and very low AoA ratings (see Table 2). In contrast, Clusters 3 and 4 have the lowest relative number of nouns, Cluster 3 having relatively more verbs and Cluster 4 having relatively more adjectives. Magnini, Strapparava, Pezzulo, and Gliozzo (Reference Magnini, Strapparava, Pezzuolo and Gliozzo2002) point to a word property that is present much more often in verbs and adjectives (and adverbs) than in nouns. In the context of (digital) word sense disambiguation in text corpora, they distinguish between domain words and generic words. Domain words belong to a particular semantic domain, for instance, “animals,” with words such as “elephant.” Generic words, which in text corpora mostly are tagged as “factotum” (i.e., Latin for “works for all”), do not contain domain information; they are used in many different domains, and thus are very useful. These are frequent and mostly polysemous words that often have a grammatical function next to a semantic content. Magnini et al. (Reference Magnini, Strapparava, Pezzuolo and Gliozzo2002) give as examples “to be,” “to begin,” and “man,” but also other copulative verbs (e.g., to become) and auxiliary verbs (e.g., can, must) are words with factotum meanings, next to other verbs and adjectives that do not specify a context. In an analysis of a large word corpus, Magnini et al. (Reference Magnini, Strapparava, Pezzuolo and Gliozzo2002) found that only 40.2% of the nouns were generic words, whereas 83.2%, 86.5%, and 93.8% of verbs, adjectives, and adverbs, respectively, were generic words. Moreover, the generic words were more polysemous than the domain words, the verbs being the most polysemous of all. It is plausible that generic words would combine high frequency with relatively low IMA ratings when IMA is measured in the traditional way, that is, by representing to the raters words outside context. A more detailed analysis of our 703 words sample is needed to find the generic words, but a first inspection suggests that they are spread over Clusters 3, 4, and 5. These are also the clusters with the largest differences between frequency and IMA, the words being both frequent and lowly imageable. Cluster 6 words, in contrast are frequent and highly imageable (see Table 2).
Most clusters are strikingly homogeneous with respect to the linguistic form of their words. Clusters 1 and 2 only contain derivationally complex words with two or more morphemes. The lack of family members of words in these two clusters and their great length, compared to the other clusters, suits the nature of derivationally complex words. Clusters 1 and 2 differ on the other five word properties. Cluster 2 words are longer, learned later, learned more via language, less familiar, less imageable, and less frequent than Cluster 1 words. Of all clusters, Cluster 2 has the highest rates on MoA, AoA, and length and the lowest rates on FAM, IMA, and frequency.
The other five clusters do not or hardly contain derivationally complex words. Cluster 6 contains 97% monomorphemic words; 76.5% of the words are monosyllabic. Of all clusters, Cluster 6 has the highest rates on FAM and IMA; it has the lowest rates on MoA, AoA, and length. Thus, Cluster 6 is precisely the opposite of Cluster 2 with respect to these values.
Clusters 3 and 4 almost only contain monomorphemic words and inflected stems. The division for Cluster 3 is 59.6% monomorphemic words and 41.3% inflected stems, 55.2% are monosyllabic; for Cluster 4 it is 65.2% monomorphemic words and 34.8% inflected stems; 72% are monosyllabic words. Cluster 3 words are learned more via language and at a later age than Cluster 4 words, they are less familiar and imageable and somewhat longer. Cluster 4 and Cluster 3 have the highest and the second highest frequency, respectively, of all seven clusters.
Cluster 5 and Cluster 7 are somewhat more heterogeneous with respect to linguistic form. Cluster 5 contains 54.2% monomorphemic words, 40% inflected stems, and 5.7% morphologically complex words. It has the highest values on MoA and AoA after Cluster 2, so these words are learned late and mostly via language, yet they are much shorter than Cluster 2 words. They have a considerable family size, whereas Cluster 2 words have a family size of zero. Cluster 7 words differ from Cluster 6 words by being less familiar, less imageable, and learned later and more by language; they differ from Cluster 4 words by being more imageable yet less familiar and by being learned later and more by language.
Viewing the different clusters more sociolinguistically, inspection of the first two clusters, which contain words that are very similar in linguistic form, suggests that Cluster 1 contains words that are used much more often in spoken language, whereas Cluster 2 contains words that are used more often in written language. In order to verify this hypothesis, we found 20 adults (14 males, 6 women; mean age = 42.7 years, SD = 13.75 years) willing to judge 80 words on a 7-point Spoken–Written Scale ranging from 1 = used almost only in spoken language to 7 = used almost only in written language. The 80 words ranged from having a very high probability of belonging to Cluster 1 to having a very high probability of belonging to Cluster 2, with in between words that had a more or less equal probability of belonging to Cluster 1 and to Cluster 2. The Cronbach α was 0.92 and corrected item-total correlations all were higher than 0.3, which indicates that the judgments of the participants were reliable. The bivariate correlation between score on the Spoken–Written Scale and probability to belong to Cluster 1 (or Cluster 2) was r = .560**. It is, of course, possible that the participants when judging the 80 words thought more about written word frequency than about whether a word occurred more in spoken or in written language. Therefore, we also performed a partial correlation in which the effect of CELEX frequency was controlled for. The correlation between score on the Spoken–Written Scale and the probability to belong to Cluster 1 (or 2) changed only from .560 to .544, so the effect of frequency seems to be small.
Inspection of the words in the clusters further suggests that Cluster 6 contains mainly very basic, short nouns that every young child knows, such as nouns that refer to body parts, basic food, drinks, clothes, and furniture. Cluster 4 also contains rather basic and short words, but here there are more verbs and especially adjectives than nouns; the verbs refer to actions that occur frequently in daily life (to ask, to draw, to swim, to say) and the adjectives refer to very common predicates such as old, sweet, nice, short, and so forth.
As indicated above, Cluster 3 words have the largest difference between frequency rate and IMA rate of all clusters. Many words in Cluster 3 seem to be very polysemous. A clear example is “drijven,” a Cluster 3 word that can mean to drive (e.g., cattle), to run, to chase, to float, to drift, and to be soaked.
Cluster 5 words are of a rather different nature. Although they have the same linguistic form as words in Clusters 3, 4, 6, and 7 (see above), they seem to be words that occur more often in texts for the higher grades of elementary school. Cluster 5 contains a considerable number of Latin and Greek loan nouns, such as “risico” (risk), “liter,” “kg” (for kilogram), and “kolom” (column). A comparison between Cluster 5 and Cluster 3 is interesting both because of the similarities and the differences between them. Both clusters contain relatively many verbs and they differ hardly in IMA, but Cluster 5 words are learned much later and are much less frequent than Cluster 3 words. Whereas Cluster 3 words are low in IMA because they get their IMA in the context of use, Cluster 5 words are low in IMA because of their high level of abstractness (e.g., risk, liter). Because of their higher polysemy, Cluster 3 words are used more often and thus are more frequent than Cluster 5 words, and they probably are learned earlier because children encounter them much more often.
Cluster 7 is somewhat more difficult to interpret.Footnote 1 As mentioned above, these words are more imageable than Cluster 4 words but less imageable than Cluster 6 words, and less familiar than both Cluster 4 and Cluster 6 words. Cluster 7 contains words like castle, police, class, reader, eraser, and harbor. These seem to be school words or story book words more than spoken language words—but they are words the child encounters in the first years of elementary school.
Overall, it seems that Cluster 6 and Cluster 4 words are “easy” words, whereas Cluster 2 and Cluster 5 words are “difficult.” In Experiment 2 we empirically verify these hypotheses.
Table 3 above shows correlations between word properties. These can be explained by assuming that the patterns of word properties mirror a stable underlying property of language. Reilly and Kean (Reference Reilly and Kean2007) used the example of man → manliness to illustrate that affixation in general is used to form an abstract word from a concrete stem. This, in turn, has consequences, for instance, for word length and neighborhood size. In this way, different properties are related, and this relatedness becomes explicit especially when patterns of word properties, instead of single word properties, are being researched. The idea that patterns in word properties mirror a linguistic phenomenon could account for the clusters we found. Furthermore, similar patterns of word properties can probably be found in other languages as well. Studies with morphological family size have shown that response latencies in one language can be predicted by family sizes in another language. This existence of cross-language predictivity suggests the overlap of semantic organization in languages; words that have dense semantic neighborhood sizes in one language also tend to have dense semantic neighborhood sizes in other languages (Martin, Bertram, Haikio, Schreuder, & Baayen, Reference Martin, Bertram, Haikio, Schreuder and Baayen2004; Martin et al., Reference Martin, Deutsch, Frost, Schreuder, De Jong and Baayen2005).
EXPERIMENT 2
We used three sets of data, collected in earlier studies, to empirically verify the seven-cluster model. In two of these data sets the same target words were used, whereas in the other data set another sample of target words was used. All target words came from the 703 words analyzed in Experiment 1. As discussed in the introductory section, two word tasks were involved in these studies, namely, lexical decision on words and pseudowords, and use decision, in which the participants have to select from four short sentences the one in which the target word is used semantically correct (see introductory section).
Participants
Participants of Data Set 1 were 448 children (236 boys, 212 girls) from Grades 2 (n = 167), 3 (n = 146), and 4 (n = 135) from four elementary schools in a middle-sized town in the east of The Netherlands. Data Set 2 contained data from 40 grade 2 children (22 boys, 18 girls).Footnote 2 They came from an elementary school in a middle-sized town in the south of The Netherlands. Data Set 3 contained data from 252 children (123 boys, 129 girls) from 16 elementary schools throughout The Netherlands, from grades 3 (n = 93) and 4 (n = 159).2 They were in Grades 3 and 4. We only had data from the entire group; the data were not differentiated according to grade. All participants spoke Dutch at home and none of the participants had diagnosed handicaps.
Materials
The 448 children from Data Set 1 made a use decision task with 90 words. The 40 children from Data Set 2 made a lexical decision task with these same 90 words. The 90 words were not selected totally randomly from the 703 word sample, but based on an earlier, less sophisticated cluster analysisFootnote 3 in which a three-cluster model was found; 30 words from each cluster in the three-cluster model were randomly selected. In the seven-cluster model, the division of the 90 words turned out to be as follows: 25 in Cluster 1, 8 in Cluster 2, 12 in Cluster 3, 20 in Cluster 4, 5 in Cluster 5, 13 in Cluster 6, and 7 in Cluster 7.
The 252 children from Data Set 3 completed a use decision task with 180 words. These words were randomly selected from the 703 word sample; the data were not collected in the framework of any cluster analysis. In the seven-cluster model, the division of the 180 words turned out to be as follows: 58 in Cluster 1, 44 in Cluster 2, 20 in Cluster 3, 19 in Cluster 4, 10 in Cluster 5, 13 in Cluster 6, and 16 in Cluster 7. The 90 words from Data Sets 1 and 2, and the 180 words from Data Set 3, overlapped in 24 words.
For the lexical decision tasks we created 90 pseudowords by selecting from CELEX, for each target word, a word that was similar with respect to consonant–vowel structure and word class, and, if possible, similar with respect to length and frequency. This ensured that variation in structure, word class, length, and frequency of the pseudowords approximately mirrored similar variations in the target words. The selected word was then altered by one or two letters to create a pseudoword that followed phonotactic and orthographic constraints of the Dutch language. Words and pseudowords were randomized and put on lists in four different orders, printed and duplicated.
For the use decision task, we made four short sentences for each target word, all four being syntactically and morphologically correct. However, only in one of the four sentences the target word was used semantically correct (e.g. “the candle burned” vs. “the candle walked,” “the candle slept,” “the candle read”). Thus, we distinguished the sentences by semantical context. The words surrounding the target word were chosen such, that they can be assumed to be known by most elementary school children. Furthermore, while constructing the alternatives we took into account the vivid imagination of children. The target words with their accompanying four sentences were put on lists in four different orders, printed, and duplicated.
Procedures
All tasks were in-class paper and pencil tasks, made either under the supervision of students as part of their master thesis in education (Data Sets 1 and 2) or under the supervision of the second author (Data Set 3). There was no time limit on the tasks. Although in most cases lexical decision tasks are made under time pressure, as explained in the introductory section this is not always the case—it depends on the objective of the particular task. Because we wanted to know for each and every word whether or not the children recognized it as an existing Dutch word, we did not use time pressure. If they recognized a word, they probably would have at least some semantic knowledge of that word. Semantic knowledge of words partly determines results on lexical decision tasks (Burani, Marcolini, De Luca, & Zoccoloti, Reference Burani, Marcolini, de Luca and Zoccolotti2008; Kavé & Levy, Reference Kavé and Levy2005).
For the lexical decision task, participants were asked to cross out each pseudoword. For the use decision task, participants were asked to circle the sentence in which the target word “is used best.” This formulation was chosen, instead of asking about “correct” usage of the target word, in order to prevent participants from circling sentences that could occur in children's story books but not in real life (for instance “the elephant laughed,” which was not an alternative in our materials), although when constructing the materials we avoided such sentences as much as possible. Explanation with several different examples was provided to the participants before they did the task. The participants did not know about the clusters.
Results and discussion
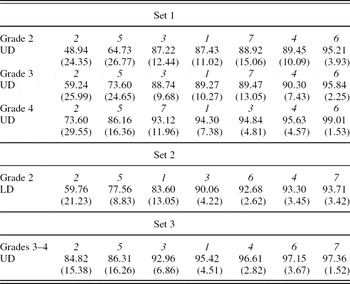
For the analyses, not the children but the words were the cases. Scores of words in the lexical decision task were measured as the percentage of children that correctly accepted a given item as a word, that is, the percentage of children that did not cross out the word. Scores of words in the use decision task were measured as the percentage of children that circled the right alternative for the target word. Mean percentages of correct responses for the words in the seven clusters, in the three data sets and for different groups, are given in Table 4. They are ordered from lowest mean to highest mean.
Mean (standard deviation) correct on words from seven clusters, for three data sets, on lexical decision (LD) and use decision (UD) tasks

Note: Number of words: Sets 1 and 2 = 90, Set 3 = 180. Number of children: Set 1 = 448, Set 2 = 40, Set 3 = 252.
In all three data sets, for all grades and for both tasks, Cluster 2 has the lowest mean percentage of correct responses followed by Cluster 5. Cluster 1 comes as third in the lexical decision task, in all use decision tasks it comes as fourth. Cluster 3 comes three times as third, one time as fourth. Cluster 7 seems to be the most irregular with respect to mean percentage of correct responses in relation to the other clusters. However, it should be noticed that the differences in scores sometimes are very small especially to the right side of Table 4.
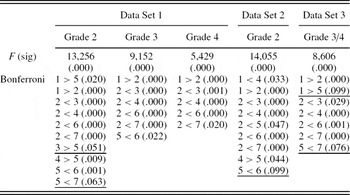
We performed one-way analyses of variance with Bonferroni adjustments in order to investigate whether the means differed significantly. Table 5 shows the significant and marginally significant differences, and the direction of the differences. We also give marginal significances (with p values between .050 and .099), in order to show trends. Differences not listed in Table 5 have p values of .1 or larger.
Results of analysis of variance with Bonferroni adjustments for three samples of data, for seven clusters

Note: Marginal significances are underscored.
As Table 5 shows, significant differences are found more often for the younger children, but in all cases Cluster 2 differs significantly, having the lowest mean, from all other clusters except Cluster 5. In Data Set 2 we also find a significant difference between Cluster 2 and Cluster 5. Cluster 5, with the second lowest mean, differs from several clusters other than Cluster 2 in all groups except in grade 4 from Data Set 1. For Grade 2 in Data Set 2 we also find that Cluster 1 has a lower mean than Cluster 4.Footnote 4
To conclude, we discuss which co-occurring word properties make words difficult or easy in Dutch, but probably also in many other languages. Words that are learned late and mainly via language, with low IMA and low FAM ratings tend to be the most difficult: Clusters 2 and 5 score the most extreme on these four word properties. Length, frequency, and family size also contribute to word difficulty, but in a more variable way. Although the easiest Clusters 4 and 6 have the shortest words and the hardest Cluster 2 has the longest words, Cluster 5 words, second in difficulty, are third in length, at a considerable distance (see Table 2). In addition, Cluster 1 words, second in length, are third or fourth in difficulty. Great length seems to be counterbalanced when words have good IMA scores and are acquired at a relatively young age (i.e., Cluster 1).
The hardest Cluster 2 has the least frequent words but the second hardest Cluster 5 is only fourth least frequent, whereas the easiest Cluster 6 is only third most frequent. The cluster with the highest frequency by one, Cluster 3, is only the fifth or fourth easiest, probably because these words must be learned mainly by language and have relatively low IMA.
Clusters 1 and 2 both have zero family size but are quite apart in difficulty; the cluster with the highest number of family members, Cluster 3, is far from being the easiest, again probably because of its low IMA and its acquisition mainly by language.
GENERAL DISCUSSION
In the present study, we tried, first, to identify groups of words that share particular configurations of word properties, other than the two groups found in many earlier studies, namely, long, infrequent, late-learned, and so forth words versus short, frequent, early-learned, and so forth words. Second, we investigated whether such word groups predicted performance of elementary school children on two word tasks.
To reach the first objective, we performed a latent cluster analysis on a large group of words with scores for eight word properties; the words were selected from very often used Dutch tests for the end of elementary school. A model with seven clusters turned out to have the best fit according to different analyses. For empirically verifying the seven-cluster model, we used three data sets with data from Grade 2 to 4 children who either had to decide whether or not a given letter string is a word in the target language, or had to choose from four alternatives in which short sentence the target word was used best. When ordering the mean scores on the seven clusters from lowest to highest, for the different samples of children, patterns were very similar: Cluster 2 and then Cluster 5 had the lowest means, Clusters 4 and 6 had the highest means, Clusters 1 and 3 were in between. Only Cluster 7, which turned out to be a residual cluster, was somewhat deviant. Statistical analyses confirmed these patterns for Cluster 2 and to a lesser degree for Cluster 5, and once for Clusters 1 and 4. The differences between the other clusters not being significant probably is caused by the relatively easy tasks and the relatively high age of the children given the ease of words in other clusters than Clusters 2 and 5.
A tentative developmental order can be sketched based on the seven clusters. Cluster 6 contains mainly very simple and concrete nouns; many of them will be among the first thousand words babies and toddlers learn. Cluster 6 and Cluster 4 seem to contain many of the basic words learned by experience that children need for “bootstrapping” (Gleitman, Cassidy, Nappa, Papafragou, & Trueswell, Reference Gleitman, Cassidy, Nappa, Papafragou and Trueswell2005): using basic and simple words for acquiring more complex words, mainly by morphological decomposition of complex words. These more complex words we find in Clusters 1 and 2; Cluster 1 words seem to be acquired more in spoken language contexts, whereas Cluster 2 words are acquired in written language contexts. The less linguistically complex words in Cluster 5 also are learned at a later age but morphological decomposition probably will play a smaller part in the acquisition process, many of these words being loan words. Cluster 5 words will be acquired more often via direct mapping. Cluster 3 words would be somewhere in the middle of the developmental order: for age and MoA and for FAM three clusters have higher values and three clusters have lower values than Cluster 3; four clusters have higher values for IMA and length; yet Cluster 3 is second on frequency and has the highest values on family size. These values show Cluster 3 words to be relatively difficult yet very useful words.
This cluster analysis was performed on words from very widely used (in The Netherlands) tests for the end of elementary school. Most plausibly, they reflect the view of the test makers (i.e., language specialists and teachers, see the Method section of Experiment 2) on what type of words children at the end of elementary school should know. A view on the number of words in each cluster might partly reveal this view: remember that the clusters were sorted by the number of words they contain, Cluster 1 having the highest number and Cluster 6 (apart from residual Cluster 7) having the lowest number of words. Experiment 2 shows that the smallest cluster, Cluster 6, is also the one with the easiest words. Children at the end of elementary school are not language laymen anymore. Yet, they are no adults either, so the clusters with the hardest words (i.e., Cluster 2 and Cluster 5) are not the largest clusters.
A rather remarkable result of the cluster analysis is, that although the eight word properties for the greater part do not refer to word form, in the clusters the words are very homogeneous qua word form: Cluster 1 and Cluster 2 contained only morphologically (very) complex words, whereas most of the other clusters contained almost only monomorphemic or simple inflected words. This finding suggests that word form and particular patterns of (other) word properties interact. Reilly and Kean (Reference Reilly and Kean2007) found a relation between word structure on the one hand and the semantic word property IMA on the other hand. They hypothesized that the relation between form and meaning of words is not entirely arbitrary. They analyzed a corpus of 2,023 nouns with IMA ratings. It turned out that high- and low-imageable words differed on several word structure properties, such as length, affixation, and rate of consonant clustering. Reilly and Kean (Reference Reilly and Kean2007) refer to the relation between word form and word meaning in early language development. For instance, the first words not only are very imageable nouns, but they also are short in length and low in number of syllables because such words are easier to pronounce for very young children. The authors also point to experiments in which adults had to guess the degree of concreteness of nouns from unfamiliar languages by merely listening to the nouns. On some (e.g., Russian) but not all (e.g., Finnish) foreign languages, native speakers of American English scored far above chance level. Reilly and Kean (Reference Reilly and Kean2007) explain this by the fact that Finnish, in contrast to Russian, has a very high rate of compounding of nouns, which makes a relation between form (i.e., compound versus free, unsegmented word) and meaning less likely.
Lewis (Reference Lewis2006) states that many different word properties are relevant for lexical performance, but that the effects of word properties on lexical performance as they have been demonstrated by regularly used methods such as analysis of variance and factorial analysis, can be erroneous. In this context, he discusses the problem of finding more than simple correlations between the many relevant word properties on the one hand and lexical performance on the other hand.
Lewis and Vladeanu (Reference Lewis and Vladeanu2006) try to solve this problem by using structural equation modeling for developing a causal model between different word properties and lexical reaction times. By using a cluster analysis, in the present study we tried to find more than simple correlations, not so much between word properties and lexical performance, but between several different word properties. We assumed that configurations between several different word properties can shed light on the complexity of words. What we found, first, is a relation between word form or word structure and several different nonformal word properties. Second, the cluster patterns allow analyses of word types that go beyond relations between only two word properties, to which correlational analyses are limited. For the sake of brevity, we discuss in more detail only a few configurations of more than two word properties as they can be deduced from the cluster analysis, more particularly configurations of class, frequency and IMA for Clusters 6 and 7 versus Clusters 1 to 5 and configurations of class, frequency, IMA, and AoA for Cluster 5 versus Cluster 3.
We hope that the differentiation in more than two classes of words with respect to “degree of difficulty” that seems to result from the present study, eventually leads to more finetuned educational materials and assessment tests in schools. However, further research is needed then; first, regarding a more detailed analysis of the different clusters, and second, regarding more difficult tasks and/or younger children, such that the differences between the “easy” clusters can be empirically verified better.
ACKNOWLEDGMENTS
We thank Jos Tellings for correcting the English and for some very useful comments on the paper.