INTRODUCTION
More than 60% of the global population lives within 100km of the coast and some predictions of the world's coastal population exceed 6 billion by 2025 (UNEP [United Nations Environment Programme] 2007). Reconciliation of marine resource users’ dependence on declining fisheries with tomorrow's environmental conservation needs is essential (Walmsley et al. Reference Walmsley, Purvis and Ninnes2006). It is likely that Millennium Development Goal 1, to halve the proportion and number of people who suffer from hunger and malnutrition by 2015, will not be met (UN [United Nations] 2009). With these targets in jeopardy, food security, especially in communities socioeconomically dependent on declining fisheries, is high on all political agendas.
Subsistence and artisanal fishing communities are widely supported nutritionally, socially and economically by the goods and services provided by reefs (Adger Reference Adger2000; Allison & Ellis Reference Allison and Ellis2001; Walmsley et al. Reference Walmsley, Purvis and Ninnes2006; Marshall et al. Reference Marshall, Marshall and Abdulla2009). While most marine conservation debates proclaim the significance of understanding important interactions between environmental resources and society (Pomeroy & Douvere Reference Pomeroy and Douvere2008; Charles & Wilson Reference Charles and Wilson2009; Ostrom Reference Ostrom2009; Cinner et al. Reference Cinner, McClanahan and Wamukota2010; Granek et al. Reference Granek, Polasky, Kappel, Reed, Stoms, Koch, Kennedy, Cramer, Hacker, Barbier, Aswani, Ruckelshaus, Perillo, Silliman, Muthiga, Bael and Wolanski2010), marine management initiatives and research often do not adequately explore these interactions. The number of studies combining socioeconomic characteristics with attitudes and perceptions of marine resource users has been steadily increasing over the past decade, with a number of authors (Cinner & Pollnac Reference Cinner and Pollnac2004; Pomeroy et al. Reference Pomeroy, Oracion, Pollnac and Caballes2005; McClanahan et al. Reference McClanahan, Cinner, Kamukuru, Abunge and Ndagala2008) greatly contributing to this expanding field of knowledge. However, the complexity of human behaviour leads to many further questions surrounding both support for and reaction to marine management measures. The findings presented herein offer new empirical evidence to further strengthen support for arguments that could be made by policy makers and managers to demand more balanced consideration and inclusion of the effects of socioeconomic derived behaviours of resource dependent communities on the implementation of marine management measures such as marine protected areas (MPAs).
Illegal fishing and overfishing have been named within the top three threats to tropical coastal resources in many regions around the world, all with a high dependence on fishing (Loper et al. Reference Loper, Pomeroy, Hoon, McConney, Pena, Sanders, Sriskanthan, Vergara, Pido, Vave, Vieux and Wanyoni2008). In the Western Indian Ocean, illegal fishing and a lack of enforcement of fishing regulations have been listed as two of the top three threats to coastal resources (Loper et al. Reference Loper, Pomeroy, Hoon, McConney, Pena, Sanders, Sriskanthan, Vergara, Pido, Vave, Vieux and Wanyoni2008). In view of these statistics and the development of new MPAs, understanding drivers of fisheries noncompliance is essential, especially when enforcement is insufficient.
Each noncompliance driver, in a given situation, could yield different solutions to the need for conservation and sustainable resources. If noncompliance is identified and drivers are found, it is possible to assess whether or not these will be mitigated or exacerbated by management measures such as MPAs. Noncompliance drivers have typically been split into three main categories: deterrence, illegal gains, and moral obligations and social influence (Sutinen & Kuperan Reference Sutinen and Kuperan1999). Deterrence and illegal gains have been recognized from an economic point of view for quite some time, weighing the risk of getting caught with the benefits of conducting the illegal activity. Increased enforcement, although offered as a general solution to noncompliance, will primarily affect deterrence drivers. Moral obligations and social influence build further on the social side incorporating the legitimacy and fairness of the regulations and the enforcers, personal values and moral suasion (Sutinen & Kuperan Reference Sutinen and Kuperan1999; Hatcher et al. Reference Hatcher, Jaffry, Thébaud and Bennett2000; Keane et al. Reference Keane, Jones, Edwards-Jones and Milner-Gulland2008), and may be addressed with outreach and education. Additional socioeconomic factors may also be important; for example, when the catch is low with legal methods, individuals have been known to fish illegally (Honneland Reference Honneland1999). Rather than strict economics, this may ultimately be related to resource dependency, which could lead to ever different management solutions.
MPA-created displacement generally leads to four options for fishers: fish illegally, change fishing grounds, change fishing gears (to an unrestricted gear or species), or move effort to alternate livelihoods (Cinner Reference Cinner2007). The last three choices require either spatial, gear or occupational mobility; all of which should thus be considered in assessing drivers for noncompliance. Although livelihoods research has rarely been directly linked to patterns in compliant behaviour, alternative livelihood programmes have been linked to individual's attitudes towards management and the ultimate success of management (Cheung & Sumaila Reference Cheung and Sumaila2008; Jimenez-Badillo Reference Jimenez-Badillo2008). Despite its association with poverty, fishing has been associated with noneconomic aspects of job satisfaction, such as ease of work, pleasurable work and tradition (Pollnac et al. Reference Pollnac, Pomeroy and Harkes2001; Cinner & Pollnac Reference Cinner and Pollnac2004; Cinner et al. Reference Cinner, McClanahan, Daw, Graham, Maina, Wilson and Hughes2009a). With the high level of job satisfaction associated with fishing, alternative livelihoods for fishers may not be successful if the alternatives do not bring the same levels of satisfaction (Pollnac et al. Reference Pollnac, Pomeroy and Harkes2001). These same factors can attribute to fishers remaining in declining fisheries (Cinner et al. Reference Cinner, Daw and McClanahan2009b) and could potentially play a factor in noncompliant behaviour.
Rodrigues, a semi-autonomous state of Mauritius in the Western Indian Ocean, presents a unique site for study, as its population is highly dependent on the fishery supported by the lagoon that encircles the island and, unlike its big sister Mauritius, it has relatively low industry and tourism, leaving few livelihood opportunities for its populace. Similar to many small island developing states, Rodrigues has low financial capacity, weak fisheries enforcement and a high dependence on natural resources (Briguglio Reference Briguglio1995; Bunce et al. Reference Bunce, Mee, Rodwell and Gibb2009). Combined together these have created a history of noncompliance and degrading fisheries. Like many islands in similar positions, Rodrigues has initiated the development of several MPAs (Christie & White Reference Christie and White2007; Bunce et al. Reference Bunce, Rodwell, Gibb and Mee2008). This study interrogates the complexity of the connections between resource dependent populations and MPA development needs.
The overall aim of this study was to investigate and expand the understanding of noncompliant behaviour drivers and livelihood choice as it relates to MPA development and effectiveness. The hypothesis that use of marine resources is determined by socioeconomic factors (such as food security and income) and livelihood options is tested using field data on human behaviour, attitudes and perceptions within the context of two contrasting communities, one currently (Rivière Banane) and a second (Mourouk) soon to be impacted by MPA implementation. The objectives of this study were to evaluate the extent and drivers of noncompliant behaviour of fishers in a resource dependent community, assess the mobility of the community and whether MPA-caused displacement would mitigate or exacerbate current fisheries challenges, and explore the attitudes of this stakeholder group towards other livelihood opportunities and the differences in these attitudes between different socioeconomic characteristics.
METHODS
Study area
Rodrigues has a population of 37 500, consisting predominantly of fisher-farmers (36% of total employment) with a relatively high level of unemployment (>30% for individuals older than 16 years of age) (CSO [Central Statistics Office] 2007). A government-run fisher registration programme began in 1984; registration is for full time fishers, maintained by monthly checks at landing stations, and is associated with a Bad Weather Allowance. At the end of 2008 there were nearly 1900 fishers registered with the Fisheries Protection Service (FPS) and an estimated 2000 unregistered fishers (FPS, personal communication 2009). Many Rodriguan fishers exist at subsistence or low-income levels. The majority of fishing takes place inside the lagoon, which ranges from 20m in width at its narrowest point in the north-east of the island, to 7km in the south-west of the island (Hardman et al. Reference Hardman, Gell, Blais, Desire, Raffin, Perrine and Chinien-Chetty2006). Primary fisheries in the lagoon include both finfish and octopus; fishers generally use multiple gear types, most of which do not require high financial or knowledge input. At the time of this research, off-lagoon fishing was underdeveloped, however a lack of capacity input (training and financial) was preventing additional growth in this sector.
Shifting baselines have been identified in fishers’ perceptions of species diversity and catch size (Bunce et al. Reference Bunce, Rodwell, Gibb and Mee2008) and recent lagoon catch data characterize the fisheries as having low catch rates and small size classes, including high catches of juvenile fish and octopus (Hardman et al. Reference Hardman, Gell, Blais, Desire, Raffin, Perrine and Chinien-Chetty2006). Rodrigues fisheries have been under a variety of regulations since the late 1800s (including gear, minimum fish size, area and seasonal restrictions), however high levels of noncompliance towards these regulations have been documented since the early 1900s (North-Coombes Reference North-Coombes1971). Noncompliance and poor enforcement have led to the renewal and revision of regulations on several occasions, with little improvement (North-Coombes Reference North-Coombes1971; Bunce et al. Reference Bunce, Mee, Rodwell and Gibb2009).
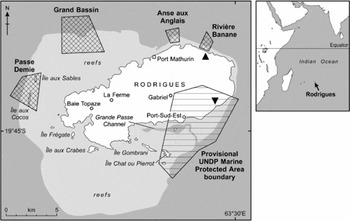
Five MPAs (four no-take marine reserves and a large multi-use marine park) have been designated around the lagoon with the primary goal of achieving sustainable fisheries (Bunce et al. Reference Bunce, Rodwell, Gibb and Mee2008; Fig. 1). These MPAs will create displacement from traditional fishing grounds for many fishers throughout Rodrigues; as such, both projects have listed socioeconomic development goals in addition to goals of fisheries and biodiversity protection and enhancement.
The island of Rodrigues. Light grey = lagoon area, dark grey = deeper ocean. The four no-take marine reserves are shown in the north, with the provisional boundary for SEMPA (the South East Marine Protected Area), the UNDP (United Nations Development Programme) multi-use marine park. Study sites are marked: Rivière Banane (▲) and Mourouk (▼). Adapted from Bunce et al. (Reference Bunce, Mee, Rodwell and Gibb2009), with permission from Elsevier.

Site selection and socioeconomic characteristics
We selected the villages of Rivière Banane and Mourouk by evaluating criteria representing multiple qualities of Rodrigues fishers and fisheries that encompassed the diversity represented within the island's fishing villages. These included: proximity to a MPA, different MPA development stages (existing and planned), levels of tourism impact, accessibility and percentage of population who fish. The number of FPS registered fishers was used as a guideline for full-time fishers during site selection considerations, although the registry has been found to under-represent older and younger fishers in some areas (Bunce et al. Reference Bunce, Rodwell, Gibb and Mee2008). Village size was also a consideration owing to the limited time available.
Rivière Banane is a small village with approximately 150 households, relatively isolated both physically (located within a narrow valley) and through connectivity to the rest of the island (two buses in/out per day). The village has large community gardens and provides the island with a significant portion of its produce. There is very little tourism in the village, limited to snorkelers and scuba divers, who generally arrive via boat, and occasional hikers. There is a no-take marine reserve, enforced since 2008, directly in front of Rivière Banane (Fig. 1).
Mourouk, while similar in size (c. 200 households) to Rivière Banane and home to a similar number of fishers, is less isolated, with a school and shops in the neighbouring village of Port Sud Est, and frequent connections with the rest of the island through hourly running buses. Mourouk has a larger tourism base, with a 30-room hotel as well as a scuba business and two kite- and windsurfing businesses, however its community gardens are smaller than Rivière Banane's. The village is situated directly in front of the area proposed for the United Nations Development Programme (UNDP) MPA (Fig. 1).
Data collection
We used qualitative information, such as local behaviours and responses, gained during previous household socioeconomic surveys we conducted (S. Stead, A. Peterson, A. Mill & S. Rushton, unpublished report 2009), as well as 10 key informant interviews we conducted as a scoping study, to build and refine the survey design for this study. Interviews focused on: (1) current levels and drivers of noncompliant behaviour; (2) current fishing and occupational mobility (spatial mobility, gear mobility, current and previous livelihood diversification and preferences); and (3) development of alternative livelihoods, namely willingness to change to alternative types of work and support required to both develop and sustain new livelihoods. Respondents were asked whether they would do each of 15 specific livelihood options covering a variety of fishing- and water-related work, different types of farming, formal and informal jobs, and tourism-related work. We did not assess further willingness for livelihoods the respondent was currently engaged in.
The survey used as an interview guide in this study was composed in English, translated into the local Creole dialect and checked for accuracy with three native speakers. We piloted the survey in the town of Port Mathurin, and afterwards revised it to enable better flow and comprehension. We met with the president of the fishers association in each study village to discuss the aims of the study and seek advice on the best ways to make contact with the fishers in the village. During these meetings, we also discussed both registered and unregistered fishers in the village and updated our list of registered fishers by adjusting for individuals who had moved in or out of the village.
All houses in the village were visited to enable surveying of unregistered fishers in addition to registered fishers, additional convenience sampling was also completed at landing stations at the end of a tidal cycle and in the community gardens where many fishers worked. We attempted to interview all fishers living in a house; this ensured that data collected included multiple generations and genders. When one or more fishers living at a house were not available, second and third visits were made to try to complete the interviews. Surveys were kept confidential and anonymous, however registered fishers were asked to volunteer their name to serve as a guide of who had been interviewed.
We completed 72 face-to-face semi-structured interviews with fishers in the two study sites (41 in Rivière Banane and 31 in Mourouk), averaging 42 minutes each, between April and May 2009 (Appendix 1, see supplementary material at Journals.cambridge.org/enc). The interviews were completed by A. Peterson with the assistance of a translator who acted as the primary interviewer and was present at all fisher interviews.
Completed interviews represent 75% of the fishers registered with FPS in Rivière Banane, and 73% of registered fishers in Mourouk. In both villages, the female registered fishers represented a larger group than the males (66% Rivière Banane, 56% Mourouk). Villagers were unaware of the numbers of unregistered fishers in each village and estimates were highly variable; however, all given estimates were less than the known number of registered fishers. Unregistered fishers often did not consider themselves fishers; this may be owing to the more recreational nature of their fishing, though some unregistered fishers interviewed stated their primary occupation was fishing. Unregistered individuals who fished would often hesitate, or not agree, to undertake an interview ‘for fishers’. The number of unregistered fishers interviewed was low, a total of 14 from both villages, and thus is not representative of the estimated population.
Data analysis
The semi-structured interviews produced dichotomous variables and free responses generating both qualitative and quantitative data. Free responses were assessed for similar and recurring themes; we coded the data for quantitative entry. The 15 specific livelihood options were placed into six broader categories to discern differences that may be affected by gender roles and where fishers lived, namely water, fishing, land, farming, tourism and working for others; some jobs fell into multiple categories. The water category included livelihood options that would likely work in or around water (including aquaculture); fishing included other gear, fishing for aquarium, aquaculture and study of fishing; the land category included livelihood options not on or in the water; farming was inclusive of planting and animal rearing; tourism included any options that may put the fisher in contact with a tourist; and working for others categorized options that generally require working for someone else, including ranger, salaried jobs, skipper and hotel work. This data was then subject to statistical analysis.
We analysed the data using SPSS version 15.0.1 (SPSS 2006). Pearson and Spearman correlation tests were conducted to determine relationships between demographics, personal preferences and the number of livelihood options that each fisher was willing to consider. We used Mann-Whitney U tests to examine any differences between genders and villages in fishers’ willingness to do other types of work. We used a statistical significance of p < 0.05 for all tests.
RESULTS
Compliance
In Rodrigues, illegal fishing can mean many things to different fishers, part of which may reflect a relatively low awareness of current fisheries regulations and management measures. The most frequent rule or regulation acknowledged by fishers across the island is ‘no fraud’, or no illegal fishing. In this study, examples of illegal fishing included the use of seine nets and nets with small mesh size, snorkelling equipment, batatran (a beach creeper used to catch small fish), fishing inside protected areas, catching small fish and using artificial light.
All fishers interviewed acknowledged noncompliance currently exists in Rodrigues; 87% of the fishers interviewed (n = 72) thought that illegal fishing was a problem and many of those responded that it was ‘a big problem’. Only nine fishers (13%) said that illegal fishing was not a problem. Of those nine individuals, each gave at least one example of a law that was not being respected or a method that was being used in illegal fishing at the time of the survey; three stated that almost everyone or many people were fishing illegally, and four responded that those who practised illegal fishing had to because they had no other alternatives. Fishers also recognized that many individuals were part of the illegal fishing problem. Thirty-six per cent of the fishers said that there were not specific groups and many different people were fishing illegally; a further 38% of the responses stated that ‘everyone’, ‘almost everyone’ or ‘many people’ fished illegally and that ‘illegal fishing is throughout the island’. Many of the fishers (44%) believed that illegal fishing was occurring throughout the year.
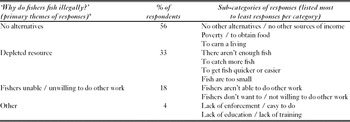
There were three main themes perceived as drivers for illegal fishing: (1) there are no alternatives for food or money; (2) the resource is depleted (fish are not of legal size or there are too few of them, so illegal methods are used to catch more or catch fish more quickly); and (3) fishers are not willing or not able to do other work (Table 1).
‘Why do fishers fish illegally?’ local drivers of illegal fishing as volunteered by interviewees. *Grouped answers do not record multiple responses from one respondent in a group, i.e. if one fisher responded with ‘there aren't enough fish’ and ‘fish are too small’, they would only be counted as one in depleted resource.

Resource depletion
Awareness of marine resource depletion was demonstrated throughout the survey. When questioned about why fishers performed work in addition to fishing (80% of interviewees did another form of work), 40% of the responses included related themes such as ‘there are less fish in the sea’, ‘can't rely on fishing’ and ‘can't earn a living from fishing now’. Many fishers responded that diminishing fish and octopus stocks had led them to spend more time in other work, while others stated that more time was spent trying to get an adequate catch. One fisher said, ‘I spend more time fishing to obtain more, but I still catch less.’ In addressing an individual's time spent fishing now as compared to five years ago, the most common reason for change in the amount of time spent fishing (44%) was to do with diminished resources (followed by tide [17%] and bad sea conditions [14%]). Diminished resources responses to this question did not differ significantly between villages or genders.
Mobility
Fishing mobility
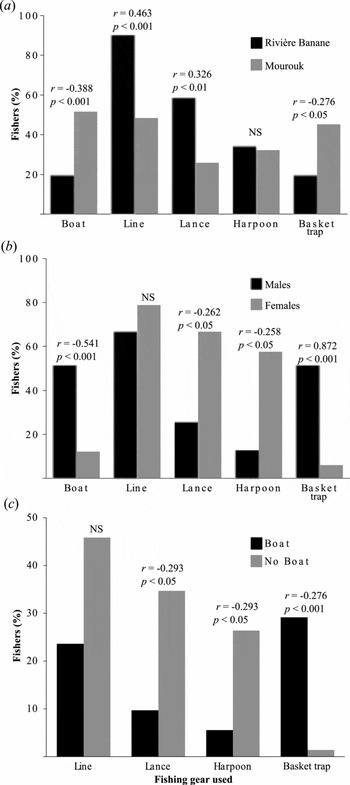
One measurable aspect of spatial mobility in Rodrigues is boat ownership, however many boats used in the lagoon do not have engines. Boat ownership was significantly correlated to the fishers’ village; 19% of the fishers in Rivière Banane owned boats and 51% of fishers in Mourouk owned boats. Gender also played a highly significant role in boat ownership, where male fishers more often owned boats than females (Fig. 2).
The per cent of fishers using each gear type (a) by the fishers’ village, (b) according to gender, and (c) by boat ownership. Pearson r values are shown where there are significant correlations; NS = not significant.

Fishers in Rodrigues generally used multiple gear types (mean = 1.86 gears), all of which require relatively low financial input. Line fishing was the most commonly used gear, although it was often used as a secondary gear. Line fishing was the only method used in the study areas that was not correlated with either the fishers’ gender or boat ownership, however it differed greatly between villages. Fishing with basket traps was typically done by male fishers owning boats, and was more prevalent in Mourouk. The use of lances and harpoons (both commonly used in octopus fishing) was significantly related to both female fishers and fishers without a boat (Fig. 2).
Occupational mobility
Fishing was ranked as the most important occupation in the households of 60% of all fishers interviewed and ranked second in importance by nearly 35% of fishers. Approximately 57% of the fishers interviewed used their catch both to sell and to use for household consumption, 29% used the catch strictly for food, and only 14% of those interviewed exclusively sold their catch. Most fishers gave multiple reasons as to why they fished, common responses included: a way to earn money and run their household (30.6%), fishing was the only job available (23.6%), it was a way to get food (16.7%), they had been fishing since they were young (16.7%), ‘it's my job’ (16.7%), or they liked/loved fishing (9.7%). Fishers had an average of about four years of education (4.7 years in Rivière Banane, 3.8 years in Mourouk).
The majority of fishers (83%) performed work in addition to fishing. In households of interviewed fishers, farming of vegetables (78% of respondents) and animals (28%) were the most common types of additional work done. Fishing was the most important source of food and money for the majority of households interviewed (ranked first in 58% of households, second in 35%). Farming of vegetables was also an important source of food and/or income in the majority of households of interviewed fishers (ranked first in 38% of households, second in 25%). Despite this, many of the fishers interviewed did not consider these forms of agriculture to be a livelihood because it was often done on a small subsistence scale.
Alternative livelihoods
Willingness to change to other livelihoods
Responding to an open-ended question, 21% of fishers did not want to change occupations. Of the remaining 79%, 32% responded that they would like to do any job that either they were capable of, was available, or had a pay or salary, and 38% named a specific job. The most common job response was animal husbandry or starting a larger animal farming business (17%). Other responses, such as planting vegetables, working for the government and construction, were given by ≤3 individuals.
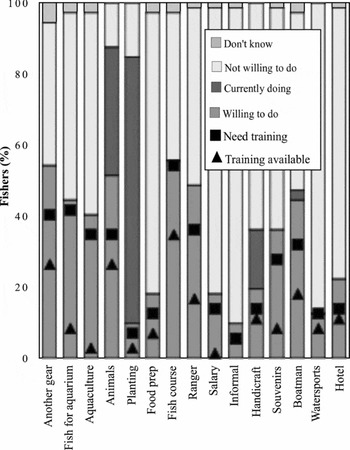
When asked about their willingness to do specific and different livelihood options, 15 choices were offered in total (Fig. 3), fishers were willing to do an average of five of the given options (min = 0, max = 13, mean = 4.85, SD = 2.61). Differences in willingness between villages or genders were only apparent in a limited number of job types. Two jobs had significant differences between villages: fishing for aquarium was higher in Mourouk (Mann-Whitney U Z = −2.145, p < 0.05), and farming animals was higher in Rivière Banane (Z = −3.507, p = 0.000). Two jobs differed significantly between genders: men were more willing to be boatmen (Z = −4.598, p < 0.001) and rangers (Z = −2.612, p < 0.01). Overall mean number of livelihood options each fisher was willing to do did not differ between genders or villages.
Per cent of surveyed fishers willing to do a given specified job or job type (n = 72). Fishers willing to do a given job were asked if they needed training (■) and if that training was available (▲).

Of the 60 fishers who currently did other work, 40% preferred fishing, 38% had no preference between their jobs and 18% preferred work other than fishing (3% did not respond). Work preference was not correlated with the number of livelihood options that fishers were willing to do. However, age played an important role in how many different types of livelihoods each fisher was willing to do; overall willingness decreased with increasing age (Pearson correlation r = −0.372, p = 0.001).
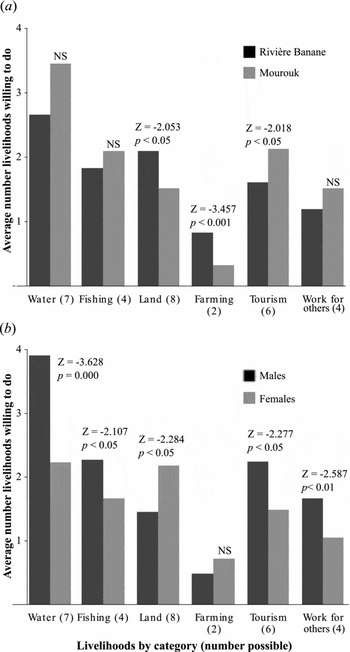
Looking at the preferences towards different categories of work (water jobs, fishing jobs, jobs on land, farming, tourism work and working for others), there were significant differences between genders in five job categories and between villages in three categories (Fig. 4). Female fishers were more willing to do work on land, whereas male fishers were more willing to do work near the water, fishing jobs, tourism jobs, and work for others. Fishers’ willingness towards certain livelihood categories were significantly different in only three categories; land work and farming garnered more willingness in Rivière Banane, and there was more willingness towards tourism jobs in Mourouk.
Average number of livelihood options a fisher is willing to do, by category for (a) villages and (b) genders. Number of options available in a given category shown in parentheses. Mann-Whitney U values shown where significant.

Training needed and aid available
For each type of job given, the majority of the fishers willing to do the job said that they needed training in order to do that work (Fig. 3). However, some of these values were based on small samples (for example n = 7 for agriculture and informal jobs) according to the number of fishers that said they were willing to do each given job. In general, fishers were not aware of training available for the jobs that they were willing to do. In response to an open-ended question regarding aid available for those wishing to change jobs, only 28% of fishers surveyed believed that there was aid available, many were not aware of available aid (46%), and a quarter of the fishers believed that there was no aid available.
DISCUSSION
Compliance
Despite the establishment of the MPA adjacent to the community in Rivière Banane and the multiple regulations on fishing activities, all interviewees acknowledged that illegal fishing happened and most believed that many people were actively fishing illegally. Illegal fishing has been a large problem in Rodrigues since the early 1900s, with the establishment of the first fisheries regulations and fish reserves on the island. In his book, The Island of Rodrigues, North-Coombes (Reference North-Coombes1971) stated that despite knowledge of the laws, poaching in fish reserves was ‘not looked upon as [a breach] of the law’.
A lack of enforcement may have once been the primary driver for illegal fishing, creating a setting in which drivers for compliance such as social influence and moral obligation (Sutinen & Kuperan Reference Sutinen and Kuperan1999; Hatcher et al. Reference Hatcher, Jaffry, Thébaud and Bennett2000) were no longer a strong influence. This lack of social drivers for compliance, while not the immediate underlying reason for illegal fishing during this study, has created a setting in which an extreme level of illegal fishing occurs without the local community persuading against it. A lack of awareness of regulations could also be correlated to early levels of illegal fishing, as there were no formal methods of making fishers aware of the rules up until a few years ago (Fisheries Research and Training Unit, personal communication 2009).
In this study we found continued high levels of noncompliant behaviour towards fisheries legislation, which fishers believed was mainly owing to a lack of alternative livelihoods to fishing available on the island and was exacerbated by depleting and degrading marine resources. To illustrate, one of the fishers surveyed offered the following solution, ‘The best way to have better control over fisheries rules and regulations in Rodrigues is to give the fishers other alternatives.’ While fishers are often aware of their role in the degradation and depletion of fisheries resources, without stable livelihoods they will not change this role (Jimenez-Badillo Reference Jimenez-Badillo2008). Some interviewees expressed anger towards those that fished illegally, identifying illegal practices as one reason for the depletion of fish stocks. This awareness could be due to increased outreach and education in the area that has occurred with planning and development of the MPAs, illustrating that this type of activity could be increasingly used to build social influence towards improved levels of compliant behaviour among marine resource users.
Mobility
Spatial mobility of fishers to switch fishing locations in Rodrigues is constrained by several factors including geography of the village and its corresponding lagoon size, socioeconomic characteristics of the village (such as connectivity) and boat ownership. The majority of fishing in Rodrigues takes place inside the lagoon, which ranges significantly in width around the island. The breadth of lagoon in front of a given village may be a key factor in determining the fishing gears used and the ownership of boats. The narrow valley encompassing Rivière Banane restricts the width of the lagoon that is easily accessed from the land, and the reef marking the edge of the lagoon is relatively close to the shore (a few hundred metres). The lagoon in front of the village is relatively narrow and much of the area is easily accessible by wading. The no-take marine reserve now restricts much of the area easily accessible to Rivière Banane residents. The width of the lagoon directly in front of Mourouk opens up to >3 km, with a mapped channel leading outside the lagoon; these factors could account for the higher number of boats that were in the area. The combination of wading and boat usage in Mourouk gave the fishers not only more spatial mobility, but also more gear mobility, as basket traps are almost exclusively deployed from boats. However, much of the sea in front of the village of Mourouk is enclosed within the proposed MPA boundaries, and the types of closures that are designated could further limit the moderate gear and spatial mobility. Fishers may incur increased time and fuel costs in travelling further if nearby fishing grounds are restricted.
There were a limited number of fishing methods used in the lagoon and fishers generally only used about two methods (mean = 1.86). The lagoon was considered highly depleted and the number of fishers had led to an overcapacity. Off-lagoon fishing was considered underdeveloped and would require large capacity inputs for further growth. Taking these factors in consideration, fishing mobility was rather low and displacement of fishers is unlikely to be mitigated by movement of location fished or by using different gears.
Occupational mobility in Rodrigues was also considered low; the island's lack of industry, low levels of tourism and high unemployment rate (>30%) did not leave many local livelihood opportunities. The majority of fishers stated that they fished because there was no other way for them to get food or money, suggesting that they had fallen into the poverty trap that is often associated with small-scale fisheries (Bene Reference Bene, Neiland and Bene2004). Many fishers had been fishing for most of their life and fishing was a job that they knew well and were comfortable with. Those that offered this as their reason for fishing could potentially fit into the other responses given for fishing: it was a job that they were capable of doing to get food and money, it had been the only job available to them since they were young, they loved fishing, or some combination of the three.
Artisanal fishers tend to naturally diversify their work so as to decrease the risks that naturally come from factors such as weather, seasonal or other natural variations in stocks (Allison & Ellis Reference Allison and Ellis2001). Rodrigues fishers followed this norm, with the majority involved in a variety of agriculture and other livelihoods. While this diversification is important, fishing was still the primary source of income for the majority of the fishing households. Though many fishers were experienced in planting, this was not considered a sustainable option as freshwater shortages have been common, freshwater demand was expected to triple by 2020 (Bunce et al. Reference Bunce, Mee, Rodwell and Gibb2009) and some individuals believed the market for produce may already be flooded (Hardman et al. Reference Hardman, Blais, Desire, Raffin, Perrine and Gell2007). In addition to a lack of livelihood opportunities, occupational mobility of fishers could be further limited by education levels and lack of experience in other types of work. Finding appropriate livelihoods for the individuals affected, especially as fishers differ in the livelihoods they would consider doing, and providing support and training in these livelihoods, will be extremely important for the success of livelihood programmes and the eventual effectiveness of the MPA. Our findings indicated that variables such as age and gender also need to be considered in developing livelihood enhancement programmes.
Without mobility in either fishing or alternative livelihoods, the displacement of fishers caused by MPAs will cause significant stress to the income potential and food security of those affected by the closures. Displacement caused by MPAs will be increasingly significant around the world, and especially in areas such as small-scale fisheries associated with poverty, small island developing states with low economic development and industry, and very isolated communities. Without comprehension of the socioeconomic systems in these areas, management systems will likely come under heavy criticisms and a lack of support from locals, both of which have been known to be noncompliance drivers diminishing the effectiveness of management measures like MPAs.
Alternative livelihoods
Relationships have been found between enhanced livelihood options and community goals and increased commitment to fisheries management and sustainability of management tools such as MPAs (Cinner & Pollnac Reference Cinner and Pollnac2004; Pollnac & Pomeroy Reference Pollnac and Pomeroy2005; Pomeroy et al. Reference Pomeroy, Oracion, Pollnac and Caballes2005; McClanahan et al. Reference McClanahan, Marnane, Cinner and Kiene2006, Jimenez-Badillo Reference Jimenez-Badillo2008). However, when speaking with fishers in Rodrigues it was clear that for most it was a way of life rather than a job; as one fisher said, ‘I will always find time to go fishing.’ Many fishers expressed their passion for fishing during their interview, though it is evident through their responses and the data analysed that the depletion of the marine resources was having a serious effect on their lives. Fishers were willing to do other work, and while this may be partially or even solely as a result of the declining fisheries, it was still arguably one of the most important factors in developing livelihoods for fishers. If livelihood schemes aim to successfully reduce or replace previous livelihoods such as fishing, it is important that the target audience wants to do the new work, otherwise it is quite probable that they will continue with their old methods.
While most fishers in our study were willing to pursue at least some other livelihood options, unwillingness towards certain jobs may not be accurately represented due to inconsistencies in the interview process and the knowledge of the individual being interviewed. Some jobs offered were more categorical and examples were given; from personal observation of the interviews, some fishers said ‘no’ immediately when one example was given and thus declined a specific job rather than the category. For example, one of the examples given for informal employment was taxi driver, many individuals immediately responding with unwillingness towards that specific job. In some options, such as aquaculture, fishers were unaware of what the option was or what would be involved in the work. Because of these, overall willingness (mean number of livelihood options fishers are willing to do) for other work is likely to be stronger than the data suggests.
Studies have found mixed results on whether fishers will welcome initiatives to create alternative livelihoods (Pollnac et al. Reference Pollnac, Pomeroy and Harkes2001; Jimenez-Badillo Reference Jimenez-Badillo2008). However, authors have hinted and implied that personal and cultural importance of fishing and being on or near the sea, livelihood preference, job satisfaction and occupational mobility can all affect the success of sustainable livelihood development schemes and compliance with marine management regulations (Xydias Reference Xydias1956; Pomeroy et al. Reference Pomeroy, Pollnac, Katon and Predo1997; Pollnac et al. Reference Pollnac, Pomeroy and Harkes2001; Cinner Reference Cinner2007; Marshall et al. Reference Marshall, Marshall and Abdulla2009). If fishers find satisfaction in fishing, they may not be willing to turn to other livelihoods, despite conservation measures. Pomeroy et al. (Reference Pomeroy, Pollnac, Katon and Predo1997) found that fishers in the Philippines had a high job satisfaction, suggesting that rather than encouraging alternative livelihoods, supplementary livelihoods would probably have the best results. They recommended encouraging diverse supplemental jobs, reducing the amount that was fished rather than eliminating their fishing activity. The same study's preliminary findings showed different groups were more willing to change jobs: those that had held a non-fishing job in the past, fishers that earned less than half their income from fishing and those that have a source of income other than fishing, as well as those who had been fishing for a shorter period of time. The present study found that age had an effect on overall willingness to change jobs, while gender and village can have an effect on willingness towards specific jobs.
Job satisfaction, and the subsequent willingness to change occupations, may come to be an important factor in compliance in MPAs that have a high level of displacement. As suggested in livelihoods literature, the best course of action would be the development of a diverse array of livelihoods (Allison & Ellis Reference Allison and Ellis2001). A wide range of livelihood options would more likely account for the different interests of the displaced fishers, as well as common concerns such as flooded produce markets. Overall willingness is not affected by either village or gender, but it is important to appropriately look at the differences between demographics (gender and age) and socioeconomic characteristics of the fishing communities when deciding what livelihoods to develop. The solution in one village may not be the solution in another village, even in areas with seemingly similar cultural, social, and economic characteristics (Pollnac et al. Reference Pollnac, Pomeroy and Harkes2001). Gender roles are common in many countries and cultures; within this study gender differences are suggested in nearly every sub category of work type. These gender differences should be relatively consistent throughout the island owing to the social structure and social norms present. Financial aid, training and support need to be addressed in situations with low occupational mobility, as this support can encourage livelihood development and limit negative effects of displacement.
CONCLUSIONS
Relationships between livelihoods and compliance behaviour were strong among communities located close to MPAs in Rodrigues. In many coastal nations, food and income security are at risk, placing pressure on governments to come up with solutions, and in respect to fisheries and marine resources these solutions are likely to be or include MPAs. However, if MPAs are enforced without first addressing why current fisheries are unsustainable, then this study has reinforced the argument that effectiveness of the protection goal will be put at risk and is likely to fail.
In addition to the current ecological parameters, three primary social parameters need to be assessed before any new closures are put in place: current levels and drivers of noncompliant behaviour, occupational mobility and alternative livelihood development, including the preferences and willingness of affected stakeholders to consider different livelihood options. Human and fiscal resources could be more appropriately allocated allowing for more focused and effective management strategies within the social considerations of the local population concerned. Here, the island had high dependence on marine resources, low occupational mobility caused in part by limited livelihood opportunities, a long history of noncompliance and low enforcement combined with a lack of trust in the enforcing agency; these are all factors common throughout the world's tropical coastal fisheries. The primary drivers of fisheries management noncompliance in Rodrigues were considered to be lack of food and income security (depleted marine resources and limited livelihood options). The fishers in Rodrigues were, in general, willing to do other forms of work, however the specific type and number of jobs each was willing to do was influenced by age, gender and village. These variables need to be considered when developing livelihoods programmes.
Focusing current management resources on research and development of appropriate livelihoods in Rodrigues will greatly increase the effectiveness of any MPAs developed in the future. This study strengthens the evidence base for mitigation of socioeconomic effects of MPAs on communities highly dependent on marine access for food and income security.
ACKNOWLEDGEMENTS
Newcastle University and Project AWARE supported this research. Our special thanks go to Shoals Rodrigues, for logistical support and local knowledge, and the people of Rodrigues, without whose co-operation this study would not have been possible. We also thank P. Chaniotis, C. Fitzsimmons and two anonymous reviewers.