Introduction
Human colonization and exploration of the Earth's continents is almost complete. Dispersal of modern human populations from Africa to the other continents began c. 65 000 years ago, but mankind only reached Antarctica within the last 200 years (Mellars Reference Mellars2006, Headland Reference Headland2009). Today few areas of the Earth's continents remain unvisited and therefore free from direct human impacts. Rarer still are areas that are known categorically to be unvisited, yet these locations will become increasingly valuable for science in the near and more distant future (Njastad Reference Njastad1998). Such areas may be represented in Antarctica in higher numbers and at greater spatial scales compared to other continents due to the relatively late arrival of humans and continuing low numbers of people present on the continent.
Human activities undertaken in Antarctica during the ‘Heroic Age’ of exploration during the late 19th–early 20th century were at a low level and largely limited to the areas around coastal expedition huts and the routes of a small number of well known inland traverses (Blanchette et al. Reference Blanchette, Held, Jurgens, Aislabie, Duncan and Farrell2004, Headland Reference Headland2009). A major upsurge in the intensity of human contact with Antarctica was initiated during the International Geophysical Year of 1957/58, which has been maintained and expanded subsequently. During the past c. 65 years, the scale of human activity has increased substantially. In that time, 28 National Governmental Antarctic Programmes (NAPs) have located research stations and other infrastructure throughout the continent, although predominantly on ice-free coastal areas to facilitate easy access by ship. To date, over 120 year-round research stations have been constructed within the Antarctic Treaty area as a whole (south of latitude 60°S) and 49 within the Antarctic Peninsula region. Around 75 year-round stations are currently occupied, with up to c. 4000 personnel during the summer, reducing to around 1000 personnel in winter (Headland Reference Headland2009, COMNAP 2010). More stations are planned or under construction. From these logistic hubs, substantial science and survey work has been performed at sites dispersed throughout Antarctica. Personnel and equipment are inputted by aircraft, ship or via overland journeys involving vehicles such as tractor trains or skidoos or, in the past, by man-hauling and dog-sledge.
The tourism industry has developed largely since the 1980s and, in terms of simple numbers, brings more people to Antarctica than the NAPs; current tourist numbers are around 30 000 per year supported by a further ∼15 000 staff and ships’ crews. The majority of tourists visit Antarctic on cruise ships, with tourist landings focussed at a few ice-free locations on the northern Antarctic Peninsula (e.g. 55% of tourist landings occur at just eight sites) (Lynch et al. Reference Lynch, Crosbie, Fagan and Naveen2010). Compared with the NAPs, tourists spend 20 times less time on the continent overall, and have little permanent land-based infrastructure (Jabour Reference Jabour2009, IAATO 2010).
Why do we need to know where we have been?
A clear understanding of the distribution of past ground-based field activities has clear benefits for environmental management by:
a) identifying areas at potential risk of cumulative environmental impact both around and away from research stations and visitor sites (Kennicutt et al. Reference Kennicutt, Klein, Montagna, Sweet, Wade, Palmer, Sericano and Denoux2010),
b) identifying regions that may already have been impacted by non-native species introductions, thereby allowing policy makers and operators to implement appropriate biosecurity measures (Hughes & Convey Reference Hughes and Convey2010),
c) revealing impact-free areas that may be preserved for future science or wilderness values (Njastad Reference Njastad1998),
d) informing the future designation of protected areas so they can be managed systematically under the Antarctic Treaty protected area system (see: http://www.ats.aq/e/ep_protected.htm).
Recognition of the need for areas protected as pristine and largely unvisited sites is not new. Forty years ago, Cameron suggested that a ‘conservative attitude towards preservation and pollution of the Antarctic also may be in order at this time so as to maintain some of its pristinity for future generations’ (Cameron Reference Cameron1972). At a joint Scientific Committee for Antarctic Research (SCAR)/International Union for Conservation of Nature (IUCN) workshop on Antarctic protected areas in 1992, it was suggested that extensive areas ‘could serve as valuable biologically and chemically uncontaminated sites, never visited by people or overflown by low-flying aircraft’ (Lewis Smith Reference Lewis Smith1994; Appendix 1). Six years later, the report of the ATCM Antarctic Protected Areas workshop (23 May 1998, Tromso, Norway) suggested that large areas of pristine or near pristine nature should be set aside for a long time (Njastad Reference Njastad1998). In terms of priority for protection, areas kept inviolate from human interference were allocated the highest level of priority as ‘if we wait too long, hardly any sites will be left where impact has not already occurred, due to the increasing pressures of visits to previously unvisited sites’. Little progress has been made towards this goal in the intervening 13 years.
Human impacts
Given Antarctica's vast size (14 000 000 km2), lack of indigenous population and relatively few visitors to the region, it could be assumed that environmental impact was negligible (COMNAP 2010, IAATO 2010). However, this is not the case due to the heterogeneous spatial distribution of human activities throughout the continent that has put the terrestrial environment under increasing pressure in some areas. Over a number of years, visited and inhabited sites can experience a range of impacts including chemical pollution (Wilkness Reference Wilkness1990, Sheppard et al. Reference Sheppard, Claridge and Campbell2000, Bargagli Reference Bargagli2005, Santos et al. Reference Santos, Silva, Schaefer, Alburquerque and Campos2005, Tin et al. Reference Tin, Fleming, Hughes, Ainley, Convey, Moreno, Pfeiffer, Scott and Snape2009, Kennicutt et al. Reference Kennicutt, Klein, Montagna, Sweet, Wade, Palmer, Sericano and Denoux2010), sewage release (Hughes Reference Hughes2003, Reference Hughes2004, Hughes & Blenkharn Reference Hughes and Blenkharn2003, Conlan et al. Reference Conlan, Kim, Lenihan and Olivers2004, Smith & Riddle Reference Smith and Riddle2009) and disturbance of local plant, bird and marine mammal populations (ASOC 2004, Braun et al. in press), while the introduction of non-native species on ships, aircraft, cargo, food and visitors’ clothing may threaten vulnerable Antarctic ecosystems (Frenot et al. Reference Frenot, Chown, Whinam, Selkirk, Convey, Skotnicki and Bergstrom2005, Whinam et al. Reference Whinam, Chilcott and Bergstrom2005, Lee & Chown Reference Lee and Chown2009a, Reference Lee and Chown2009b, Hughes & Convey Reference Hughes and Convey2010, Hughes & Worland Reference Hughes and Worland2010, Hughes et al. Reference Hughes, Convey, Maslen and Smith2010). Furthermore, poor environmental practice, generally pre-dating the implementation of the Protocol on Environmental Protection to the Antarctic Treaty (also known as the Madrid or Environmental Protocol; signed in 1991, entered into force 1998; ATCP 1991) has left a legacy of abandoned waste dumps and contaminated ground in the marine and terrestrial environments around some research stations (Tin et al. Reference Tin, Fleming, Hughes, Ainley, Convey, Moreno, Pfeiffer, Scott and Snape2009). Tourist impacts may also be magnified by concentration at a few highly-visited locations, although site-specific guidelines have been produced to keep environmental impact to a minimum (Lee & Hughes Reference Lee and Hughes2010) (see the Antarctic Treaty's site guidelines for visitors at http://www.ats.aq/e/ats_other_siteguidelines.htm, and International Association of Antarctica Tour Operator (IAATO) guidelines at http://www.iaato.org/guidelines.html).
At more remote locations, even short duration visits by small numbers of people can cause negative environmental impacts. Multiple field activities at a remote location, individually assessed to have a ‘less than minor or transitory’ impact, may together amount to a substantially greater degree of impact (France 2008). Examples may include:
a) the homogenization (genetic dilution) of Antarctica's biota through human-mediated transfer of native Antarctic species (Frenot et al. Reference Frenot, Chown, Whinam, Selkirk, Convey, Skotnicki and Bergstrom2005, Chown & Convey Reference Chown and Convey2007, Hughes & Convey Reference Hughes and Convey2010),
b) introduction of non-native species including the long-term contamination of pristine sites by human-associated microbiota (Meyer et al. Reference Meyer, Morrow and Wyss1963, Cameron Reference Cameron1972, Broady & Smith Reference Broady and Smith1994, Nedwell et al. Reference Nedwell, Russell and Cresswell-Maynard1994, Sjoling & Cowan Reference Sjoling and Cowan2000, Baker et al. Reference Baker, Tow and Cowan2003),
c) engine emissions and chemical pollution (Bargagli Reference Bargagli2005, Tin et al. Reference Tin, Fleming, Hughes, Ainley, Convey, Moreno, Pfeiffer, Scott and Snape2009),
d) direct physical impacts at sites of concentrated activity (Chen & Blume Reference Chen and Blume1997, Campbell et al. Reference Campbell, Claridge and Balks1998, Tejedo et al. Reference Tejedo, Justel, Benayas, Rico, Convey and Quesada2009, Braun et al. in press).
Before the implementation of the Environmental Protocol, waste was often discarded in the field. Dog sledge travel resulted in the widespread deposition of dog faecal waste in limited areas such as the Peninsula (Walton & Atkinson Reference Walton and Atkinson1996). In recent years, regional warming in the Antarctic Peninsula has caused a decrease in permanent snow cover and previously buried toilet pits, depots and food dumps have melted out (Fox & Cooper Reference Fox and Cooper1998, Hughes & Nobbs Reference Hughes and Nobbs2004). In other areas, fuel and food depots have been lost due to snow accumulation.
For a given location, quantifying the impact of an individual activity has limited practical use, unless it can be placed in the context of the total impacts at that site over time, i.e. cumulative environmental impact. Generally, the assessment of the cumulative environmental impact of man's activities is rarely undertaken at major centres of activity in Antarctica, and has received little attention at more dispersed locations away from the hubs of human activity (Hughes Reference Hughes2010, Kennicutt et al. Reference Kennicutt, Klein, Montagna, Sweet, Wade, Palmer, Sericano and Denoux2010).
Availability of existing information
Much of the activity of the tourism industry over the past 20 years is freely available as location-specific data (see IAATO 2010). In that time over 2 000 000 person landings have been made at around 337 coastal Peninsula locations. In contrast, information detailing the exact locations of NAP past activities is not readily available, although some general information is made available through the Council of Managers of National Antarctic Programs (COMNAP; www.comnap.aq). The Environmental Protocol states that each Treaty Party ‘shall, as far as is practicable, also prepare an inventory of locations of past activities (such as traverses, field depots, field bases, crashed aircraft) before the information is lost, so that such locations can be taken into account in planning future scientific programs (such as snow chemistry, pollutants in lichens or ice core drilling)’ [Article 8(3)]. To some degree this obligation is fulfilled by the Antarctic Treaty's Information Exchange and the Electronic Information Exchange System (EIES; http://www.ats.aq/e/ie.htm) which provide an overview of NAP activities. However, the system is limited in its usefulness for estimating the extent and intensity of human activities as:
a) only around 60% of Antarctic Treaty Parties submit information on their activities to the Information Exchange database, despite it being an obligation under the Antarctic Treaty (calculation based on 2008/09 data),
b) the information provided includes details of only major field activities,
c) sufficient information is not always included to enable identification of specific locations of field activities and, in particular, those of travelling field parties,
d) information outside the EIES is not readily accessible, and
e) substantial quantities of human activity pre-dated the period covered by the Information Exchange process.
In recent years the Antarctic Treaty Consultative Meeting (ATCM) through its Committee for Environmental Protection (CEP) has paid attention to the topic of cumulative environmental impact by the tourism industry and governmental operators. The CEP reported a need to determine the footprint of human impact for multiple activities and operators at the local, regional and continent-wide scale (United States 2003). A priority for future work was the ‘establishment of databases (spreadsheets, GIS) capturing field and station activities through time’, but a recommendation to develop a readily accessible database detailing NAP site visitation has yet to be implemented.
In this paper, as an illustration of potential approaches to advance knowledge in this field, we apply methods that attempt to determine the footprint of the United Kingdom's NAP, focussing primarily on the Antarctic Peninsula region. This provides an example of a NAP where formal location-specific records of activities are not readily available.
Methods
The British Antarctic Survey (BAS) is the United Kingdom's national operator within Antarctica. BAS is one of 17 NAPs with research stations and/or significant scientific activities in the Antarctic Peninsula. It has an active scientific programme, good transportation infrastructure and a long historical presence in the region. The UK has maintained permanently staffed research stations on the Antarctic Peninsula since 1944, when a British Government military expedition, Operation Tabarin, opened two stations. The operation was established on a permanent basis as the Falkland Island Dependencies Survey (FIDS) in 1945, and a further 19 stations were opened before 1962, when FIDS was renamed BAS.
Research station infrastructure
For each UK research station, information on location, period occupied and total number of wintering personnel was extracted from documents held in the BAS Archive and the BAS Club Database of Wintering Staff (http://www.antarctica.ac.uk/basclub/news/winterers.php).
Field activities: archived field reports
Since 1944 British field parties operating under BAS or its predecessors have produced unpublished/internal reports describing their journeys and scientific/survey findings. The BAS Archives holds over 9500 such reports. Of these 2020 are travel reports, including 722 with maps plotting travel routes and campsites. The travel reports are often the first, and sometimes only, record of visits to remote localities. Separate scientific field reports covering the same journey can be used to supplement the information in the travel reports, although their focus is on the scientific work sites rather than the routes. The BAS Archives hold just under 500 geology and geophysics field reports, about 200 glaciology reports, 240 topographic survey reports and 700 terrestrial biology reports. Together these provide a valuable source of detailed information about the localities visited. Nevertheless, their usefulness is dependent on the accuracy of the original location recordings, the ability to geo-reference the data to modern maps and the availability of sufficient time and manpower to extract and analyse the data. As an example, the route and field camps of a geological field party detailed in BAS Archive report numbers AD6/2D/1952/K5 (travel) and AD6/2D/1952/G (geology) were plotted.
Field activities: archive field report databases
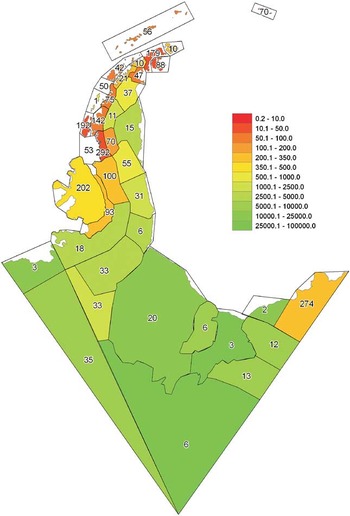
Owing to the resource requirements of extracting data from the field reports themselves, alternative ways of viewing these data were examined. All the field reports held in the BAS Archives have been catalogued and indexed by geographical place. Focussing on the Antarctic Peninsula area, the number of field reports indexed to each of 38 geographical sub-regions (coasts and island groups) between approximately 90°W and 20°E was used as a proxy for estimating spatial distribution of British field activities over the past 65 years. The sub-regions were designated arbitrarily to give pragmatic coverage of the region when the current archive system was developed in 1986. To allow for differences in the area of the sub-regions, the number of field reports was plotted relative to the sub-region area and expressed as km2 per record. For example, the Adelaide Island sub-region (4663 km2) on the western Antarctic Peninsula, had 192 reports resulting in 4663/192 = 24.3 km2 per record (i.e. within the scale range 10.1–50.0 km2 per record).
Field activities: science and mapping databases
An estimate or proxy for the spatial extent, concentration and chronology of UK national operator activities in Antarctica was generated using location data held in science and mapping databases. The UK Antarctic Plant Database (see http://apex.nerc-bas.ac.uk/f?p=252:1), Mapping and Survey databases and Geological Database contain records of locations visited throughout the Antarctic Peninsula area with the majority dating from after the 1940s. These database records therefore provide information on the positions and dates of ground-based field activities. Over 58 000 records with associated locations are held in the databases. Firstly, all the positional data were plotted to show the extent of UK activities, including fieldwork locations, past and present research stations, aircraft landing and depot sites and field activities on ice-free locations and ice sheets and ice shelves (e.g. geophysical traverse lines and ice-core drill sites). Secondly, the data were used to determine the concentration of human activity in ice-free locations on the Peninsula at a fine spatial scale using 20 × 20 km grid squares (1014 squares in total) and quantifying the number of visits to each grid square. Lastly, the data was used to examine the chronological development of UK activities in the region by plotting separately the location of field activities undertaken before 1949 and during every subsequent decade up until 2009.
Results
Research stations infrastructure
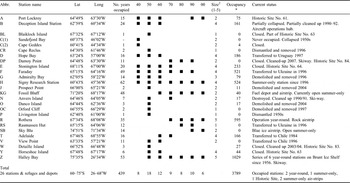
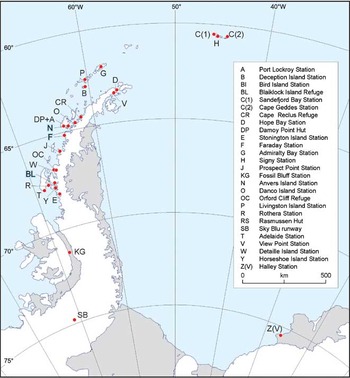
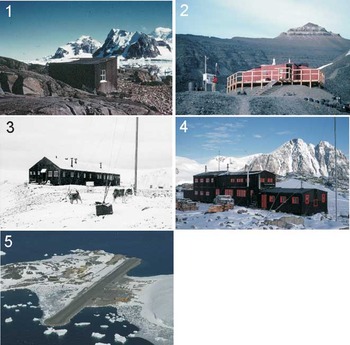
Table I shows details of the 26 UK research stations and huts in Antarctica occupied since 1944, and Fig. 1 shows their locations on the Antarctic Peninsula (only Halley Research Station lies outside the Antarctic Peninsula region). Figure 2 illustrates differences in relative size, as detailed in Table I.
UK research stations, refugesFootnote 1 and major depots (1944–2010).

* Total wintering population only
1 Other huts around Signy Island, South Orkney Islands and Argentine Islands. Stations on South Georgia are not included in the table.
2 Estimate of station size at its largest.
Present and past UK research stations on the Antarctic Peninsula.

Examples of Antarctic research stations to illustrate relative size: (1) Blaiklock Island refuge, 1957, by George M. Larmour, BAS Archives Ref. AD6/19/3/C/Y11, (2) Station KG, Fossil Bluff, 1994/95, by Peter Bucktrout, BAS Image Collection Ref. 10004058, (3) Station G, Admiralty Bay, 1958/59, by Denis R. Bell, BAS Archives Ref. AD6/19/X/20/1, (4) Station E, Stonington Island, 1973/74, photographer unknown, BAS Archives Ref. AD6/19/3/C/E29, and (5) Rothera Research Station, 2009/10, by Peter Bucktrout, BAS Image Collection Ref. 10010169.

Station numbers peaked in the 1950s, coinciding with the UK's scientific efforts toward the International Geophysical Year 1957/58. After this time station numbers gradually declined and currently Rothera Research Station is the only UK station on the Antarctic Peninsula that is occupied year-round. Unused research stations were either transferred to other Antarctic Treaty nations (e.g. Faraday was transferred to the Ukraine in 1996 and renamed Vernadsky Station), demolished and removed (e.g. Station G: Admiralty Bay), or designated as a Historic Site and Monument (HSM) under the Antarctic Treaty System (e.g. Station Y: Horseshoe Island). Assessing the duration of human occupancy in Antarctica is difficult, with individuals spending between a few weeks to over 2.5 years. However, in recent years typically over 250 personnel visit BAS stations and field locations each year, with around 40 over-wintering. Since the 1940s this gives the equivalent of almost 4000 Antarctic ‘person winters’ undertaken at UK research stations. All stations were constructed on ice-free ground with direct ship access, with the exceptions of Fossil Bluff (on rock, adjacent to George VI Ice Shelf), Sky Blu (inland, on blue ice) and Halley Research Station (coastal, on the Brunt Ice Shelf).
Field activities: archived field reports, field report databases and science and mapping databases
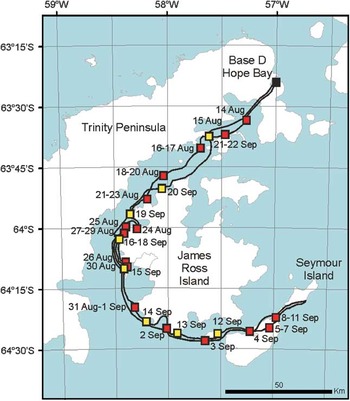
Figure 3 shows the route and field camps of a geological field party on a return dog sledge trip from Base D Hope Bay, Trinity Peninsula to Seymour Island via James Ross Island between 14 August and 22 September 1952, deduced from archive reports. Much travel was performed on seasonal sea ice, but also over permanently ice covered land. Figure 4 shows the levels of BAS field activities integrated within 38 sub-regions across the Antarctic Peninsula area. The highest levels of field activity were on the South Orkney Islands and northern and western Antarctic Peninsula.
Example of a 1952 dog-sledging route extracted from archived sledge party field reports (red square = outward journey camp locations, yellow square = return journey camp locations). Much of the journey was undertaken on winter sea ice.

Location of activities based upon BAS Archives database sub-regions. The number of field reports from each region is indicated on the map. The scale units are the number of km2 per record.

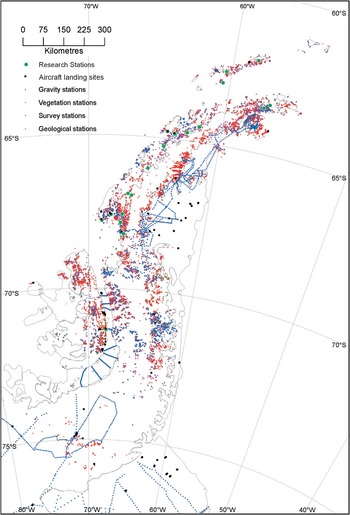
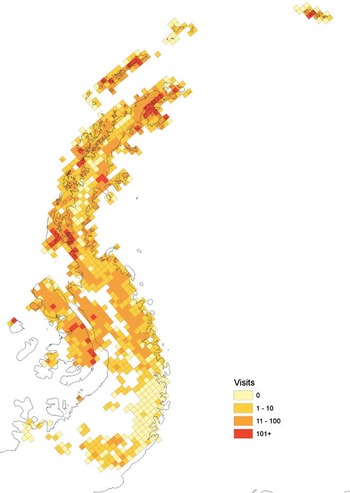
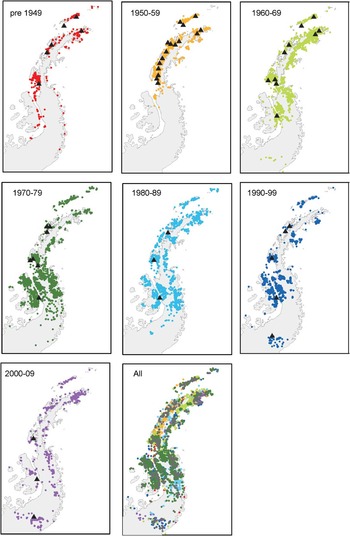
Figure 5 shows the extent of UK field activities and the location of UK logistic infrastructure including aircraft landing and depot sites, past and present research stations, geophysical traverse lines and ice-core drill sites. Figure 6 shows the concentration of field activity locations up until 2009 in 20 × 20 km grid squares within which are found ice-free locations in the Peninsula region. The highest concentrations of visits were found around the sites of current and past research stations. Figure 7 shows the distribution of field activity locations, held in the UK databases, before 1949 and each decade up to 2009, and illustrates how the location of scientific effort has changed over time and is linked to active research station distribution.
Location of BAS logistic infrastructure (depot sites, past and present research stations) and field activities on ice-free locations and ice sheets and ice shelves (geophysical traverse lines, and ice-core drill sites) derived from readily accessible databases.

Number of recorded field activities within 20 × 20 km squares that contain ice-free locations in the Peninsula region. Areas containing no ice-free ground are shown in white.

Distribution of field activity locations on ice-free locations each decade up until 2009 (South Orkney Islands not shown). The location of research stations occupied during the decade are shown in each panel (▴).

Discussion
Effectiveness of the methodologies: United Kingdom operational footprint as a case study
The methods described here have produced a detailed spatial and temporal representation of UK activities in the Antarctic Peninsula. Nevertheless, with these methodologies, the accuracy of any representation depends upon the quality and quantity of data in available databases. The methods do not show directly the magnitude of potential human impacts associated with each location (for instance, not differentiating between a location visited by one person for five minutes or ten people for a week, or classifying the activities carried out at a location), although some of this information may be available in the associated field reports. Neither do the techniques provide information on the levels of any impacts associated with travel between locations. Extracting information from archived field reports is a time-consuming task, but may prove useful for assessing impacts at remote/little visited locations.
Despite these limitations, the methods reveal the considerable expansion of British operations throughout the Antarctic Peninsula region over the past seven decades. The distribution, scale and number of stations has varied considerably, largely driven in earlier years by the priority of mapping and exploring the region and, more latterly, of focussing on critical science questions facilitated by increasingly sophisticated research techniques (Fig. 6). The 1940s saw the establishment of the long-term presence of the UK in the region and was a period when much exploration by ship and dog sledge was undertaken as the geography of the Antarctic Peninsula was relatively poorly known at that time. Around 900 dogs were kept at major UK Antarctic stations between 1944 and 1994, with c. 540 000 km travelled by dog teams over this period (Walton & Atkinson Reference Walton and Atkinson1996). During the 1950s more detailed survey activity focussed around the research stations on the northern and western Antarctic Peninsula (Graham Land). High numbers of sampling and survey locations recorded during 1960s, 1970s and 1980s coincide with major periods of geological survey in the region. The increased use of aircraft for field science support and the opening of station KG (Fossil Bluff, Alexander Island) in the 1960s increased science activity in the southern Peninsula (Palmer Land) and on the eastern side of the northern Peninsula. From the mid 1970s, the use of dog teams as the primary means of land transport was phased out in favour of skidoos input by aircraft, thereby greatly reducing human impact caused by traversing to scientific work sites. In the 1970s and 1980s, work on the northern Peninsula continued, while most of Alexander Island was surveyed along with adjacent ice-free areas on the mainland Peninsula.
By the 1990s the period of major survey effort was drawing to close and the level of work in the northern Peninsula declined. Most science in the region was performed using the air corridor that connected the newly constructed runway at Rothera Research Station with Fossil Bluff and the newly opened blue ice runway at Sky Blu (Ellsworth Land). The new millennium saw increasingly strategic use of BAS logistics to answer major scientific questions, resulting in a more focussed deployment of scientists, complemented by an increased reliance on remote geophysical techniques.
In general, levels of human activity are focussed in areas in the vicinity of established research stations (see Figs 1, 6 & 7). Although the number of active stations has fallen from a peak of 18 during the 1950s to six today, in the same period the footprint of British activities has expanded across the entire Antarctic Peninsula and beyond. Likewise, the NAPs of some Antarctic Treaty nations with a shorter presence in the region, are also now expanding their infrastructure and operational footprint in Antarctica. For example, South Korea and India are soon to join the nine other Treaty Parties with more than one permanently occupied Antarctic research station, with their new stations being located a considerable distance from the existing operation. Today, BAS supports research throughout Antarctica, often as part of international collaborative projects and cooperatively using the infrastructure of other nations (e.g. the Antarctica's Gamburtsev Province Project (AGAP), located on the East Antarctic ice shelf; see http://www.antarctica.ac.uk/press/featured/AGAP/hidden_world.php).
Wider application of techniques
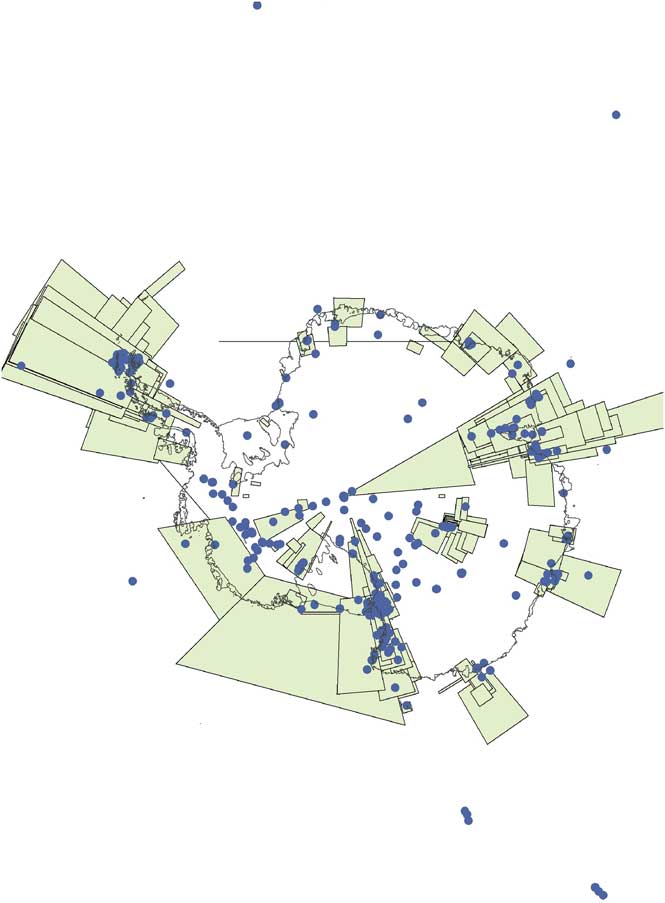
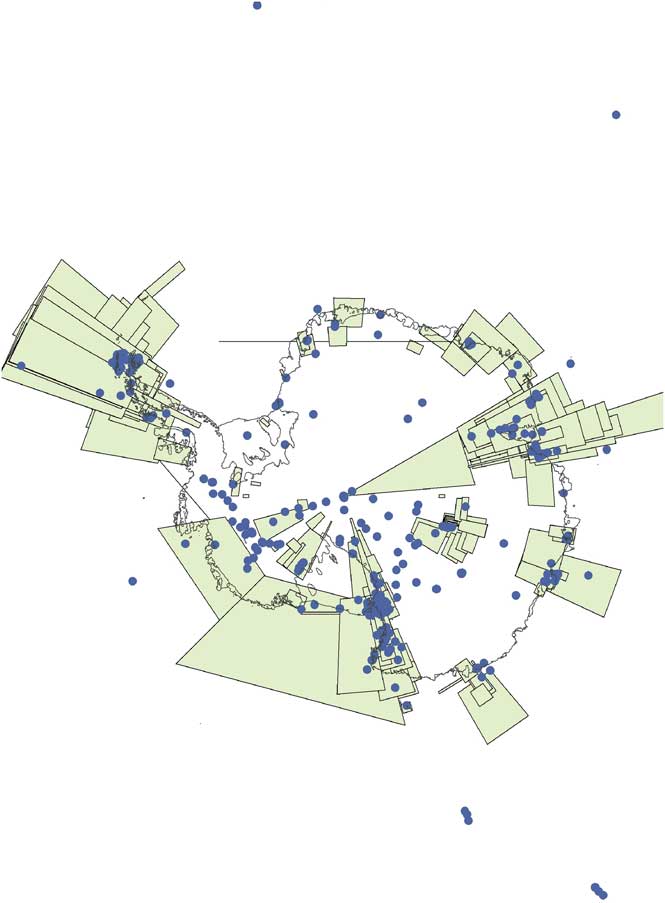
The representations of human activity distributions detailed in Figs 5–7 were generated using only three datasets, all originating from within the UK. Figure 8 shows the spatial areas covered by c. 4700 dataset descriptions held within the Antarctic Master Directory (found at: http://idn.ceos.org/portals/Home.do?Portal=amd&MetadataType=0), which was put in place predominantly by the Standing Committee on Antarctic Data Management (SCADM) network of National Antarctic Data Centres and contains spatial information placed there by universities, commercial organizations, NGOs, science consortia and multinational organizations and government agencies based in many different nations. The combination and subsequent visualization of the locations held within all other Antarctic Treaty Parties’ datasets could provide a powerful representation of the distribution of human impact for multiple activities and operators within Antarctica - a goal clearly set out at the CEP (United States 2003). The addition of information on locations of national operator logistic infrastructure (depot sites, past and present research stations, tractor train routes, major traverses, etc.) would further enhance this representation and increase its usefulness to environmental policy makers. With the availability of low-cost hand-held Global Positioning System (GPS) technology, future collection of direct location records of human activities in Antarctic may be feasible without substantial cost.
Distribution of marine and terrestrial scientific databases within the Antarctic Treaty area described in the Antarctic Master Directory. Databases shown are those described as point locations (1367) or have area coverage less than 15 × 15 degrees (1444). Databases with larger area coverage are not shown (1887). Each database may contain multiple locations of individual field activities.
If such information were available, vulnerable locations may be identified more easily and protected, based not only on physical parameters (for instance, provided by the Environmental Domains Analysis; Morgan et al. Reference Morgan, Barker, Briggs, Price and Keys2007) or biological diversity (see work by the SCAR Evolution and Biodiversity in Antarctic Programme; http://www.eba.aq/), but also on levels of human visitation. All three parameters are essential for effective environmental management and future systematic protected area designation.
Do untouched areas exist in Antarctica?
Our analyses demonstrate that substantially sized unvisited areas are scarce on the Peninsula, with the Lassiter Coast (south-east Peninsula, between the Werner Mountains and Scaife Mountains) being the last large ice-free area unvisited by UK personnel (Fig. 6). Depending upon the past activities of other NAPs, this area may contain candidate sites for protection as inviolate areas preserved for future scientific efforts. Further afield, candidate sites may also exist in the Trans-Antarctic Mountains and Marie Byrd Land (Lewis Smith Reference Lewis Smith1994).
Antarctic Specially Protected Area (ASPA) 123 Barwick and Balham valleys, southern Victoria Land, remains the only substantial area protected primarily to conserve the natural ecosystem as a reference area largely undisturbed by direct human activities. At 480 km2, this site is the largest terrestrial ASPA, accounting for around a third of Antarctica's specially protected land, yet it represents less than 1% of the continent's ice-free ground (see http://www.ats.aq/documents/recatt/Att445_e.pdf). Other much smaller ASPAs, or zones within ASPAs, have been designated with access restricted i) to preserve the ecosystem as largely undisturbed by human activities (ASPA 119 Davis Valley and Forlidas Pond, Dufek Massif, Pensacola Mountains), ii) to act as reference sites for future comparative studies (ASPA 116 New College Valley, Caughley Beach, Cape Bird, Ross Island), or iii) for future microbiological research using metagenomic techniques (ASPA 126 Byers Peninsula, Livingston Island, South Shetland Islands) (http://www.ats.aq/e/ep_protected.htm).
Human presence at a location is not always essential in order to gain site-specific information. The rapid on-going development of satellite and airborne remote sensing techniques (including multi- and hyperspectral analysis) may provide increasingly detailed information on an area's geology, hydrology, geomorphology and vegetation cover without the need for human visitation (Fretwell et al. Reference Fretwell, Convey, Fleming, Peat and Hughes2010). Nevertheless, collection of detailed information, such as site biodiversity, will inevitably require site visits.
Conclusions
Information on the activities of the NAP within Antarctica held in field reports and archive and science databases could be used to give environmental managers and policymakers a greater insight into levels of human impact across the continent. This is essential because all Antarctic research, tourism and exploration has an environmental cost. The establishment of new NAP stations and infrastructure may further facilitate the visitation of increasingly remote area of Antarctica - an activity that shows little sign of abatement. Even the most remote areas of Antarctica are now potentially accessible to humans, and already impacted through low level pollution, and may be at risk from microbial contamination and redistribution of biota. Over forthcoming decades, scientific methodologies will undoubtedly progress, but the continued existence of unvisited Antarctic sites, as pristine natural laboratories for future science, may be in doubt. Inevitably, scientists and policy makers need to balance the need to visit new areas of Antarctica to answer pressing scientific questions, with that to protect and preserve areas of Antarctic for future science or other purposes or values. Future science is at risk if this balance is not given adequate consideration both in Antarctica and other unimpacted areas of the Earth.
Acknowledgements
We thank Ian Collinge for historical information, Helen Campbell for information on SCADM, Magdalena Biszczuk for assistance with mapping, Pete Convey for helpful comments on a late draft of the manuscript and two anonymous reviewers for useful comments following submission. This paper contributes to the British Antarctic Survey's Polar Science for Planet Earth core programme EO-LTMS (Environment Office - Long Term Monitoring and Survey).