Introduction
InGaN compounds have been used successfully for the fabrication of highly efficient blue, green, amber and red light emitting diodes. The wavelength of the emitted light of these diodes has been correlated with the overall In-content of the ternary nitride [Reference Mukai, Yamada and Nakamura1]. However, from electro- and photoluminescence (PL) experiments, it was suggested that the luminescence originates from In-rich inclusions, the size of which determines the wavelength of the emitted light [Reference O’Donnell, Martin and Middleton2]. The size of efficient quantum dots is expected to be of the order of nm [Reference Martin and O’Donnell3].
Several groups have tried to find direct evidence of phase separation in InxGa1−xN layers. In particular, due to their small sizes, the quest for quantum dots is an challenging issue. Recently, evidence was found for segregation of InxGa1−xN multiple quantum wells (MQW’s) and single layers [Reference Singh, Doppalapudi, Moustakas and Romano4-Reference McCluskey, Romano, Krusor, Bour, Johson and Brennan6]. In all of these studies, phase segregation was only observed for In-contents exceeding ∼0.30, and it was generally evidenced from extra peaks in X-ray diffraction (XRD) patterns [Reference Singh, Doppalapudi, Moustakas and Romano4-Reference McCluskey, Romano, Krusor, Bour, Johson and Brennan6], from extra spots in the transmission electron diffraction patterns [Reference El-Masry, Piner, Liu and Bedair5], or from energy dispersive X-ray (EDX) analysis [Reference McCluskey, Romano, Krusor, Bour, Johson and Brennan6]. These findings are in agreement with the calculations of Ho and Stringfellow [Reference Ho and Stringfellow7], who calculated the critical temperature Tc above which the InN-GaN system is completely miscible. This temperature, 2457 K, by far exceeds the typical InGaN growth temperature at which a maximum In solubility in GaN of less than 6 % is predicted. MQW’s were shown to be much more stable than thick single layers, separation only occurring after annealing at 950°C [Reference McCluskey, Romano, Krusor, Bour, Johson and Brennan6]. This enhanced stability is due to the high elastic strain experienced in thin heterostructures and quantum wells, which results in a significant decrease of the critical temperature for single phase stability [Reference Karpov8]. In all of the aforementioned studies, typical precipitate sizes of (several) tens of nanometer were reported, hence too large to result in efficient luminescence [Reference Martin and O’Donnell3]. In this paper, we present a correlation between the PL-energy of single InxGa1−xN thick films and their overall and local In-content. In particular, we will focus on the effect of local variations of the composition on the nanoscale, resulting in a phase segregation of the ternary nitride.
Experimental
Two InxGa1−xN layers, each with a laterally varying composition, were grown at 780°C by metalorganic chemical vapour deposition on a thick GaN buffer / Al2O3 substrate. The thickness of the layers is about 250 nm. The exact In-content and thickness, as well as the crystalline quality, was mapped by Rutherford backscattering and channeling spectrometry (RBS/C), using a beam spot of approximately 1 mm2. The crystallinity, azimuthal orientation and the phases present in the sample were further monitored with low (Rigaku system with a rotating anode) and high (Bruker D8 discover) resolution XRD in θ−2θ geometry. PL mapping was performed at low temperature (< 30 K) using an Ar+ laser with a spot diameter of 100 µm. Samples for transmission electron microscopy (TEM) were prepared in cross sections and studied with a Philips CM 30 FEG electron microscope, operating at 300 kV. Electron dispersive X-ray analysis (EDX) was performed with a Link instrument on a Philips CM 20 microscope.
Results and Discussion
Using RBS, the exact In-fraction of the InxGa1−xN layers was mapped at a large number of distinct points on the samples, x-values in the range from 0.2 to 0.4 were found [Reference O’Donnell, White, Pereira, Wu, Vantomme, Van der Stricht and Jacobs9]. Figure 1 shows the random and aligned RBS spectra of a particular area of the sample which will be discussed in detail below. From the random spectrum, a composition of In0.25Ga0.75N and a thickness of 290 nm are deduced. The spectrum measured with the incoming beam aligned along the <0001> direction indicates that the minimum yield χmin of the In0.25Ga0.75N layer is 20 % (this is the ratio of the backscattering yields of the aligned and random spectra, and is a measure for the crystalline quality of the layer). The value of χmin is found to increase with the In-content (i.e. increasing lattice mismatch with respect to the GaN buffer layer), indicating a deteriorating crystallinity.
Random (o), aligned (Δ) and simulated (solid line) RBS spectra of the In0.25Ga0.75N/GaN/Al2O3(0001) layer. All TEM results shown further have been obtained from this part of the specimen.

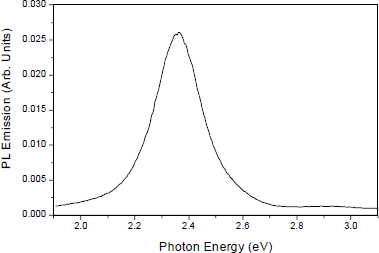
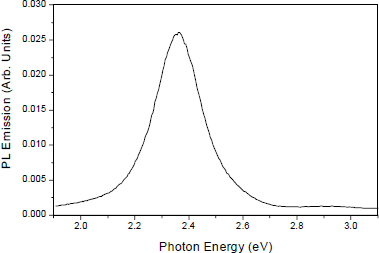
PL measurements revealed a direct, linear relationship between PL peak energy and In content [Reference O’Donnell, White, Pereira, Wu, Vantomme, Van der Stricht and Jacobs9]. Taking into account the linear variation of the PL peak with band gap [Reference Martin, Middleton, O’Donnell and Van der Stricht10], this result implies that band bowing is absent. The indium content measured by RBS is systematically lower than that expected from previous estimates based on a comparison of PL with X-ray diffraction [Reference Wu, Vantomme, Hogg, Langouche, Van der Stricht, Jacobs and Moerman11]. As an example, an indium concentration of 40%, the highest measured in this work, corresponds to a PL peak of 710 nm, strongly suggesting that the light-emitting regions of the sample are very indium-rich compared to the overall In content of the nitride, as measured by RBS. On the other hand, the region with an In-concentration of 25 % results in a PL peak energy of 525 nm (Figure 2).
Low temperature PL spectrum of the same sample as shown in Fig. 1.
In an attempt to find direct evidence for the phase segregation suggested by the PL measurements, XRD was performed in θ−2θ geometry, using a detector angle between 10° and 120°. In none of the low resolution/high intensity diffraction patterns could any trace of In-rich phases be found. However, preliminary high resolution measurements (which also allow us to probe a much smaller – hence perhaps more uniform – part of the inhomogeneous layer) give evidence of a small fraction of InxGa1−xN, with a composition close to x = 0.50. A detailed high-resolution investigation of samples with varying In compositions will be indispensable to understand the mechanism of this phase segragation, and in particular to elucidate whether the value of x = 0.50 gives evidence of ordering in the ternary system.
On the other hand, transmission electron microscopy of the 290 nm thick In0.25Ga0.75N layer reveals the presence of 10-20 nm islands, aligned at the interface with the GaN buffer layer, and parallel to it at different depths in the InGaN layer. Figure 3 is a cross sectional transmission electron microscopy (TEM) image showing the InGaN layer on the top of the GaN buffer layer. Besides planar defects and strain contrast, the image reveals some pyramidal-shaped zones of a different brighter contrast. Seven such rows of pyramidal islands are visible (indicated by arrows in Fig. 3), the first one lying near the interface with the GaN buffer layer. The distance between the rows of pyramidal inclusions in the bulk of the film is about 30-40 nm.
TEM image of a cross section of the InGaN layer. Rows of pyramidalshaped inclusions of brighter contrast, parallel to the interface with the GaN buffer layer are marked with arrows.

In an attempt to obtain more detailed structural information about these precipitates high resolution electron microscopy (HREM) has been performed. Figure 4 shows a HREM image along the [01

HREM image along the [01

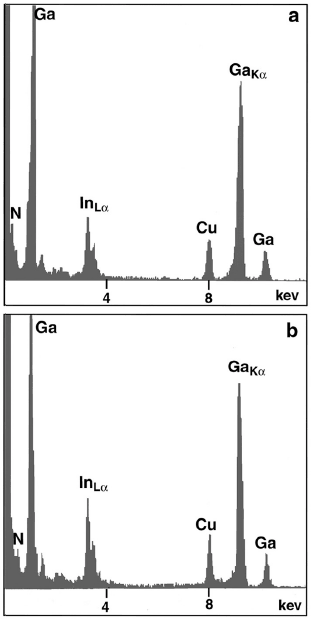
To compare the composition of the pyramidal precipitates to that of the surrounding matrix, energy dispersive X-ray (EDX) analysis was performed. The count rate was maintained constant for the different measurements, so that the absolute intensities of the peaks can be compared. The spot size of the electron beam was 15 nm. Care was taken to analyse neighbouring regions of the islands and the matrix, so that the sample thickness could be considered constant from one zone to the other. In this way one can presume that the same volume of specimen was analysed in the islands and in the matrix. The EDX results (Figure 5) show that the amorphous pyramidal-shaped inclusions are In-rich as compared to the surrounding matrix. The relative ratio of the InLα to GaKα peak intensities, which is proportional to the In to Ga atomic ratio, is 0.39 in the amorphous pyramidal precipitates and 0.32 in the surrounding matrix. Since the diameter of the electron beam is of the order of (or larger than) the inclusions, the former value can be considered a lower limit.
EDX spectra from the matrix (a) and from a pyramidal-shaped inclusion (b) showing an increased In concentration in the latter.
Summary and Conclusion
We have studied the composition of InxGa1−xN layers on a macroscopic (RBS) and microscopic (TEM) level, and compared the indium content to the luminescence of the respective nitrides. A detailed analysis of these data reveals that the luminescence must originate from In-rich inclusions in the InGaN layer. Indeed, partial phase separation has been observed by high-resolution XRD. Moreover, a cross sectional TEM/EDX investigation has indicated the presence of 10-20 nm large pyramidal amorphous precipitates, the composition of which is In-rich. However, according to O’Donnell et al. [Reference O’Donnell, Martin and Middleton2,Reference Martin and O’Donnell3] the size of these pyramidal islands is too big to expect large quantum effects. Hence we have to look for smaller sized features that could be related to the quantum effects. In a recent plan-view microscopy investigation, features of the order of ∼2 nm have been observed. From high-resolution electron micrographs, these inclusions could be positively identified as quantum dots. A full discussion of this TEM investigation, along with a comparison to dot size estimates from PL measurements, will be given elsewhere. Hence, we can conclude that the InxGa1−xN samples we studied seem to segregate into a wide variety of crystalline and amorphous microstructures and nanostructures, as evidenced with a variety of techniques. The challenging task will be to correlate the observed (optical) properties to the specific spatial patterns of the layers.
Acknowledgements
The authors want to acknowledge partial financial support from the IUAP Program (P4/10) and from the Flemish government through the Bilateral Programs BIL 96/32 (Flanders/China) and BIL 97/93 (Flanders/Romania).