

Increasing attention is being paid to the behavioral phenotype of children identified with developmental language difficulties in the native language. Children with primary (or specific) language impairment (LI) constitute about 7% of the young monolingual English-speaking population in the United States (Tomblin et al., Reference Tomblin, Records, Buckwalter, Zhang, Smith and O'Brien1997), and present an interesting case because the language difficulty is not secondary to conditions such as hearing loss, developmental delay, neurological insult, or environmental differences or deprivation. The search for a more refined phenotype is taking place within broader investigation of whether LI subgroups have overlapping performance profiles with other populations, including children with neurodevelopmental disorders such as autism and attention-deficit disorder (American Academy of Child & Adolescent Psychiatry, 1998; Tager-Flusberg, Reference Tager-Flusberg, Rice and Warren2004). There also is the longstanding debate about whether LI forms a discrete clinical population and/or represents societal concern about below-average language performance (Leonard, Reference Leonard and Rosenberg1987; Tomblin, Reference Tomblin2006).
Although language performance is, by definition, the central deficit in LI, several factors speak against an exclusive focus on language to inform the LI phenotype (Windsor & Kohnert, in press). These include a changing profile of salient spoken language deficits during development, the differential influence of the specific languages or dialects to be learned, and of key relevance here, the issue that a robust phenotypic description is one that is reliable across diverse groups (McMahon, Reference McMahon and Tager-Flusberg1999). Language characteristics do not appear to be sufficient to identify LI in the face of diversity. In particular, when typically developing sequential bilinguals have been compared with monolingual children with LI on traditional language measures in the second language, considerable overlap between the two groups has been found (Häkansson & Nettelbladt, Reference Håkansson, Nettelbladt, Johnson and Gilbert1996; Paradis, Crago, Genesee, & Rice, Reference Paradis, Crago, Genesee and Rice2003).
One reason that conventional measures such as standardized tests and language samples may fail to separate children with LI from typical language learners is that language is a highly experience-dependent ability that relies on cumulative, acquired knowledge. Performance in any given language reflects linguistic, cultural, educational, social, and world experiences in addition to the underlying integrity of an individual's cognitive system. When the experiential component of language is reduced by using highly familiar or novel stimuli, language-based tasks such as nonword repetition have been found to identify LI reliably in racially, culturally, or dialectically diverse groups. For example, Campbell, Dollaghan, Needleman, and Janosky (Reference Campbell, Dollaghan, Needleman and Janosky1997) and Ellis Weismer, Evans, and Hesketh (Reference Ellis Weismer, Evans and Hesketh1999) found no difference in nonword repetition performance by “majority” (White) children and “minority” (primarily African American) children. Rodekohr and Haynes (Reference Rodekohr and Haynes2001) found no reliable differences between African American English-speaking children and their mainstream peers in nonword repetition and listening span.
However, these same measures do not identify LI reliably in linguistically diverse groups (Kohnert, Windsor, & Yim, Reference Kohnert, Windsor and Yim2006; Windsor & Kohnert, Reference Windsor and Kohnert2004). The purpose of the current study is to explore whether nonlinguistic performance may inform the LI phenotype. Specifically, we were interested in which, if any nonlinguistic tasks would separate monolingual children with LI from two groups of children with intact language systems, including typically developing sequential bilingual children as well as monolingual children.
A range of causal mechanisms have been proposed for LI, some of which address nonlinguistic correlates. Proposals that address nonlinguistic status range from, for example, the idea of LI as an instance of neuromaturational delay (Bishop & Edmundson, Reference Bishop and Edmundson1987) to a focus on difficulties in elementary cognitive operations and/or working memory (e.g., Kail, Reference Kail1994) to the hypothesis of an atypical procedural memory system in LI (Ullman & Pierpoint, Reference Ullman and Pierpoint2005). Our approach in examining nonlinguistic performance has been to take a broader perspective that allows for examination of a variety of instances of typical and atypical language learning. That is, in better defining the phenotype, we initially do not want to a priori reify unique causal mechanisms of LI, especially when there is considerable debate about the nature of this group.
Instead, we draw on a general framework of cognitive–linguistic processing in which individual differences in language performance emerge from a developing biological system interacting with differential language and social experiences. This framework is in line with approaches that emphasize both biological and experiential factors, such as those proposed in various ways by MacDonald and Christiansen (Reference MacDonald and Christiansen2002), Tomasello (Reference Tomasello2003), and Karmiloff-Smith (Reference Karmiloff-Smith2007). This approach enables us to place LI and intact bilingual and monolingual performance within the one framework. This approach also could incorporate other instances of language learning, such as gifted language learning as well as language breakdowns in genetic disorders, in impoverished environments, and in attachment disturbances (Windsor & Kohnert, in press).
NONLINGUISTIC DEFICITS IN LI
Nonlinguistic performance is of interest because of the repeated findings of subclinical nonlinguistic correlates of LI, especially in response time (RT). In what appears to be the first RT examination of nonlinguistic performance in LI, Johnston and Ellis Weismer (Reference Johnston and Ellis Weismer1983) found that children with LI performed a mental rotation task as accurately as age peers but more slowly. More recent research has supported the finding that monolingual children with LI tend to be slower (at the group level) to complete a range of speeded nonlinguistic tasks than typical monolingual age peers (Miller, Kail, Leonard, & Tomblin, Reference Miller, Kail, Leonard and Tomblin2001; Miller et al., Reference Miller, Leonard, Kail, Zhang, Tombin and Francis2006; Windsor, Milbrath, Carney, & Rakowski, Reference Windsor, Milbrath, Carney and Rakowski2001).
One study, by Kohnert and Windsor (2004), has examined the utility of nonlinguistic detection tasks to identify LI in linguistically diverse groups. The participants were 8- to 13-year-old monolingual children with and without LI and typically developing sequential bilingual Spanish–English speakers who had high proficiency in both languages. The monolingual children with LI were slower to perform a choice visual detection task than both typical groups. The LI group also was slower than the typical monolingual group in a simple visual and a choice auditory detection task. The bilingual group approximated the performance of the typically developing monolingual group in these two tasks; however, their performance was not separated statistically from the LI group. There was no group difference in the simple auditory detection task.
Although the finding that children with LI might be separated from typically developing bilingual and monolingual peers on some nonlinguistic tasks is intriguing, there are at least four issues to consider in examining the nonlinguistic profile in LI in a way that helps to characterize a behavioral phenotype. This includes the role of experience, the influence of perceptual–motor speed in higher level nonlinguistic tasks, the effect of task difficulty, and the impact of development on nonlinguistic performance.
The role of experience
Although it may be less obvious than in language tasks, nonlinguistic tasks also may be affected by experience and acquired knowledge. RT even in very simple visual search tasks is affected by practice and by familiarity of target and distracter stimuli (Mruczek & Sheinberg, Reference Mruczek and Sheinberg2005). RT in complex visuospatial tasks such as mental rotation also may be influenced by experiential variables including acquired knowledge, practice, strategy use, and/or linguistic mediation in addition to underlying cognitive function (Birren & Fisher, Reference Birren and Fisher1995; Salthouse, Reference Salthouse1993). Similarly, RT in difficult arithmetic problems may rely as much on acquired phonology and mathematical knowledge and practice as it does on underlying representational or efficiency constraints.
Another type of experiential difference in nonlinguistic performance could be introduced through the process of bilingual or monolingual language learning. Using an executive function framework, Bialystok (Reference Bialystok1999) and Bialystok and Martin (Reference Bialystok and Martin2004) have proposed that learning more than one language may enhance typically developing children's ability to control selective attention to specific aspects of mental representations. That is, bilingual and monolingual children may have equal ability to analyze the structure of a mental representation or problem. However, as an outcome of dealing with the demands of selective attention in bilingual language learning, bilingual children may have an advantage in nonlinguistic tasks that require inhibition of distracting or conflicting information. There is a need for more research in this area. If it is the case that there are replicable differences in bilingual and monolingual information processing, this presents another aspect of nonequivalence in the sensitivity and specificity of nonlinguistic tasks to inform the LI profile across diverse populations.
The role of perceptual–motor speed
There is a perceptual–motor component in nonlinguistic tasks in which RT is the dependent variable. Although perceptually encoding a stimulus and making a decision may overlap in time, the motor response typically is seen as adding an independent time component (Bates & Eysenck, Reference Bates and Eysenck1993). If LI reflects neuromaturational delay (Bishop & Edmundson, Reference Bishop and Edmundson1987; Hill, Reference Hill2001) then children with LI may best be identified on nonlinguistic tasks that emphasize motor RT versus higher level cognitive function. The LI literature is replete with findings that children with LI are slower than typical monolingual peers on nonlinguistic tasks that emphasize motor speed, such as auditory and visual detection tasks (Ellis Weismer & Hesketh, Reference Ellis Weismer and Hesketh1996; Lahey & Edwards, Reference Lahey and Edwards1996, Montgomery & Leonard, Reference Montgomery and Leonard1998). LI groups also show deficits in fine and gross motor tasks, such as peg moving, bead threading, ball rolling, and tapping (Bishop, Reference Bishop1990; Bishop & Edmundson, Reference Bishop and Edmundson1987; Miller et al., Reference Miller, Kail, Leonard and Tomblin2001; Powell & Bishop, Reference Powell and Bishop1992; see Hill, Reference Hill2001, for a review). Also, children with LI have been found to perform equivalently on perceptual–motor tasks to children with Developmental Coordination Disorder, a diagnostic category identifying children who are delayed in reaching motor milestones (Hill & Bishop, Reference Hill and Bishop1998; Kaplan, Dewey, Crawford, & Wilson, Reference Kaplan, Dewey, Crawford and Wilson2001).
The broader issue is that different theoretical perspectives of LI may predict different nonlinguistic profiles in LI. For instance, if constrained neural processing speed for elementary cognitive operations is implicated in LI (Kail, Reference Kail1994; Miller et al., Reference Miller, Kail, Leonard and Tomblin2001), then RT in a choice detection task (e.g., identifying one of two tones) should be somewhat more sensitive to the LI profile than RT in an otherwise equivalent, simple detection task (e.g., responding to the presence of a single tone). That is, the small decision-making component in the choice detection task should reflect the underlying neural speed of the mental operation more directly than a simple detection task, in which a greater proportion of RT reflects the time to make a motor response rather than decision time (Bates & Stough, Reference Bates and Stough1998). As a different example, if LI primarily is due to short-term or working memory constraints (Hoffman & Gillam, Reference Hoffman and Gillam2004; Montgomery, Reference Montgomery2000), then the RT from tasks that emphasize a memory component or are particularly demanding of resources might be expected to be most sensitive to the LI profile. However, nonlinguistic task performance in LI has not yet been studied in a way that allows for reliable separation of one type of nonlinguistic task from another.
The role of task difficulty
Another factor to consider is that, as in language, not all nonlinguistic tasks are implemented in ways that present the same degree of difficulty. It may be that only complex nonlinguistic tasks or tasks that are demanding in a specific way are reliably sensitive to the LI profile. Task difficulty has theoretical as well as methodological implications. For example, in a limited processing capacity view of LI it has been argued that children with LI will show disproportionate decrements in performance relative to typical monolingual peers as task difficulty increases. This argument has been used to explain disproportionate LI performance decrements for unfamiliar versus familiar words, low versus high phonetic substance inflectional morphemes, and less versus more phonologically transparent derivatives (Dollaghan, Reference Dollaghan1998; Montgomery & Leonard, Reference Montgomery and Leonard1998; Windsor & Hwang, Reference Windsor and Hwang1999). However, these interpretations often have relied on comparison of slopes across two conditions that present very different levels of task difficulty. In this situation, larger LI performance decrements in absolute terms may mask the reality of equivalent proportional decreases across groups.
When we have examined RT in graded levels of within-task difficulty, monolingual LI performance has not been affected disproportionately relative to typical monolingual peers in auditory or visual detection, auditory serial memory, word recognition, or picture naming (Kohnert & Windsor, Reference Kohnert and Windsor2004; Kohnert, Windsor, & Miller, Reference Kohnert, Windsor and Miller2004; Windsor & Kohnert, Reference Windsor and Kohnert2004; Windsor & Kohnert, in press). Kohnert et al. (Reference Kohnert, Windsor and Yim2006) did, however, find a disproportionate LI decline with increased syllable length in nonword repetition. This previous work also has shown a qualitatively similar RT response to within-task difficulty for typical monolingual and bilingual children in nonlinguistic tasks.
The role of development
A final factor to consider is how nonlinguistic performance might change with age and be more or less sensitive to LI at different points in time. Monolingual children's RT on many nonlinguistic tasks is influenced heavily by age (which may reflect both development and experience). RT varies substantially during childhood (Cerella & Hale, Reference Cerella and Hale1994; Kail, Reference Kail1988, Reference Kail1993; Kail & Salthouse, Reference Kail and Salthouse1994). Examining RT at more than one point in time is also important for building a developmental trajectory for LI nonlinguistic performance. Karmiloff-Smith and colleagues (Karmiloff-Smith, Reference Karmiloff-Smith2007; Karmiloff-Smith et al., Reference Karmiloff-Smith, Thomas, Annaz, Humphreys, Ewing and Brace2004) have argued that task-specific trajectories are critical to inform the nature of delayed or different cognitive processes over time. That is, even though LI groups may show equivalent behavior to groups without LI at any given time point, this type of comparison masks the possibility of different developmental routes. Nonlinguistic RT appears to decrease at an exponential rate during childhood and adolescence for typically developing monolingual children (Kail, Reference Kail1991b, Reference Kail1993). However, there is minimal data about task-specific RT changes over time for children with LI. One longitudinal study suggests that nonlinguistic RT deficits are a stable characteristic of LI across development. Miller et al. (Reference Miller, Leonard, Kail, Zhang, Tombin and Francis2006) found that the nonlinguistic RT of 9-year-olds with LI was moderately correlated with RT on the same tasks at 14 years of age.
NONLINGUISTIC TASKS OF INTEREST
The current study explores nonlinguistic performance across a range of tasks that were administered in a systematic, replicable way with the same children, in order to lay the framework for more focused examination of critical aspects of the LI phenotype. The participants were school-age English-only speaking children with or without LI as well as typically developing, sequential bilingual Spanish–English speakers. It currently is much easier to validly rule out, rather than rule in, a diagnosis of LI in bilingual children using conventional language assessments. That is, we can be much surer in determination of typical development for bilingual children than in determining LI. Thus, to be conservative in interpretation of results, we did not include a group of bilingual children with LI.
We examined performance on seven nonlinguistic tasks. All tasks were within the visual modality, had systematic levels of within-task difficulty, and were administered in parallel ways. However, the tasks ranged from very elementary cognitive tasks to tasks that invoked higher level cognitive abilities. The tasks included odd man out; two memory tasks, pattern matching and serial memory; number search; simple arithmetic; and two complex visual–spatial processing tasks: mental rotation and form completion. Most research to date on these tasks has focused on monolingual children with and without LI, with less research on typically developing sequential bilingual children's performance. An overview of the tasks is given below.
The task expected to be the simplest (with the highest accuracy and shortest RT) was odd man out. In a typical odd man out task, participants see three target stimuli spaced at different distances. The two stimuli that are closest together are considered a pair, and participants identify the third stimulus as the odd man out. The task is an elementary cognitive task that is more complex than visual detection tasks but which does not invoke higher level, symbolic processing (Burns & Nettelbeck, Reference Burns and Nettelbeck2003; Frearson & Eysenck, Reference Frearson and Eysenck1986), and it appears to be a stronger correlate of IQ than other elementary choice RT tasks (Diascro & Brody, 1984). Although no odd man out tasks have been used previously with children labeled as LI, this task has been used to identify speed differences between other child groups. Kranzler (Reference Kranzler1994) found that children with reading disabilities were slower on an odd man out task than age peers, although there was no group difference when the groups were equated for IQ. Kranzler, Whang, and Jensen (Reference Kranzler, Whang and Jensen1994) found that gifted high school children had a faster RT than academically average age peers on the task.
Visual memory tasks may take several forms. The first memory task of interest was a pattern-matching task with different delay intervals between array presentations. The second memory task was a serial memory task in which patterns of lights were recalled. Each task relies on visual perceptual skill and the ability to maintain visual information in short-term memory. Although no RT studies appear to have examined visual memory in LI, aspects of visual perception and memory have been addressed. Children with LI have been found to be less accurate than age peers in making same/different judgments about the length of vertical lines and about the serial order of unfamiliar face and scribble pattern arrays displayed for a short time (Fazio, Reference Fazio1998; Powell & Bishop, Reference Powell and Bishop1992). Lower LI accuracy also has been shown in recalling the serial order of visually presented digits, especially when the children used a pointing (vs. speaking) response to identify serial order (Gillam, Cowan, & Marler, Reference Gillam, Cowan and Marler1998). Finally, Hick, Botting, and Conti-Ramsden (Reference Hick, Botting and Conti-Ramsden2005) found that, unlike typical age peers, the accuracy of young children with LI for a visual pattern recall task did not increase over a 1-year period.
In the fourth task, number search, participants identify a target number from a number array. In some simple visual search tasks (e.g., detecting a target red circle in a row of green circles), parallel processing of the full array may be sufficient to be successful in the task. However, because numeric characters can look quite similar, number search emphasizes a slower serial search mechanism of focal attention to each number in the array until the target number is found (Chelazzi, Reference Chelazzi1999). If the task invokes slower, serial search, it would be expected that there would be a longer RT to detect target numbers that are systematically closer to the end of the array. Miller et al. (Reference Miller, Kail, Leonard and Tomblin2001) examined visual search using target nonsense figures. Children with LI were as accurate as their age peers but tended to be slower.
In the fifth task, simple arithmetic problems are presented visually. Task completion relies partly on visual–spatial processing and abstract, magnitude representation. Arithmetic also includes a phonological component, with numbers being manipulated in a way that they are not in a number search task (Dehaene, Reference Dehaene1992; Dehaene, Spelke, Pinel, Stanescu, & Tsivkin, Reference Dehaene, Spelke, Pinel, Stanescu and Tsivkin1999). The arithmetic task arguably has the highest linguistic component of the seven tasks examined here. To the extent that knowledge in the target language is involved, both monolingual children with LI and typical bilingual children might perform with slower speed than typical monolingual children on mathematical tasks. Young monolingual children with LI have been found to be less accurate than age peers in oral counting tasks and nonoral numerosity tasks, such as matching or changing quantity (Arvedson, Reference Arvedson2002; Fazio, Reference Fazio1994). Difficulty with arithmetic facts and problems may persist through the school years, although deficits may not be seen in skills that do not rely on linguistic mediation, such as judging the relative size of single and double digit symbols (Cowan, Donlan, Newton, & Lloyd, Reference Cowan, Donlan, Newton and Lloyd2005; Donlan & Gourlay, Reference Donlan and Gourlay1999; Fazio, Reference Fazio1996, Reference Fazio1999). Although magnitude representation may not be affected by monolingual or bilingual language learning (Bialystok & Majumder, Reference Bialystok and Majumder1998), typical bilingual children have been found to show better performance for verbal mathematical problems presented in the first versus second language (Bernardo, Reference Bernardo2002). Even in adulthood, speed and accuracy of mental arithmetic may be subject to interference from the first language (Mägiste, Reference Mägiste1980). However, these effects may be subtle if a verbal response is not required (Geary, Cormier, Goggin, Estrada, & Lunn, Reference Geary, Cormier, Goggin, Estrada and Lunn1993).
The tasks expected to be the most cognitively demanding were two complex visual–spatial processing tasks involving mental imagery and abstract problem solving, mental rotation, and a form completion task. Neither task has a heavy memory load because the visual stimuli are present throughout each task. Mental rotation, involving visual–spatial representation and the ability to mentally “move” those representations, is a cognitive skill that develops gradually. In a typical mental rotation task, participants see two shapes and make a same/different judgment. One member of the shape pair is rotated at various angles, so successful task completion depends on the ability to recognize shape identity despite the apparent dissimilarity produced by rotation. For both adults and children about 8 years and older (Courbois, Reference Courbois2000; Kail, Reference Kail1991a), RT to recognize identical shapes tends to increase linearly with angle of rotation. However, age and stimulus characteristics play a significant role in task performance, with young children being poor at rotating shapes without a salient axis and also poor at rotating shapes that have identifiable components (that can be independently rotated). Thus, a linear trend across rotation angle may not always be present in a given task (Courbois, Reference Courbois2000; Rosser, Reference Rosser1994; Takano, Reference Takano1989).
Participants in the mental rotation study noted earlier by Johnston and Ellis Weismer (1983) were first and third graders who rotated geometric forms; children with LI were slower than age peers to complete the task. Miller et al. (Reference Miller, Kail, Leonard and Tomblin2001) found that third graders with LI (an average of 9 years of age) were less accurate and slower in mental rotation of nonsense figures than age peers. McLeay (Reference McLeay2003) found that proficient Welsh–English-speaking adults were quicker than their monolingual English-speaking peers to complete a type of mental rotation task using images of knotted and unknotted ropes. Group differences emerged only for complex stimuli (i.e., ropes with five or six knots). Following Bialystok (Reference Bialystok1999), the results were interpreted as proficient bilingual language processing leading to greater efficiency in attentional control and nonlinguistic problem solving.
The other spatial task, form completion, was adapted from the Revised Minnesota Paper Form Board Test (MPFBT; Likert & Quahsa, Reference Likert and Quahsa1970), and involved mental assembly of several smaller geometric forms into one larger form. Children with LI have been found to be less accurate than age peers on this task (Kamhi, Catts, Mauer, Apel, & Gentry, Reference Kamhi, Catts, Mauer, Apel and Gentry1988; Savich, Reference Savich1984). For example, Kamhi et al. (Reference Kamhi, Catts, Mauer, Apel and Gentry1988) found that 6- to 9-year-old children with LI or a reading impairment made more errors than age peers on MPFBT items. Bialystok and Majumder (1998) found that bilingual children who were equally proficient in French and English were more accurate in pattern analysis (a block design task) than both monolingual English-speaking children and “partially” bilingual Bengali–English-speaking children who showed greater proficiency in English. The proficient bilingual children also tended to be more accurate than the other two groups in a horizontal coordinate task (drawing a water line).
STUDY PREDICTIONS
We made four predictions about the possible roles of group differences, perceptual–motor ability, task difficulty, and chronological age in nonlinguistic performance. All predictions were motivated by the empirical literature rather than being framed in any one particular theory of LI. First, given the wide array of nonlinguistic tasks on which children with LI have been found to show deficits, we made the broad prediction that nonlinguistic performance in general is a reliable part of the LI phenotype. We also assumed that the nonlinguistic tasks would be free of language-specific experiences, and thus, that the typical bilingual and monolingual children would perform equivalently across tasks. However, group differences could be present in tasks that are linguistically mediated and/or have a visual–spatial problem-solving component, such as arithmetic, mental rotation, and form completion. The seven tasks were not designed to manipulate selective attention, and we were less able to address the issue raised by Bialystok (Reference Bialystok1999) of a potential bilingual advantage in tasks requiring inhibition of information.
The second prediction was that perceptual–motor RT would explain some but not all of the variance in higher level tasks. That is, we expected the slower RT of the LI group would reflect higher level cognitive operations as well as a perceptual–motor deficit. Lahey and Edwards (1996) found that detection RT (an auditory–visual task composite) contributed about one-third of the variance in picture naming RT for 4- to 9-year-old monolingual children with and without LI. Children with LI also were slower than age peers in another simple auditory detection task; however, this difference was insufficient to explain slower LI RT in a lexical decision task. Kohnert et al. (Reference Kohnert, Windsor and Miller2004) found that group differences in a choice visual detection task were not sufficient to explain LI slower RT in a word recognition task relative to age peers.
Given our earlier findings of no qualitative group differences in response to within-task difficulty, the third prediction was that we would replicate this result. Given the very small research base with bilingual children, we made the parsimonious assumption that bilingual children would show the same patterns as monolingual children. In the absence of information about a developmental trajectory of nonlinguistic performance in LI, the fourth prediction was that RT would decrease with age but that group patterns of performance would be similar at different age points on each task. Although Miller et al.'s (Reference Miller, Leonard, Kail, Zhang, Tombin and Francis2006) finding that children's RT at one age predicted RT 5 years later does not speak to the course of development per se, these findings do suggest the persistency of nonlinguistic deficits in LI.
METHOD
Participants
One hundred 8- to 13-year-old children took part in the study, recruited mainly through advertisements in local newspapers (see also Windsor & Kohnert, Reference Windsor and Kohnert2004). Twenty-eight children (16 boys, 12 girls) were monolingual English speakers with a primary LI (LI group), 50 children (22 boys, 28 girls) were typical monolingual English speakers (EO group), and 22 children (13 boys, 9 girls) were typical sequential bilingual Spanish–English speakers (BI group). Average age of the LI group (M = 10 years, 6 months [10;6], SD = 1;7) and the EO group (M = 10;7, SD = 1;10) was equivalent; the BI group was about 9 months younger (M = 9;9, SD = 1;5). All children passed screening tests of hearing (acuity), vision (color and acuity), and oral–motor skills; and no child had a history of neurological or socioemotional concerns. Most children preferred to use the right hand (Oldfield, Reference Oldfield1971), and the proportion of right-hand preference was equivalent across groups. About 70% of children in the LI group and all children in the EO group were Caucasian. All children in the BI group were Hispanic/Latino. Children tended to be from middle-income homes. However, some children in the EO group came from higher income backgrounds than children in the other groups. On the Hollingshead (Reference Hollingshead1975) 5-point scale (1 = higher socioeconomic status), the EO group obtained a mean rating of 2.00 (SD = 0.97). The LI and BI groups obtained means of 2.39 (SD = 0.83) and 3.27 (SD = 1.08), respectively.
The LI group met conventional criteria for specific LI. Each child had a listening and/or speaking standard score on the English version of the Clinical Evaluation of Language Fundamentals—Third Edition (CELF-E; Semel, Wiig, & Secord, Reference Semel, Wiig and Secord1995) that was greater than 1 SD below the mean. Thirteen children had a mixed expressive–receptive impairment, with both listening and speaking standard scores below 85. Nine children had an expressive-only impairment and 6 had a receptive-only impairment. All but 2 of the 28 children had a history of receiving special services. Each child in the LI group had a standard score of 85 or above on the Test of Nonverbal Intelligence—Third Edition (TONI; Brown, Sherbenou, & Johnsen, Reference Brown, Sherbenou and Johnsen1997). Each child in the EO group had CELF-E and TONI scores that were no greater than 1 SD below the mean.
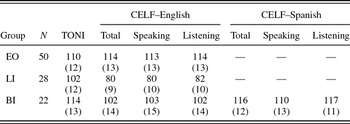
The BI children all learned Spanish as a first or primary language and attended English-only educational programs. Parents were interviewed about their children's pattern of language use in Spanish and English. Children were reported to have 4–8 years of consistent English experience. All BI children were performing at or above grade level in the mainstream English educational environment, and could participate fully in the experimental tasks administered in English. Alongside this overall reported English competency, children continued to use Spanish as the primary language when interacting with parents in the home setting. Independent validation of abilities in each language was obtained using Spanish (Semel, Wiig, & Secord, Reference Semel, Wiig and Secord1997), and English versions of the CELF, administered in counterbalanced order across children. Each child in the BI group had a standard score of 85 or above on both test versions. Because parent report has not always been found to be an accurate indicator of language ability in bilingual Spanish–English school-age children, independent measures of ability in each language were considered most appropriate (cf. Goldstein, Fabiano, & Washington, Reference Goldstein, Fabiano and Washington2005). Standard test scores for each of the three groups are shown in Table 1.
Standard test scores for participant groups

Note: Standard deviations are in parentheses. EO, typical English-only speaking children; LI, English-only speaking children with a language impairment; BI, typical Spanish--English speaking children; TONI, Test of Nonverbal Intelligence; CELF, Clinical Evaluation of Language Fundamentals total, speaking (expressive), and listening (receptive) scores are given. The group difference in mean TONI scores was significant, F (2, 99) = 6.14, p < 0.01, f = .4, with the LI group score below that of the other two groups.
General procedures
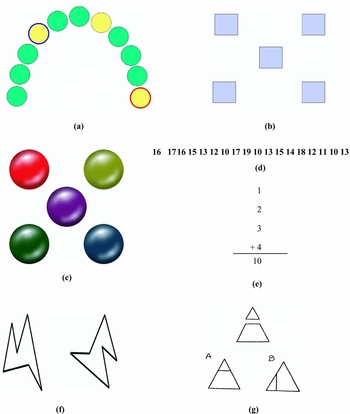
Half of the children in each group first took part in odd man out followed in order by pattern matching, form completion, arithmetic, mental rotation, serial memory, and number search. The other half of the children took part in mental rotation followed by serial memory, number search, arithmetic, form completion, pattern matching, and odd man out. The two task orders were selected randomly and tasks were administered over two 1.5-hr sessions. All tasks were implemented as choice RT tasks using E-Prime software. In six tasks, children used the index finger of the preferred hand to press one of two response buttons as quickly as possible to indicate a decision, moving the finger from a home position to make a response for each trial. Children used a computer mouse to respond in serial memory. Children received standard task instructions, and took part in training and practice trials prior to experimental trials. During eight training trials in each task, children were given feedback about response accuracy and speed and about consistent finger placement on the response buttons. In practice, children saw another eight trials without feedback, and were required to achieve a minimum of six accurate responses before proceeding to the experimental trials. Children who did not meet this criterion repeated the training and practice. Each task included four levels of task difficulty, with trials presented randomly. As a measure of perceptual–motor RT in an elementary visual task, data from the same children on a choice visual detection task (Kohnert & Windsor, Reference Kohnert and Windsor2004) was used. This task matched the format of the other tasks in that children used the index finger to press one of two response buttons as quickly as possible. Stimuli and procedures for each experimental task and the choice visual detection task are described below. Example stimuli are shown in Figure 1.
Example stimuli from experimental tasks. These include (a) a Level 4 trial in odd man out, (b) a five-figure array in pattern matching, (c) the presentation array for serial memory, (d) a Level 1 trial in number search, (e) a Level 3 “yes” (correct) trial in arithmetic, (f) a Level 1 “same” trial in mental rotation, and (g) a Level 1 trial from form completion. [A color version of this figure can be viewed online at www.journals.cambridge.org]

Odd man out
Eleven circles with a diameter of 25 ms were presented equally spaced in a semicircular array on a computer screen. Three circles were yellow target circles; the others were green nontarget circles. Target circles were identified uniquely; one had an outer blue ring, another had a red ring, and the third had no outer ring. Target circles were arranged so that either the blue- or red-ringed circle was “paired” with the third yellow circle in the sense that it was closer to this circle (Figure 1a). Children identified the other circle as the “odd man out.” There were 48 unique trials (12 trials in each of four levels of task difficulty), with 5 trials repeated for the purpose of checking response reliability. Task difficulty was manipulated by varying the distance between the paired circles relative to the distance between the pair and odd man out. Pilot testing indicted that the easiest level, Level 1, was when the distance between the paired circles and odd man out followed a 1:3 or 1:4 ratio (i.e., there was one nontarget circle between the paired circles and either three or four nontarget circles separating the odd man out). In Level 2, the paired circles were positioned adjacent to each other, with the odd man out being in any of the other nonadjacent positions. In Level 3 there was either a 1:2 or 2:4 distance ratio. At the hardest level, Level 4, the distance between the paired circles and odd man out was close, with a 2:3 or 3:4 ratio. Children identified the odd man out by pressing response buttons marked by blue and red dots. RT for accurate responses was measured from trial onset.
Pattern matching
As shown in Figure 1b, children saw a target five-shape array on a computer screen. This was followed by an identical or very similar five-shape array at a 1-, 2-, 3-, or 4-s interval (Levels 1–4). Shape arrays differed in the shapes, colors, orientations, and/or interior details used. For example, one target shape array consisted of a row of five different colored stars placed diagonally across the computer screen. Another target array consisted of five hexagons placed in two horizontal rows. The first array in each presentation pair appeared for 3 s; the second array remained in place until children pressed a response button. There were 100 pairs of stimulus presentations, with 25 pairs at each difficulty level (13 same, 12 different). Ten pairs (6 same, 4 different) were repeated for checking reliability. Children pressed response buttons labeled same/different to make a judgment about whether the two arrays were identical. RT for accurate responses was measured from the onset of the second array in the pair.
Serial memory
Five equidistant, three-dimensional, colored circles were created using Adobe software and presented on a computer screen. Four of the circles appeared as the corner of a square, with the fifth circle placed in the center (Figure 1c). Children saw the circles illuminate in a given sequence, with each circle illuminating for 300 ms followed immediately by another circle illuminating. There were 80 sequences, increasing from sequences of two to five circles (Levels 1–4, with 20 sequences at each level). Eight sequences were repeated for reliability checking. A 150-ms, 1000-Hz tone indicated the end of each sequence. Children responded by clicking the computer mouse on each circle to replicate the sequence as quickly as possible after the tone. To show that the children had used the mouse accurately, the circle illuminated for 150 ms when the mouse was clicked on any circle. Of interest was total RT to complete each sequence. RT for accurate responses was measured from the end of the 1000-Hz tone with the 150-ms illumination periods subtracted.
Number search
Children responded to the presence/absence of a target number in a serial array of 19 numbers (Figure 1d). The target number appeared on the left side of a computer screen and remained visible throughout each trial. In 100 experimental trials the target number also appeared in one of four equally spaced positions in the number array, in the 2nd, 7th, 12th, or 18th position (Levels 1–4). The target number appeared in each of the four positions in 25 trials, and was absent from the array in 50 other trials. Ten trials in which the target number was present were repeated for the purpose of checking response reliability. Children were instructed to search for the target number by scanning from left to right. Only numbers between 10 and 19 were used in the task to keep the visual similarity of numbers constant across and within trials, and to encourage serial scanning. Thus, numbers (except the target number) could be repeated in the array. Children pressed response buttons labeled yes/no to indicate the presence/absence of the target number. RT for accurate responses was measured from trial onset.
Arithmetic
A series of simple addition problems with correct or incorrect answers were presented vertically in large black font on a white computer screen (Figure 1e). There were 100 trials, with 25 addition problems at each of four levels (13 correct and 12 incorrect answers). Levels 1–4 were represented by problems involving the addition of two to five digits (using 0–9). Ten trials (five correct) were repeated for the purpose of reliability checking. Children pressed response buttons labeled yes/no to indicate the correctness of the addition problems. RT for accurate responses was measured from trial onset.
Mental rotation
Shape pairs were presented on a computer screen, with the target shape on the left side of the screen and the other shape on the right side (Figure 1f). Ten black-and-white, straight-edged, nonsymmetrical polygons were created using Adobe software. Each polygon was created from a 7.5-cm square and contained six or seven angles. To make the task easier, a salient feature (e.g., a distinct projection) was identifiable in each shape. Eight other stimuli were created from each of the 10 target shapes. These included the target shape at 45°, 90°, 135°, and 180° rotation and the mirror images of the target shape at the same four angles of rotation. Thus, each target shape was paired with the same shape at one of the four angles of rotation in 40 trials and paired with a different, mirror image at one of the four angles of rotation in 40 trials. The 80 stimulus trials were presented randomly. Task difficulty (Levels 1–4) was determined by rotation angle of the second shape (45°, 90°, 135°, and 180°), with 10 “same” and 10 “different” trials at each of the four levels. Eight trials (four same, four different) were repeated to check reliability. Pilot work showed that the conventional format with simultaneous shape presentations resulted in very low accuracy. Accuracy was improved by presenting the target shape in isolation and then presenting the second shape (via an examiner mouse click) when a child said he/she was “ready.” This procedure was used in the experimental task. Children pressed response buttons labeled same/different to make a decision. RT for accurate responses was measured from presentation of the second shape.
Form completion
Children were presented with geometric form stimuli from the MPFBT and chose the correct form assembly from one of two choices labeled A and B (Figure 1g). Forty MPFBT items were used, divided into four levels with 10 items. There were two forms to be assembled in items at Level 1, three forms at Level 2, four forms at Level 3, and five forms at Level 4. Four items (one from each level) were repeated to check reliability. Stimuli were presented in a small booklet, with one item per page, with the unassembled pieces at the top of a page and the two options of assembled forms at the page bottom. To obtain the RT measure, the examiner pressed a computer key simultaneously with presentation of each page. Children pressed one of two response buttons to indicate the choice for each item. RT for accurate responses was measured from the examiner's computer key press.
Choice visual detection
The procedure and results for this task are described by Kohnert and Windsor (2004). The task was administered in random order to the children in the midst of the other seven tasks. Children indicated the presence of a blue or red circle presented on a computer screen by pressing one of two response buttons. RT for accurate responses was measured from stimulus onset. Children responded in four blocked conditions, each with 25 trials. There were four blocked response levels (pressing a response button with the preferred and nonpreferred hand, pressing a foot pedal with the preferred and nonpreferred foot). All children had at least 95% task accuracy, and chronological age accounted for about 40% of the variance in overall detection task RT. RT from only the simplest level was used here, that is, using the index finger of the preferred hand. Mean RT at this level was 678 ms (SD = 181 ms) for the EO group, 745 ms (SD = 219 ms) for the LI group, and 683 ms (SD = 135 ms) for the BI group.
Analyses
Task accuracy was determined from trials with “same” pairs in pattern matching and mental rotation, from trials in which the target number was present in number search, and from trials with correct additions in arithmetic. All trials were analyzed in odd man out, serial memory, form completion, and choice visual detection. RT was obtained from accurate responses in each task. RT outliers, defined as ±2 SD from the mean task RT for an individual child, were excluded. There were some far-outlying RT values in serial memory and mental rotation, and responses above 8 s were excluded from these tasks before trimming ±2 SD. These procedures resulted in eliminating 5.0% of the data in odd man out, 5.4% in pattern matching, 3.9% in serial memory, 4.1% in number search, 4.6% in arithmetic, 5.5% in form completion, and 9.9% in mental rotation (reflecting the number of outlying values in this task). An equivalent proportion of responses was excluded from each group in each task.
There were four sets of analyses. The first set of accuracy and RT analyses explored differences in groups and difficulty levels in each task using an analysis of covariance (ANCOVA; age as the covariate). Significant main and interaction effects were examined with Bonferroni-adjusted pairwise comparisons. The second analysis examined interrelationships among tasks and the role of motor RT from choice visual detection as a predictor of RT performance in the other tasks. Because the easiest task level has the highest accuracy and also arguably minimizes the effect of experience, it provides the least biased RT comparison among groups. Thus, RT at Level 1 was of interest for this analysis. Pearson correlations were used to identify task associations, again with Bonferroni adjustment. Even though it might obscure group differences in patterns of association, all 100 children were included in this analysis because of the large number of variables (i.e., the smaller sample sizes in the LI and BI groups would lead to unreliable correlation estimates). Regression analyses were used to determine the contribution of motor speed to performance on other tasks. Separate regression analyses for each group were used here because of the smaller number of predictors. The fourth analysis provides a trajectory of individuals’ mean RT at Level 1 in each task across ages. An analysis of variance (ANOVA) was used to identify task differences at younger versus older ages for each group.
RESULTS
Response reliability
Each of the three groups of children showed response reliability above 80% in five of the seven tasks, with a mean reliability across groups of 84.9% in odd man out, 81.3% in pattern matching, 82.9% in number search, 87.7% in arithmetic, and 80.5% in mental rotation. Reliability was lower in form completion (77.6%) and lower still in serial memory (71.1%). Reliability was equivalent across groups except for serial memory. Here, LI group reliability was at 63.4% compared to the BI group (73.8%) and the EO group (76.0%). Because reliability trials came from the more as well as less difficult levels in each task, these reliability values were not unexpected. Higher reliability also may have been constrained by the relatively small number of reliability items (e.g., with only four trials repeated in form completion). As shown below, reliability was lowest in the three tasks in which there was the lowest group accuracy overall.
Accuracy across groups and levels of task difficulty
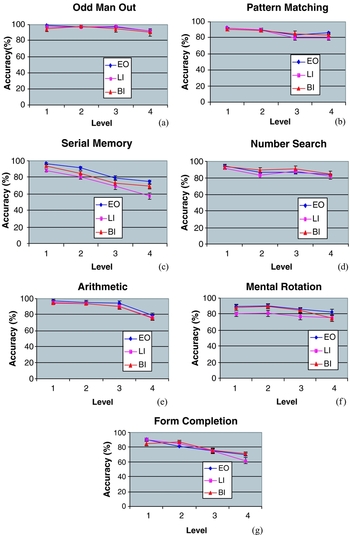
Figure 2 shows group accuracy (age adjusted) in each of the seven tasks. Because our emphasis was on RT, the tasks were designed to be performed with high accuracy by all groups. The Level 1 results confirmed that this was so when the tasks were easy. The EO group showed at or above 90% accuracy at Level 1 in all tasks and the BI group did so in all tasks except in mental rotation and form completion; accuracy was at or above 85% in these two tasks. The LI group performed at 90% or above at Level 1 in all tasks except serial memory, where accuracy was marginally lower than in mental rotation, where accuracy was at 80%.
Mean accuracy (adjusted for age) across groups and tasks. (a–g) For Levels 1–4, odd man out levels are (1:3 or 1:4), (adjacent), (1:2 or 2:4), and (2:3 or 3:4) distance ratios. Pattern matching levels are “same” arrays at 1-, 2-, 3-, and 4-s delay intervals. Serial memory levels are two-, three-, four, and five-tone presentations. Number search levels reflect the target number in the 2nd, 7th, 12th, and 18th serial positions. Arithmetic levels are two-, three-, four-, and five-digit additions. Mental rotation levels are “same” items at 45°, 90°, 135°, and 180° rotation angles; form completion levels are two, three, four, and five forms to be assembled. [A color version of this figure can be viewed online at www.journals.cambridge.org]

The LI group's lower Level 1 accuracy in serial memory and mental rotation remained when overall accuracy was examined. Separate two-way ANCOVAs (Group × Level) indicated no significant group differences in odd man out (Figure 2a), pattern matching (Figure 2b), number search (Figure 2d), arithmetic (Figure 2e), or form completion (Figure 2g). However, the LI group had significantly lower accuracy than both the BI and EO groups in mental rotation (Figure 1f), F (2, 96) = 12.29, p < .0001, f = .25. LI group accuracy also was significantly lower than the EO group in serial memory (Figure 2c); BI accuracy fell between the EO and LI groups on this task, F (2, 96) = 4.11, p = .02, f = .32.
Group accuracy declined in five of the seven tasks as difficulty level increased. There were significant effects of task level for pattern matching, F (3, 288) = 2.91, p = .03, f = .13; serial memory, F (3, 288) = 10.18, p < .0001, f = .72; number search, F (3, 288) = 38.60, p < .0001, f = .29; arithmetic, F (3, 288) = 4.74, p = .003, f = .72; and form completion, F (3, 288) = 4.32, p = .005, f = .63. Accuracy was close to ceiling level in odd man out, precluding robust level effects. There was no significant decline in accuracy as angle of rotation increased in mental rotation. There was no significant Group × Level interaction effect in any ANCOVA except for form completion. The overall group difference and large effect size in this task was driven by the lower LI accuracy compared to the other two groups at Level 4, F (6, 288) = 4.84, p = .004.
RT across groups and levels of task difficulty
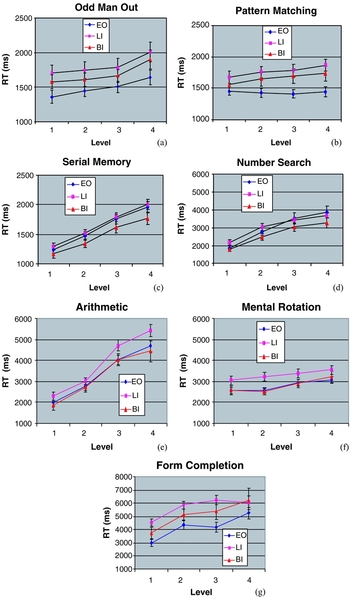
Figure 3 shows groups’ mean RT (age adjusted) for each level in each task. Although age adjusting was appropriate because of the broad age range, age and motor RT were expected to be correlated. That is, removing the variance for age in an ANCOVA also removed at least some of the variance due to motor RT. The group differences in Figure 3 should be considered with this in mind. The LI group was observably slower than the other groups in arithmetic and mental rotation, with the two typical groups showing overlapping performance (Figure 3e and f). There were three tasks in which the LI group also was observably slower than the EO group, but with the BI group falling between the other two groups. These three tasks were odd man out (Figure 3a), pattern matching (Figure 3b), and form completion (Figure 3g). Although there were no large differences in the other two tasks, serial memory (Figure 3c) and number search (Figure 3d), the BI group tended to be faster than both monolingual groups.
Mean response time (RT, adjusted for age) across groups and tasks. For serial memory, the increasing RT across levels is an artifact because the RT is directly affected by the length of the tone sequences in this task. In the case of mental rotation, the English-only (EO) group spent a shorter mean time looking at the first shape before seeing the second shape appear (1784 ms); however, this RT was not significantly different from that of the language impairment (LI) group (2007 ms) or bilingual (BI) group (2027 ms). [A color version of this figure can be viewed online at www.journals.cambridge.org]

Two-way ANCOVAs for each task were used to analyze the effects of group and task level. As expected from visual inspection, statistically significant group differences were found in five tasks: odd man out, F (2, 96) = 4.15, p = .02, f = .23; pattern matching, F (2, 96) = 6.12, p = .003, f = .10; arithmetic, F (2, 96) = 2.94, p = .05, f = .13; mental rotation, F (2, 96) = 3.33, p = .04, f = .22; and form completion, F (2, 96) = 5.05, p = .03, f = .14. In each instance, the LI group had a significantly longer RT than the EO group. In addition, as was expected, there was no significant difference between EO and BI RT; however, there also was no significant difference between LI and BI RT. The EO and BI groups had an essentially equal mean RT in arithmetic and mental rotation (and indeed the BI group had a slightly faster mean RT than the EO group in arithmetic); and the nonsignificant BI-LI group difference in these two tasks most likely reflects the greater variability in the BI group at Level 4 (Figure 3e and f).
Significant and robust main effects of difficulty level were found in four of the six tasks where this was relevant: odd man out, F (3, 288) = 10.47, p < .0001, f = .14; number search, F (3, 288) = 34.94, p < .0001, f = .18; and arithmetic, F (3, 288) = 57.09, p < .0001, f = .72. For pattern matching, there was a Group × Level interaction effect, with only the LI and BI groups showing an increasing RT with difficulty level, F (6, 288) = 2.90, p = .009. Although there was a tendency for RT to increase across levels (Figure 3f and g), there were no significant level effects in the two complex spatial tasks, mental rotation or form completion, and no other Group × Level interaction effect. (Note that the RT increase for serial memory is artificial because RT reflects the length of the total sequence, with the longest sequence at Level 4.)
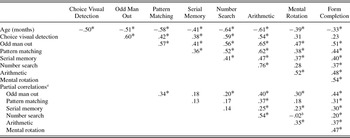
Contribution of perceptual–motor speed to task RT
Table 2 shows the correlations among age and task RT, using each child's mean RT at Level 1 for each task, including choice visual detection. There were robust and largely significant correlations among tasks. The one outlier is the correlation between number search and mental rotation in which the LI group showed a different pattern to the EO and BI groups (see Table 2). As expected across this age range, choice visual detection and age were significantly correlated (r = .50). Each contributed to task RT. The effect of removing both chronological age and choice visual detection RT is shown in the partial correlation matrix. Robust intercorrelations among tasks remained after accounting for these shared contributions, although the strength of association was lower. The highest correlation was for arithmetic and number search (r = .54) followed by mental rotation and form completion (r = .47), odd man out and form completion (r = .44), arithmetic and odd man out (r = .40), arithmetic and form completion (r = .37), and arithmetic and mental rotation (r = .35).
Correlations and partial correlations among tasks with response time at Level 1

aThe correlations are adjusted for age and choice visual detection.
bWhen each of the typical English-only (EO) and Spanish--English speaking (BI) groups are considered separately, r = .20; when the LI group is considered separately, r = −.42.
*p < .05 (with Bonferroni correction).
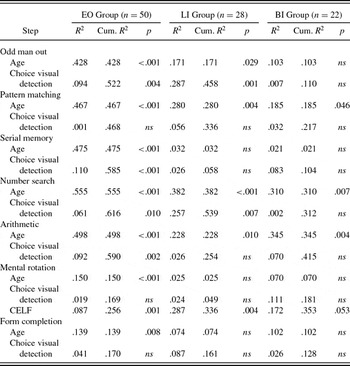
Stepwise regression analyses for each group were used to analyze the contribution of choice visual detection beyond that of age to RT in the tasks. To be conservative, age always was entered first even when choice visual detection was the stronger predictor. The results are shown in Table 3, with what appears to be the least reliable results for the smallest BI group. For the EO group (N = 50) 47–62% of the RT variance in five tasks could be explained by age and choice visual detection RT. A lower proportion of variance could be attributed to these two predictors in the two longer tasks, mental rotation and form completion (17%). Lower proportions of variance were captured in each task in the LI group, but this could well reflect the smaller sample size. However, relative to the EO group, a much smaller proportion of variance, only 6%, could be attributed to age and choice visual detection RT for serial memory. For the small BI group (N = 22), no significant variance was captured by the two variables, except in pattern matching, number search, and arithmetic, where age contributed significantly to the variance. CELF-E (for the EO and LI groups) and CELF-S (for the BI group) was entered as a predictor after age and choice visual detection to explore the contribution of language ability. Table 3 shows that CELF score accounted for a significant portion of additional variance in mental rotation for all three groups.
Multiple regressions predicting task response time at Level 1

Note: Cum. R 2, cumulative R 2. Age is calculated in months. EO, typical English-only speaking children; LI, English-only speaking children with a language impairment; BI, typical Spanish--English speaking children; CELF, standard score from the English version of the Clinical Evaluation of Language Fundamentals for the EO and LI groups and the Spanish version for the BI group. The Test of Nonverbal Intelligence standard score added no significant variance in any regression, and the CELF score added no significant variance in any regression other than mental rotation. ns, not significant at p = .05.
This was the only task in which CELF score contributed significant variance, and suggests that this task is linguistically mediated in some way.
RT and development
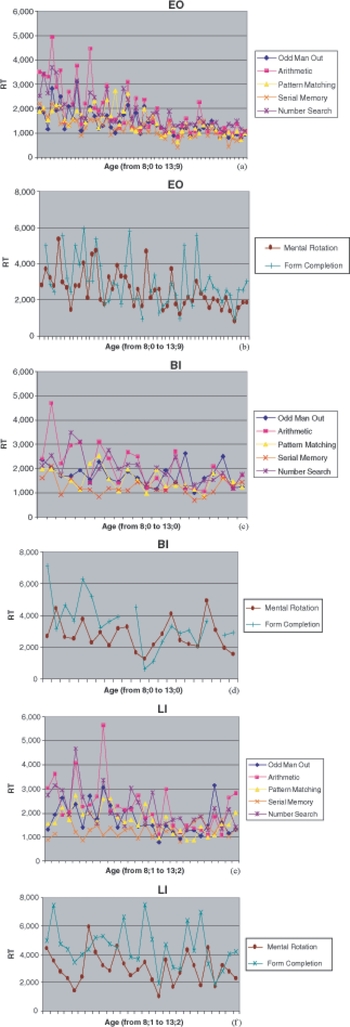
Figure 4 shows individual children's mean RT at Level 1 for each task, with each point on the x axis indicating a child at a given age (in months) from youngest to oldest. The EO group showed a systematic decrease with age in RT and in within-task RT variability on the four shorter tasks: odd man out, pattern matching, serial memory and number search. This was true also for arithmetic, but with more variability at younger ages than in the other four tasks (Figure 4a). For the longer visuospatial tasks, RT also appeared to decrease with age, but with high individual variability in form completion and to a lesser extent in mental rotation (Figure 4b). The same general pattern held for the BI group (Figure 4c and d) and for the LI group, although Figure 4e suggests a somewhat flatter RT slope across age for this group, perhaps especially for serial memory. In the EO and BI groups, there was marked variability in mental rotation and form completion (Figure 4f) and some greater variability in arithmetic (Figure 4e).
Mean Level 1 response time (RT) for individual children in each task and group. Shown are (a,b) the English-only (EO) group, (c,d) the bilingual (BI) group, and (e,f) the language impairment (LI) group. Far outlying data points were omitted for one LI child in number search (above 4 s) and for two EO and two BI children in form completion (above 8 s). [A color version of this figure can be viewed online at www.journals.cambridge.org]

To examine performance over time statistically, each group was divided in half into younger and older subgroups. The younger EO subgroup had a mean age of 9;0 (SD = 0;10) and the older subgroup were about 3 years older at a mean age of 12;2 (SD = 1;0). The younger and older LI subgroups were separated by about 2.5 years, with mean ages of 9;3 (SD = 0;11) and 11;8 (SD = 0;7), respectively. The two BI subgroups were about 2 years apart, with mean ages of 8;8 (SD = 0;6) and 10;11 (SD = 1;0). Separate two-way ANOVAs were used to analyze the effects of age subgroup and task. The older EO subgroup had a significantly shorter RT than the younger subgroup, F (1, 48) = 29.35, p < .001, d = .49, and arithmetic, mental rotation, and form completion were longer than other tasks, F (6, 288) = 11.40, p = .001, f = .90. The Age × Task interaction was not significant. The LI group also showed significant effects of age, F (1, 26) = 15.21, p = .001, d = .16, and task, F (6, 162) = 7.03, p < .001, f = .32, with the same three tasks being longer than the other tasks. The BI group also performed equivalently, with the same significant effects of age, F (1, 20) = 17.99, p < .001, d = .48, and task, F (6, 120) = 12.88, p < .001, f = .70. The Age × Task interaction effect also was significant, F (6, 120) = 5.14, p = .001. This statistical effect is difficult to identify unambiguously but appears to be because of the larger RT decrease with age for form completion and arithmetic than for other tasks.
Summary
The LI group was less accurate in mental rotation than both typical groups and also less accurate than the EO group in serial memory. Group accuracy declined as task difficulty increased in all tasks except mental rotation (and odd man out, in which there was ceiling performance). There was a qualitatively similar accuracy profile across groups for all tasks except the most difficult task, form completion. In this task, the LI group showed disproportionately lower accuracy at the hardest task level. The LI group was observably slower than both typical groups in mental rotation and arithmetic, and also slower than the EO group in odd man out, pattern matching, and form completion. RT significantly increased as task difficulty increased except in the two longest tasks, mental rotation and form completion. There was a qualitatively similar RT profile across groups for all tasks except pattern matching. Unlike the LI and BI groups, the EO group did not show an RT increase with task difficulty here.
Significant correlations among tasks remained after accounting for age and choice visual detection RT. Age and choice visual detection RT together contributed significantly to all tasks for the EO group, but with choice visual detection adding significant variance after age in only four tasks (odd man out, serial memory, number search, and arithmetic). For the LI group additional significant variance was contributed only in odd man out and number search. Although no significant effects were found for the BI group, this likely reflects the relatively small group size. RT trajectories across age showed an overall decline in RT across tasks for each group, with marked RT variability in mental rotation and form completion.
DISCUSSION
There are four main study results related to the predictions of nonlinguistic task similarity in informing the LI phenotype, qualitative similarity across groups, and the contributions of perceptual–motor speed and age. Each of these issues is discussed below.
Group effects across tasks
The children with LI showed a slower RT (age adjusted) than typical monolingual peers on many but not all tasks. When compared with typical sequential bilingual peers, the LI group still tended to show a slower RT, but there were some differential task responses between monolingual and bilingual children that complicate the interpretation of nonlinguistic visual task performance. When only the two monolingual groups are considered, the LI group consistently was slower than the EO group in all tasks except number search and serial memory, a task in which the two group's RT was remarkably similar. Although there also was no difference in number search accuracy, the LI group did show lower serial memory accuracy than the EO group. Given Miller et al.'s (Reference Miller, Kail, Leonard and Tomblin2001) finding that children with LI tended to be slower than age peers in a visual search task using nonsense figures, it was expected that we would find the same group difference in number search as in the other tasks. It may be that the use of similar-looking digits rather than nonsense figures introduces a different kind of scanning or search process.
One new contribution of this study is to compare LI visual task performance with that of bilingual peers. The BI group was separated statistically from the monolingual LI group in only two tasks, in mean accuracy and RT for mental rotation and in mean RT for arithmetic. Although neither RT group difference reached statistical significance, the equivalent mean EO and BI performances in Figure 3e and f strongly suggest that this is an issue of statistical power associated with ANCOVA. Task accuracy also may play a role in reliability of the RT results, with the slightly lower accuracy at Level 4 in these tasks leaving a fairly small number of trials on which to base the RT measures (Salthouse & Hedden, Reference Salthouse and Hedden2002). Arguably, these two tasks are the most related to language ability, and the finding that the LI group's performance should fall below that of the two typical groups is not surprising from this perspective.
However, the BI group fell between the EO and LI groups in odd man out, pattern matching, and form completion. Although we assume that different mechanisms are at play in the BI and LI group's performances; we do not know why the BI group was not significantly faster than the LI group in these three tasks or why the BI group tended to be faster than the two monolingual groups in serial memory and number search. It may simply be an issue of statistical power, with high variability in the fairly small BI group. The nonlinguistic tasks were not designed to manipulate Bialystok's (1999) notion of differential processing for analysis and inhibition in problem solving tasks, and this may be a useful avenue to explore with these tasks.
Response to task difficulty
A second contribution of the study is to show that typical monolingual and bilingual language learners and impaired monolingual language learners respond to increasing nonlinguistic task difficulty in the same highly predictable way. Where there were robust effects of task level in accuracy or RT, the performance of the three groups was qualitatively similar. All groups had lower accuracy and/or a slower RT as task difficulty increased. The two exceptions to this finding were that LI accuracy was significantly lower than EO or BI accuracy in form completion only at Level 4 and only the LI and BI groups showed an increasing RT with difficulty level in pattern matching (although all three groups showed a decline in accuracy). Even in mental rotation and form completion, where there is substantive RT variability among younger and older children, all three groups show the same type of variability on these tasks that they do not show on other tasks.
The overall qualitative equivalence in response to task difficulty, as well as the general across-task equivalence with increasing age, supports the idea that language learning may be considered within one theoretical framework that addresses differences introduced by both cognition and experience. Notably, for information-processing accounts of LI that highlight attention, speed, and/or memory efficiency or capacity limitations (see Leonard, Reference Leonard1998, for an overview); these findings suggest that the LI group did not disproportionately exceed those limitations relative to typical peers. Even in the case of pattern matching, where the LI group RT did increase in a disproportionate way to that of the EO group, the LI pattern closely matches that of the typical BI group. It remains possible that qualitative group differences emerge on tasks that are more difficult than those examined here.
Contribution of age and perceptual–motor RT
Children spanned a 6-year age range, and it was expected that age would play a role in task performance. The contribution varied across tasks for the EO group, with age accounting for only 14% of the variance in form completion and 56% in number search. Perceptual–motor speed, as measured by choice visual detection RT made a significant contribution beyond that of age in the EO group across most tasks. The notable exceptions were the two longer visuospatial tasks, mental rotation and form completion, as well as pattern matching. One limitation of the choice visual detection measure is that we cannot isolate motor RT from the time needed to perceptually encode the visual stimulus (inspection time). A more fine-grained RT paradigm is needed to do this, for example, defining the time component from stimulus presentation to the release of a home button as perceptual encoding and the time from release of the home button to pressing the response button as motor speed (Bates & Eysenck, Reference Bates and Eysenck1993). In addition, larger sample sizes are needed to make more robust predictions for the BI and LI groups.
The significant partial correlations among tasks shown in Table 2 may suggest nothing more than a general component related to rapid execution rather than any deeper relation (Savage & Frederickson, Reference Savage and Frederickson2005). Given this caveat, the pattern of association between some tasks bears further investigation to refine the underlying constructs that the tasks may be assessing. This includes the predictably strong association between the two tasks using numeric stimuli, number search and arithmetic, and the two visuospatial tasks, mental rotation and form completion.
The developmental trajectories for each group also speak clearly to the effect of age, but are particularly important for identifying task variability across age. Even though the trajectories are for the easiest level in mental rotation (45° rotation) and in form completion (two shapes to be assembled), there were substantial RT differences in these two tasks beyond the effect of age. The other task where there tended to be higher variability was arithmetic. These are the longest three tasks, and they are thus much more vulnerable to be influenced by individual differences in experience and strategy use than the other tasks. It is notable that the two tasks that most clearly separated the LI group from the EO and BI groups, mental rotation and arithmetic, also may be linked to individual variation in language more directly than the other tasks. Also, there appears to be a flatter LI RT trajectory across age for serial memory than there is for the EO group (see Figure 4a and e), with age accounting for a substantive proportion of EO but not LI task performance (Table 3). Although age also accounted for no significant variance in serial memory performance for the BI group, the variability in this smaller group precludes robust interpretation. Serial memory was a task in which the EO and LI groups showed a strikingly equivalent mean RT, although EO accuracy was higher. The developmental trajectory provides additional information that distinguishes the performance of these two groups.
Overall, we cannot assume that all nonlinguistic tasks are equally sensitive to the LI profile. There is a clear need for systematic cross-task and cross-stimulus comparisons to describe specific nonlinguistic deficits in LI and to identify the underlying mechanisms that are associated with different instances of diverse language learning. Finally, as the linguistic and cultural diversity of the United States increases, there is a compelling practical need to develop assessment tools that are not biased against children who have a native language other than English. Nonlinguistic measures that deemphasize language ability may provide an additional avenue to address this need.
ACKNOWLEDGMENTS
Funding for this research was provided by grants from the National Institute on Deafness and Other Communication Disorders (DC05542, DC04437) and the National Institute of Child Health and Human Development (HD053222). We are grateful to Edward Carney and Dongsun Yim for technical and statistical assistance. We also thank the following individuals for help with stimulus development, data collection, and data scoring: Meredith Bailey-Orr, Krista Bowe, Tara Cassidy, Kerry Danahy, Mark DeRuiter, Caren Dorman, Martha Hegewisch, Krisana Theis, and Sara Turman. Amanda Loxtercamp currently is affiliated with Advocate Hope Children's Hospital, Oak Lawn, IL.