INTRODUCTION
Land use and land cover dynamics are widespread, driven by human actions but, in turn, they also produce changes that impact humans (Agarwal et al., Reference Agarwal, Green, Grove, Evans and Schweik2002) and alter the availability of different biophysical resources including water, soil, vegetation and animal feed. Ethiopia is at a crossroads and needs to improve its biophysical resources in order to feed its growing population. Currently in Ethiopia less than 2.5% of the country is forested (EFAP, 1994). Food needs by a growing population will lead to a continual conversion of communally owned grazing and shrublands to cultivated lands. According to IUCN (1990), per capita land holdings in Ethiopia will decline from an average of 1.76 ha in 1985 to 0.66 ha in 2015. Less than 5% of the water in rivers is used within Ethiopia (Steenhuis et al., Reference Steenhuis, Collick, Easton, Leggesse, Bayabil, White, Awulachew, Adgo and Ahmed2009) but it is expected that water use (mainly for irrigation) will increase in the future (Molden, Reference Molden2007). Moreover, soil loss is severe and most soil originates from erosion of a small portion of the landscape (Berhe, 2007).The few policies that exist to stop the accelerating rate of land degradation are poorly enacted because institutions involved in land-related policies change frequently. Three different governments have been in power in Ethiopia since 1972, and the policies implemented by each have directly affected land use. Before 1974, the relationship between land users and owners was based on a feudal system (Desta et al., Reference Desta, Kassie, Benin and Pender2000), under which the ownership of land was limited to a few individuals, and most inhabitants could access farmland only through share cropping. The population density was relatively low, and fallow land was common. During the 17 years of the Derg's governance that followed the feudal system, individuals were entitled to own and manage land. The regime rehabilitated degraded land and protected vegetated areas, and encroachment into communal holdings was minimal. Despite changes being made, a state of unfair distribution evolved and land redistribution was undertaken in the early 1990s when the Ethiopian People's Revolutionary Democratic Front first came to power in some parts of the country. Sources of land for redistribution included those parcels whose owners passed away, illegally owned parcels, shrublands, abandoned land and communal holdings. In Amhara Regional State, where mixed crop-livestock farming is the main economic activity, biophysical resources are declining similarly to other parts of Ethiopia (Mwendera et al., Reference Mwendera, Mohamed Saleem and Dibabe1997). As a result, livestock productivity has declined due to water shortages, weed infestation, dry season feed shortages, shortage of grazing lands, poor marketing conditions and diseases (Gizaw et al., Reference Gizaw, Mekonnen and Desta1999). To turn around this declining productivity better strategies are needed to increase agricultural productivity, especially water-use efficiency for food production through better livestock management and other agricultural measures (Harrington et al., Reference Harrington, Gichuki, Gaheb and Woolley2004). However, the bottleneck in developing these strategies is the limited knowledge of the effect of altering land use on productivity and water needs, since only very few studies have been carried out in Amhara. In order to fill this gap, this study aimed to identify and compare changes in land use and land cover, their drivers and impacts over a 30-year period in two contrasting (semi-arid v. sub-humid) areas climatic zones of Amhara. The selected sites were the sub-humid Kuhar Michael watershed located in the Fogera plain near Bahir Dar and the semi-arid Lenche Dima watershed near Woldia, which has low and unreliable rainfall and dry spells and thus very limited potential for irrigation agriculture. In contrast, irrigation is possible in Kuhar Michael from either groundwater or diversions of the Gumera river, allowing production of up to three crops per year.
MATERIALS AND METHODS
Study areas
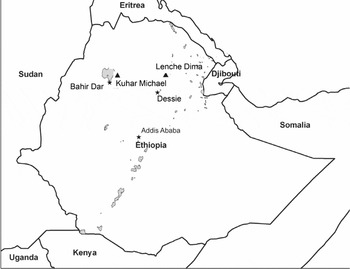
The Kuhar Michael watershed is located at the southern border of Fogera district (Figure 1) with co-ordinates extending from 11°50′37″ to 11°53′37″ N and from 37°38′10″ to 37°42′17″E. It is located within the upper Blue Nile basin and covers an estimated area of about 2755 ha. Annual rainfall is just over 1200 mm, and its altitude ranges from 1792 to 1959 m asl. The Lenche Dima watershed forms part of Laste Gerado peasant association in Gubalafto district (Figure 1) and is located about 20 km away from Woldia, capital of North Wollo zone in the Awash basin. Geographically, the watershed extends from 11°49′13″ to 11°51′57″ N and from 39°40′07″ to 39°44′22″ E and its altitude ranges between 1520 to 1890 m asl. Annual rainfall in Lenche Dima is around 800 mm (Liu et al., 2006).
Location of Kuhar Michael and Lenche Dima Amhara Regional State, Ethiopia.

Field survey and data collection
A socio-economic survey was conducted from August to November 2009, consisting of interviews of selected households and group discussion to generate information on household-level changes in land and livestock holdings, and to gain insight into various political, social and environmental factors that influence decisions on land use and land cover at the household and landscape level. Detailed individual interviews and group discussions were conducted with a total of 50 selected key informants from both study areas (Table 1). A purposive sampling technique was used to select the participants through consultation with development agents, which involved the targeting of individuals who suited the subject and nature of study using predetermined selection criteria. A questionnaire covering a wide range of topics relevant to the central issue of interest was developed and pre-tested to evaluate the understandability of the questions, with modifications made accordingly. The time horizon considered for the socio-economic study matched the period for which satellite images were available starting in 1972.
Characteristics of interviewed households and their land holding.

Satellite images
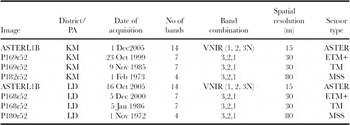
Three LANDSAT and one ASTER satellite images covering the period from 1972 to 2005 were acquired for both locations (Table 2). To aid the analysis of the images, type of land use or cover, percentage ground cover of grassland and shrublands, degree of degradation and past use pattern of selected communal holdings were collected for 340 Ground Control Points (GCPs), with locations determined with a geographical positioning system.
Details about the satellite images used in Kuhar Michael (KM) and Lenche Dima (LD)

Image calibration of the LANDSAT (MSS, TM and ETM+) was accomplished through an automated built-in operator within the ENVI interface. The ASTER image was geo-referenced using GCPs (Mather, Reference Mather2004; Smith Reference Smith2008). For layer stacking, projection was made using the Universal Traverse Mercator system with WGS84. All four bands of MSS and five bands of TM and ETM+, excluding the thermal band, were included during layer stacking.
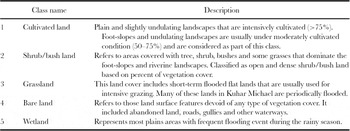
The 2005 ASTER image was the most recent image available for the study areas and served as a reference image. Using the collected GCPs, a supervised land cover classification (Table 3) was performed. The user's and producer's accuracy was reasonable, but as expected there was some difficulty with separating grass and open shrubland covers. For the three LANDSAT images (MSS, TM and ETM+), unsupervised classification was used. An effort was made to integrate the historical information acquired from the surveys. As such, the image quality was improved by unraveling the spectral similarity of different land cover types. More detailed information on the image processing steps is given in Ali (Reference Ali2009).
Land use and land cover classes considered and their description (adapted and modified from Yitaferu, Reference Yitaferu2007).

RESULTS
Land use and land cover dynamics
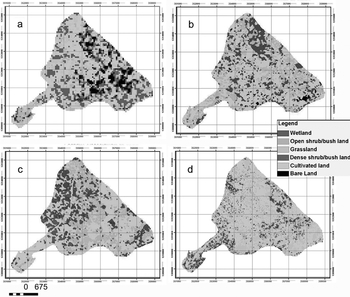
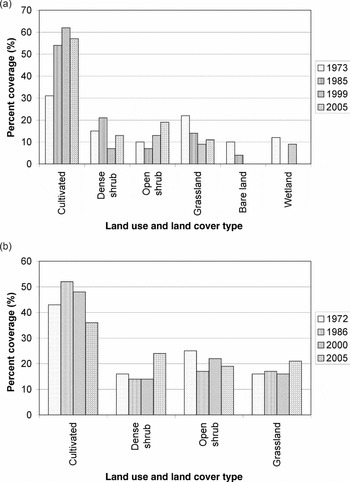
Kuhar Michael. Analysis of the 1973 satellite image reveals that there was 31% cropland and 22% grassland (Figures 2a and 4a) in the Kuhar Michael site. The remaining landscape consisted of shrubland and bare soils, mostly on the steeper parts of the landscape, and 12% of the area was wetland. The 1985 satellite image (Figures 2b and 4a) found that cropland expanded to 54% mainly at the expense of grassland (14% coverage) and bare soil (2%). In addition, the wetlands had disappeared in the November 1985 image, possibly due to drying up after the major rainy season had below average rainfall (McHugh et al. Reference McHugh, McHugh, Eloundou-Enyegue and Steenhuis2007). The sum of the dense shrub and open shrub/bush cover remained nearly constant (Figure 2b and 4a).
(Colour online at http://journals.cambridge.org/eag) Land use and land cover maps of Kuhar Michael in (a)1973, (b)1985, (c) 1999 and (d) 2005.

Analysis of the October 1999 image indicated that the same trend continued from 1985 to 1999 (Figures 2c and 4a). Cultivated (crop) land comprised 62% of the landscape, and grassland decreased to 9%. Wetlands appeared again, covering 9% of the area. Bare soil disappeared and shrublands stayed approximately the same, although a switch occurred between the dense and open shrub cover. Finally, the 2005 image found a slight decrease in cultivated land to 57%, but the difference from the 1999 image was within measurement error (Figures 2d and 4a).
Lenche Dima. In the 1972 image (Figures 3a and 4b), cultivated (crop) land compromised 43% of the Lenche Dima site, and 16% was grassland. The remaining 40% consisted of open and dense shrubs. In 1986 (Figures 3b and 4b), cropland increased to 52%, while both dense and open shrublands declined and grassland remained nearly the same. In 2000, contrary to the trend observed in Kuhar Michael, cultivated land in Lenche Dima declined to 48% (Figure 3c and 4b), likely the result of the expansion of large gullies that were prevalent in the area in 2000. Grassland remained unchanged and open shrub/bushland increased in coverage from 17% to 22% in 2000. In 2005, cultivated land decreased further to about 36% with the shrubland increasing in extent (Figures 3d and 4b).
(Colour online) Land use and land cover map of Lenche Dima in (a) 1972, (b) 1986, (c) 2000 and (d) 2005.

Summary of land use and land cover changes 1972–2005. (a) Kuhar Michael, (b) Lenche Dima.

Trends. The main difference between the study sites was that cultivated land area nearly doubled from 1973 to 2005 (Figure 4a) in moisture-sufficient Kuhar Michael, while in drought-prone Lenche Dima the cropped area slightly decreased over the same period (Figure 4b). The opposite trend was true for grassland, which decreased in Kuhar Michael while slightly increasing in Lenche Dima. Bare land decreased in Kuhar Michael as well. The sum of the dense and open shrubland remained nearly the same over the study period in both watersheds.
In Lenche Dima the land use changes were minimal, the initial increase in cropland (Figure 4b) was likely the result of the regime change, and the continuous decline in area after 1985 was due in part to soil erosion (Gizaw et al., Reference Gizaw, Mekonnen and Desta1999).
The increase in cropland in Kuhar Michael can be explained as follows. Historically, in the feudal system most of the Fogera plain, which includes the lower part of Kuhar Michael, served as a grazing land and as a place for maintaining animals for long periods. The wetland area in the 1973 Kuhar Michael image was used as both grazing areas and homes for livestock. Subsequently, following the Derg's efforts to improve the agricultural sector, through the establishment of co-operatives, and the cultivation of cash crops in the marshy plains, these areas were converted into cultivated lands. Following the introduction of rice around 1995 (Descheemaeker, Reference Descheemaeker2008), rice cultivation has grown to be an attractive business.
Other studies corroborate our findings for Kuhar Michael. Yitaferu (Reference Yitaferu2007) showed that cropland increased and grassland decreased in the Lake Tana basin, but not as dramatically as in the Kuhar Michael site. The increase in cropland was also confirmed by the respondents who mentioned that the land conversion was caused by the large numbers of youths looking for land because there were no employment opportunities outside agriculture. Triggered by the recent shortage of land, Kuhar Michael Church is renting out about 8 ha land to landless youngsters.
According to the respondents, the animal feed shortage in Kuhar Michael due the decreasing area in grassland has been made up by using crop byproducts including millet and rice straw, that are mainly fed between January to July when other food resources are scarce. Following crop harvest from October to January, animals graze freely on the non-irrigated land.
Land holding size
The socio-economic survey found that during the past 30 years the size of total land holdings per household in Kuhar Michael remained around 1.5 ha (Table 1). There was a slight decline for irrigated land from 0.45 ha to 0.37 ha and from 0.79 ha to 0.63 ha for non-irrigated lands. Some of the non-irrigated land has been converted to eucalyptus (Table 1) to provide wood for the rapidly developing nearby city of Bahir Dar.
Despite a large decrease in acreage per household from almost 3 ha to just over 2 ha, the land holdings in Lenche Dima both now and 30 years ago are larger than in Kuhar Michael, most likely because the minimum land needed for feeding a family in a drought-prone area is larger than where the rainfall is more reliable for producing a crop each year (Table 1). The average size of cultivated land decreased from 2.2 ha to 1.8 ha (Table 1). As the result of a medium-scale irrigation scheme established in 1991 by CoSAERAR (Commission for Sustainable Agriculture and Environment Rehabilitation for Amhara Region), irrigated land size has increased from 0.22 ha to 0.49 ha (Bekele, Reference Bekele2008). However, discussions with district officials revealed that farmers have not yet fully exploited the potential of the irrigation scheme.
Land holding sizes are affected by gully erosion which is most severe in Lenche Dima, where it has taken 0.02 ha per household out of production (Table 1), representing approximately 3% of rainfed cultivated land. Although unsustainable and improper land use and land cover changes are commonly blamed for land degradation and gully formation (Bossio et al., Reference Bossio, Critchley, Geheb, van Lynden, Mati and Molden2007), it is much more likely that a rise in groundwater due to land use changes caused the 10–20 m wide gully in the flatter part of the landscape (Tebebu et al., Reference Tebebu, Abiy, Zegeye, Dahlke, Tilahun, Collick, Easton, Kidnau, Semu Moges, Dadgari and Steenhuis2010).
Livestock
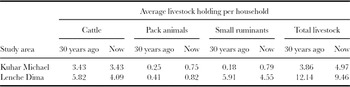
Livestock play a critical role in supporting communities involved in the mixed crop-livestock production system through a range of products and services (Descheemaeker et al., Reference Descheemaeker, Amede and Haileslassie2010a). Respondents were asked about number of cattle, small ruminants and pack animals over the 30 year period (Table 4, Figure 5).
Changes over time in number of animals of different livestock types in the two research sites.

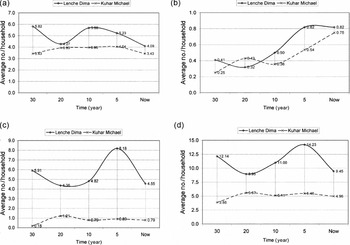
Trends in average household level holding in Kuhar Michael (KM) and Lenche Dima (LD) (a) cattle, (b) pack animals, (c), small ruminants and (d) total livestock.

Since livestock serve as bank reserve offering an alternative income source in the face of uncertain crop production, in drought-prone Lenche Dima the total number of animals per household was, as expected, almost twice that in Kuhar Michael. The main difference between the two sites is that over the study period there were on average nearly six small ruminants (mainly goats and some sheep) per household in Lenche Dima compared to fewer than one in Kuhar Michael (Table 4 and Figure 5c). There were eight small ruminants per household five years ago in Lenche Dima, but this level decreased because almost half of the farmers sold all goats following the closure of hillsides. This is a disadvantage of the exclosures since, according to CEDEP (Desta et al., Reference Desta, Kassie, Benin and Pender2000) sale of goats accounts for about 40% of cash income from livestock even though it represents only 10% of farm capital invested in livestock. Some of the loss of income due to exclosures is made up by a grass cut-and-carry system.
In both study sites, the number of cattle remained nearly constant over the 30-year period at circa five cattle per household (Table 4 and Figure 5a). Since the grazing land has declined over the same period (Figure 4), similar to the rest of the country, crop residues and hay from exclosures are being used as feed (Amede et al., Reference Amede, Mengistu and Roothaert2005; Descheemaeker et al., Reference Descheemaeker, Mapedza, Amede and Ayalneh2010b).
Pack animals increased sharply during the past 30 years in both study areas (Figure 5b) because of a growing need for transportation during distribution of food aid, crop harvest and for market days. Camels can withstand the water and feed shortages that accompany droughts, are able to carry heavy loads and enable owners to offer rental service.
DISCUSSION
Remote sensing analysis confirmed by the interviews showed an increase in cultivated cropland at the expense of both grass and bare land in Kuhar Michael (Figure 4a) while a clear trend in land use could not be discerned from the images for Lenche Dima (Figure 4b). Personal interviews also showed that the use of inorganic fertilizers in Kuhar Michael is now common while in Lenche Dima traditional organic fertilizers are still being applied. Furthermore, household land holdings have declined especially in Lenche Dima (Table 1). With access to irrigation water in water-sufficient Kuhar Michael, more and more of the land (including the grassland) is used for new crops like rice, onion and tomato, which has, in turn, contributed significantly towards improved household incomes. However, in Lenche Dima, it has not been possible to make the change to growing cash crops because the return on the investment is too risky when rainfall is unreliable (Gizaw et al., Reference Gizaw, Mekonnen and Desta1999) leading to limited production potential.
The socio-economic survey showed that the land holdings and livestock numbers for each household were greater in the water-short Lenche Dima than in Kuhar Michael (Table 1), most likely as a risk avoidance measure due to the uncertainty of crop production with limited and variable rainfall. The reason for only a slight decrease in land holdings in Kuhar Michael (v. the larger decreases for Lenche Dima) is not known, but it is likely that there is both sufficient alternate offsite employment in Kuhar Michael (as a consequence of the extra income earned with cash crops) for family members who would otherwise be inheriting and subdividing the land, and that smaller farm sizes would not be economical.
CONCLUSIONS
Temporal land use and land cover patterns and socio-economic factors since 1972 for the drought-prone moisture-deficient Lenche Dima site near Woldya and for the sub-humid moisture sufficient Kuhar Michael site near Bahir Dar showed markedly different trends. In Lenche Dima little progress was made since 1972: although land use patterns showed little change, the size of land holdings per household and number of large ruminants decreased significantly. If people are less well off today than 35 years ago it is because the same (or even a diminishing) resource base has to be shared by more people. In contrast, the land use in Kuhar Michael has changed greatly, with grassland converted to agricultural land that could be triple-cropped with the aid of irrigation and inorganic fertilizers. The size of land holdings in Kuhar Michael remained nearly the same because alternative employment was available.
This study confirms that the availability of sufficient water is a key ingredient for agriculture to make the transition from subsistence farming to commercial farming. Although other factors such as market access, extension and commercial fertilizers are important, it cannot be accomplished if the water is not available.
Acknowledgments
Financial and logistic support to conduct this study was provided from the International water Management Institute (IWMI) and International Livestock Research Institute (ILRI) under a joint project entitled ‘Crop-livestock water productivity improvement in sub-Saharan Africa’ supported by the Bundesministerium für Wirtschaftliche Zusammenarbeit und Entwicklung (BMZ, Germany). Additional funding was provided by DIF funding to Bahir Dar University and by the generous contribution of anonymous donors to Cornell University.