1. INTRODUCTION
The fundamental and application investigation of stimulated Brillouin scattering (SBS) have received great attention (Omatsu et al., 2012; Zhang et al., Reference Zhang, Zhang, Shi, Shi, Gong and Liu2012; Shi et al., Reference Shi, Tang, Wei, Zhang, Zhang, Shi, Gong, He, Yang and Liu2012; Shin et al., Reference Shin, Park, Kong and Yoon2010; Geng et al., Reference Geng, Hasi, Jin, Lin, He, Fan and Lv2011; Guo et al., 2012), especially in the narrowband optical filter (Wise et al., Reference Wise, Tur and Zadok2011), slow light (Pant et al., Reference Pant, Byrnes, Poulton, Li, Choi, Madden, Davies and Eggleton2012), and distributed optical fiber sensing aspects (Dong et al., Reference Dong, Zhang, Chen and Bao2012). In these applications, the optimization and measurement of Brillouin gain spectrum (BGS) and the low distortion Brillouin amplification of the signal wave are of great importance. Generally, using a single-frequency pump wave gives rise to a Lorentzian- or Gaussian-shaped BGS with the bandwidth of less than 60 MHz in single mode fibers (SMF) (Villafranca et al., Reference Villafranca and Lazari2005). This clearly results in the non-uniform amplification of the probe signal. To realize low distortion ultra-narrow-band optical filter or SBS slow light, some methods of narrowing or broadening the gain bandwidth and flatting top have been presented (Wiatrek et al., Reference Wiatrek, Preubler, Jamshidi and Schneider2012; Zhu et al., Reference Zhu, Dawes, Gauthier, Zhang and Willner2007; Zadok et al., Reference Zadok, Eyal and Tur2007; Herŕaez et al., Reference Herraez, Song and Thevenaz2006; Lu et al., Reference Lu, Dong and Li2007; Ba et al., Reference Ba, Lu and Zhu2011; Dong et al., Reference Dong, Lu, Li and Liu2008; Sakamoto et al., Reference Sakamoto, Yamamoto, Shiraki and Kurashima2008; Stenner et al., Reference Stenner, Neifeld, Zhu, Dawes and Gauthier2005; Minardo et al., Reference Minardo, Bernini and Zeni2006; Tanemura et al., Reference Tanemura, Takushima and Kikuchi2002). Among these techniques, those by modulating a pump source are divided into two types: one is direct current modulating a distributed feedback laser diode with a Gaussian noise source or chirp control technique (Wiatrek et al., Reference Wiatrek, Preubler, Jamshidi and Schneider2012; Zhu et al., Reference Zhu, Dawes, Gauthier, Zhang and Willner2007; Zadok et al., Reference Zadok, Eyal and Tur2007; Herŕaez et al., Reference Herraez, Song and Thevenaz2006); the other is externally applying a phase or intensity modulation to the pump wave (Lu et al., Reference Lu, Dong and Li2007; Ba et al., Reference Ba, Lu and Zhu2011; Dong et al., Reference Dong, Lu, Li and Liu2008; Sakamoto et al., Reference Sakamoto, Yamamoto, Shiraki and Kurashima2008; Stenner et al., Reference Stenner, Neifeld, Zhu, Dawes and Gauthier2005; Minardo et al., Reference Minardo, Bernini and Zeni2006; Tanemura et al., Reference Tanemura, Takushima and Kikuchi2002).
In direct current modulation, the pump is modulated as continuous flat-top spectrum. The gain profile is a convolution between the pump spectrum and the material dependent intrinsic BGS. Hence, only when the pump bandwidth is much larger than the intrinsic gain bandwidth, the effective BGS will follow the shape and bandwidth of the pump, generating a flat-top gain (Zhu et al., Reference Zhu, Dawes, Gauthier, Zhang and Willner2007). Therefore, this method is not suitable to obtain a flat-top BGS with the approximate intrinsic bandwidth.
External modulation involves overlapping multiple discrete gain lines to broaden the gain bandwidth. It has several advantages such as simple structure, flexible bandwidth adjustment, and a lower pump power. Lu et al. (Reference Lu, Dong and Li2007) and Ba et al. (Reference Ba, Lu and Zhu2011) presented the methods to broaden the gain bandwidth based on the multi-frequency phase modulation and multi-frequency intensity modulation, respectively. Moreover, the flat-top gain spectrum can be theoretically obtained using the equal-amplitude spectral lines. However, we find that these methods are suitable only for the number of equal-amplitude spectral lines N more than 20, resulting in a larger bandwidth of over 200MHz. If N is less than 20, the bell-shaped BGS is generated. In this paper, we extend their work to obtain quantitatively the flat-top narrow BGS based on the unequal-amplitude spectral lines. Thus, the bandwidth of the flat-top BGS can be changed from the approximate intrinsic bandwidth (~30 MHz) to the Brillouin frequency (~11 GHz) using a phase modulator (PM) or an intensity modulator (IM) in a standard SMF, and hence the application scope of these techniques are greatly expanded. We achieve experimentally the flat-top gain spectra with the bandwidth of about 40 MHz and 125 MHz using the pump with three and nine spectral lines, respectively. Subsequently, low distortion amplification of the signal pulse and spectrum is investigated experimentally.
2. THEORY
We assume a monochromatic pump beam, in the time domain it can be written as
 $$E\lpar t\rpar =\cos \lpar 2{\rm \pi} v_{\rm p} t + {\rm \varphi} _{\rm p} \rpar \comma \;$$
where v p and φ p are the frequency and phase of the pump beam, respectively. Using a multi-frequency signal
 $$m\left(t \right)=\sum\nolimits_{k=0}^{+ \infty } {{\rm \gamma} _k } \sin \left({2{\rm \pi} kv_{\rm m} t + {\rm \varphi} _k } \right)\comma \;$$
to modulate the pump phase, the modulated field E m is described by Dong et al. (Reference Dong, Lu, Li and Liu2008)
 $$E_{\rm m} \left(t \right)=\cos \left[{2{\rm \pi} v_{\rm p} t + \sum\nolimits_{k=1}^{+ \infty } {{\rm \gamma} _k } \sin \left({2{\rm \pi} kv_{\rm m} t + {\rm \varphi} _k } \right)} \right]\comma \;$$
where γk=V k/V π·π is the modulation index; V k and V π are the voltage amplitude of the kth harmonic wave and the half-wave voltage of PM, respectively; v m is the fundamental frequency of modulation signal; φk is the initial phase of the kth harmonic wave. Single-frequency modulation corresponds to the case of k = 1, and assuming φ1 is zero. Meanwhile, for simplicity, the direct current component in the modulation signal is also neglected.
A pump wave with multi-line spectra was obtained after multi-frequency phase modulation. The frequency separation between adjacent spectral lines is required to be equal to the modulation frequency (Dong et al., Reference Dong, Lu, Li and Liu2008). Thus, the effective BGS is given by overlapping the gain spectra induced by every pump spectral line. Therefore, the total gain g(v) can be expressed as
 $$g\lpar v\rpar =g_0 \displaystyle{{{{\lpar {\rm \gamma} } / {2\rpar }}^{\rm 2} } \over {v^{\rm 2} + {{\lpar {\rm \gamma} } / {2\rpar }}^{\rm 2} }} + \sum\nolimits_{n={\rm 1}}^q {g_n \left[{\displaystyle{{{{\lpar {\rm \gamma} } / {2\rpar }}^{\rm 2} } \over {\left({v - n{\rm \delta} } \right)^{\rm 2} + {{\lpar {\rm \gamma} } / {2\rpar }}^{\rm 2} }} + \displaystyle{{{{\lpar {\rm \gamma} } / {2\rpar }}^{\rm 2} } \over {\left({v + n{\rm \delta} } \right)^{\rm 2} + {{\lpar {\rm \gamma} } / {2\rpar }}^{\rm 2} }}} \right]}\comma \;$$
where g 0 and g n are the line-center amplitudes of gain profiles generated by the carrier wave and nth-order sidebands, respectively; γ is the BGS bandwidth (FWHM) for each line; δ is the frequency separation between adjacent spectral lines; q is the maximum order of sidebands; v is the detuning from the line center.
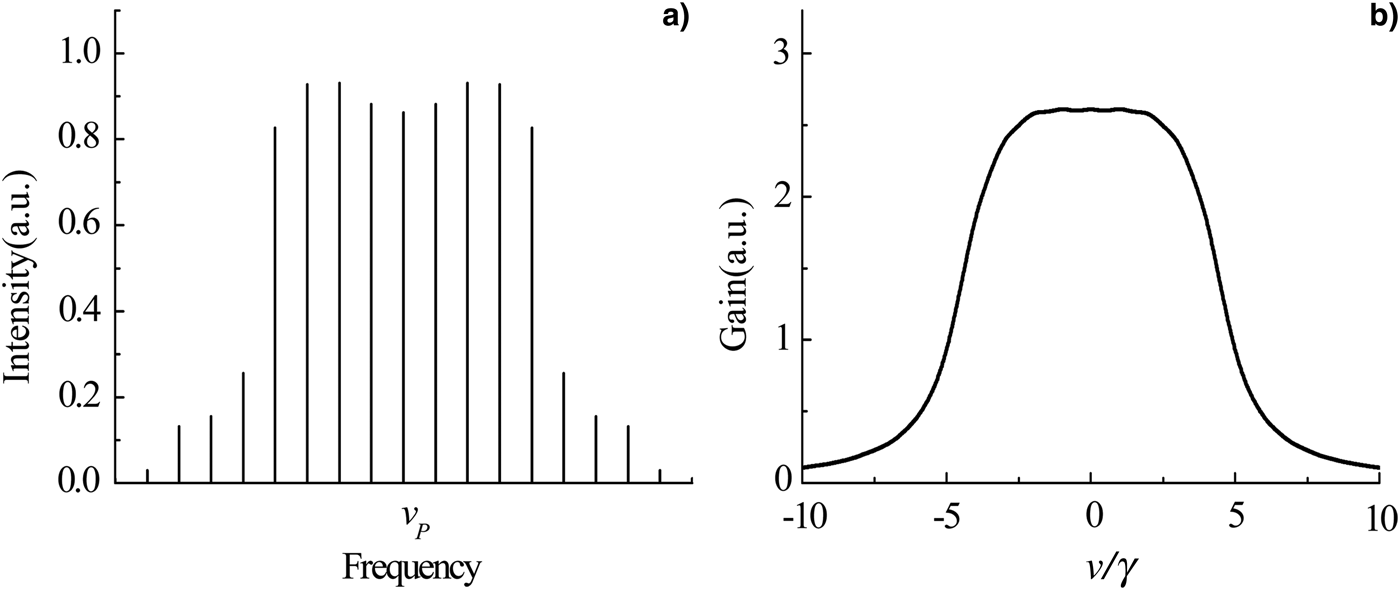
Based on Eqs. (1)–(4), we numerically study the conditions of obtaining flat-top BGS for the single-frequency and multi-frequency modulations. In the case of single-frequency modulation, three main spectral lines can be obtained, i.e., the carrier wave and two first-order sidebands, as shown in Figure 1a. Moreover, the ratio t of the sideband intensity I side to the carrier wave intensity I cen is changed with the modulation index γ1. For δ/γ = 1, Figure 1b depicts the BGS for t = 1, 1.5, 1.8, 2, and 3. It can be seen that when t = 1.8, corresponding to γ1 = 1.647, the flat-top BGS is achieved; while for t = 1 (γ1 = 1.435), the bell-shaped BGS is obtained. For t > 2, the center sag appears on the BGS top. In the SMF, the BGS bandwidth for a quasi-monochromatic pump wave is usually in the range of 10–60 MHz, depending on pump power, strain, temperature and possible dopants (Wiatrek et al., Reference Wiatrek, Preubler, Jamshidi and Schneider2012). We assume the BGS bandwidth corresponding to single spectral line γ = 10 MHz. Then, the minimum bandwidth of the flat-top BGS is about 30 MHz.
(Color online) Pump spectrum (a) and the BGS for different t at δ/γ = 1 (b) under the condition of single-frequency phase modulation.

The multi-frequency modulation signal comprises the fundamental frequency and the kth harmonic wave. We take the third harmonic wave as an example. When γ1 = 1.386, γ3 = 1.432, and φ3 = 0.506π, seven equal-amplitude spectral lines is obtained, and the corresponding BGS still presents the bell-shaped profile (Lu et al., Reference Lu, Dong and Li2007; Ba et al., Reference Ba, Lu and Zhu2011). For γ1 = 1.390, γ3 = 1.460, and φ3 = 0.506π, the unequal-amplitude spectral lines shown in Figure 2a can be obtained. Moreover, δ/γ is adjusted as 1, and then achieving flat-top BGS, as shown in Figure 2b. Therefore, we can choose the suitable intensity ratio and frequency separation between spectral lines as well as the number of spectral lines by calculating the modulation parameters to realize the flat-top gain with different bandwidths under the condition of multi-frequency phase modulation.
Unequal-amplitude spectral lines (a) and the corresponding flat-top BGS (b).
3. EXPERIMENTAL RESULTS AND DISCUSSIONS
The experimental setup measuring the BGS based on the pump and probe technique is depicted in Figure 3. The light of a 40 kHz line-width DFB laser at 1550 nm is first split into two by a coupler. One is modulated by a PM, then amplified by an Erbium doped fiber amplifier 1 (EDFA1) and routed through a circulator (OC) to pump a 1 km SMF; the other is injected into an IM1 driven by a microwave signal, generating two modulation sidebands, in which the first lower sideband is used as the probe wave. A fiber Bragg grating filter (bandwidth 0.03 nm) is placed to eliminate the first upper sideband and any residual light from the pump. The BGS is determined by scanning the microwave generator around the Brillouin shift ν B. One percent of the pump wave is extracted with a 1:99 coupler, and then detected by a confocal scanning F-P optical spectrum analyzer (OSA) with a free spectrum range of 2 GHz.
(Color online) Experimental setup. IM, intensity modulator; PM, phase modulator; PC, polarization controller; EDFA, erbium doped fiber amplifier; FBG, Fiber Bragg grating; OC, optical circulator; OI, optical isolator; PD, PIN detector. In the dashed box is a probe signal pulse generator; in the dotted box is a heterodyne detection system.
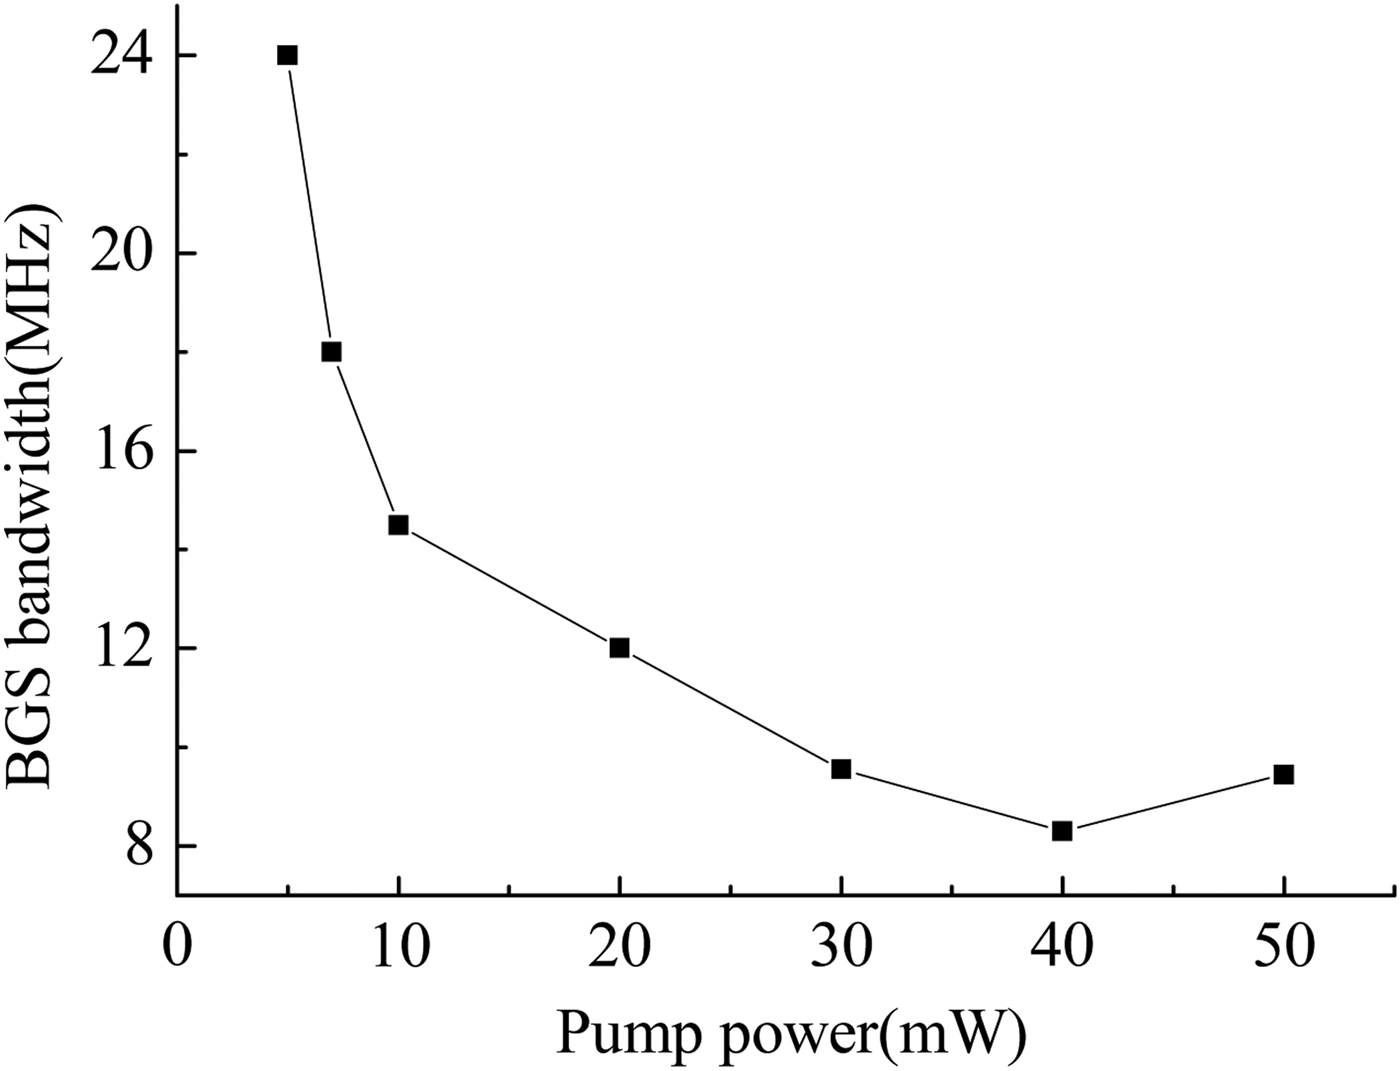
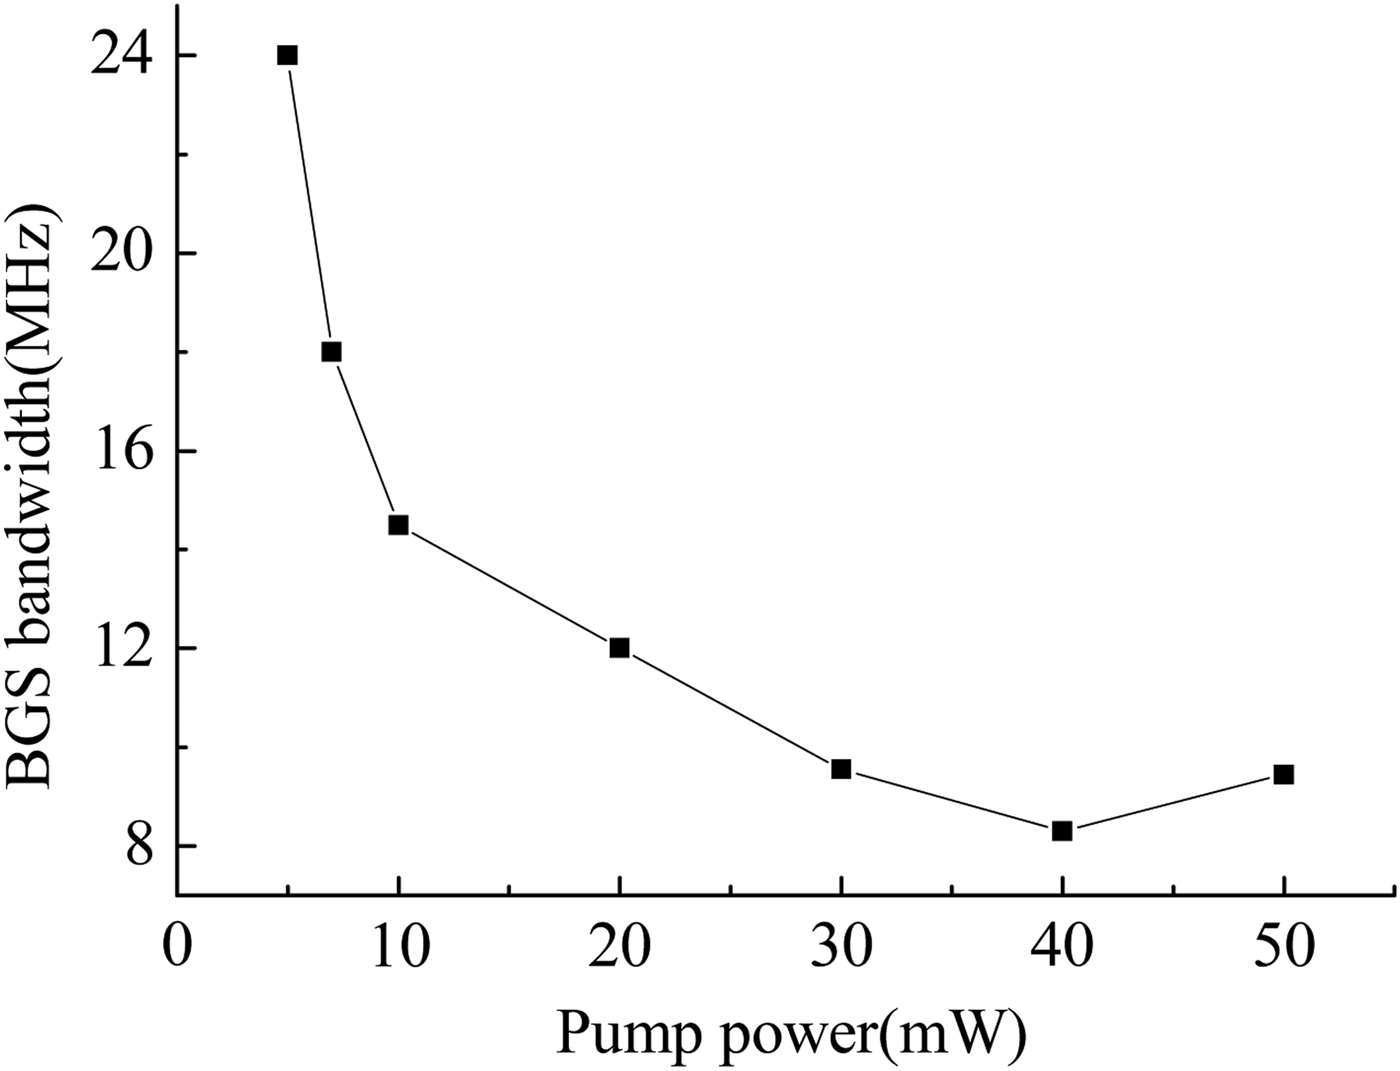
We first measured the BGS with the pump modulation signal off. The probe input power was set as 8 µW. Figure 4 shows that the dependence of the BGS bandwidth on the pump power. It can be seen that the BGS narrows with increasing the pump power, and then broadens when gain saturation is present. Thus, the BGS bandwidth changes from 24 MHz to 8 MHz for different pump powers under the condition of single pump spectral line.
BGS bandwidth versus the pump power with no pump modulation.
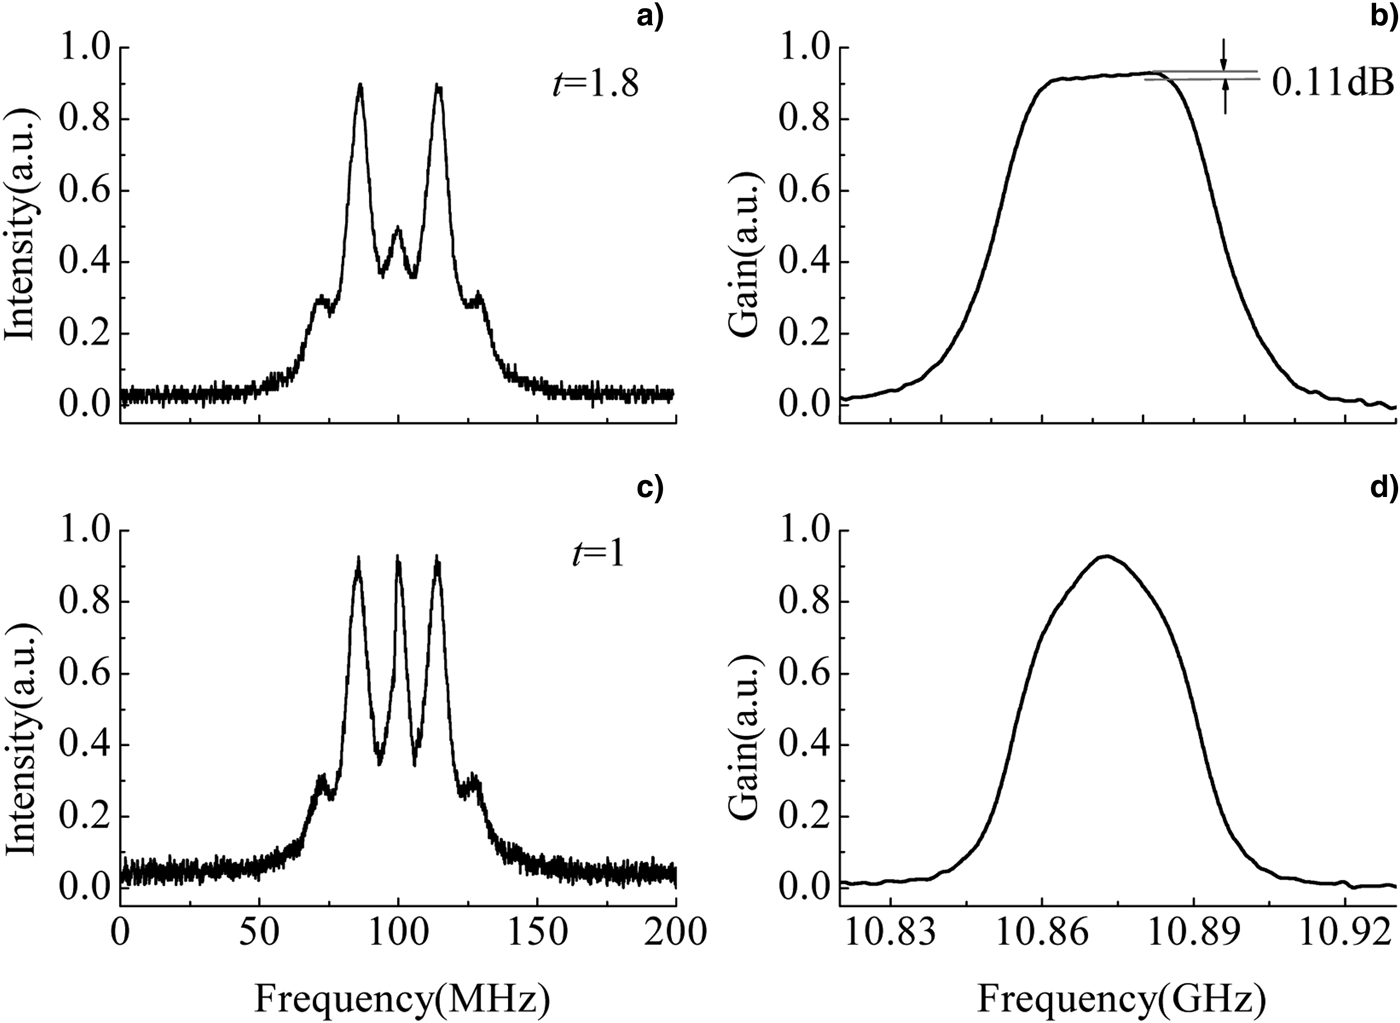
Different multi-line pump spectra can be obtained by changing the amplitude and waveform of the modulation signal applied in the PM. Figure 5 shows that the pump spectra and the corresponding BGS for a single-frequency modulation signal. In experiment, the pump power was set as 45 mW, and v m was controlled to be 13.8 MHz, which is about the BGS bandwidth for single pump line without phase modulation at the pump power of about 15 mW (see Fig. 4). When the intensity of the first sidebands is adjusted to be 1.8 times that of the carrier wave in the pump spectrum (Fig. 5a), the flat-top BGS with the fluctuation of 0.11 dB and a bandwidth of about 40 MHz was achieved, as shown in Figure 5b. For the case of three equal-amplitude spectral lines (Fig. 5c), however, the BGS similar to a bell curve was obtained, as shown in Figure 5d.
Spectrum of unequal-amplitude pump lines (t = 1.8) of single-frequency phase modulation (a), and the corresponding BGS (b); spectrum of equal-amplitude pump lines (t = 1) of single-frequency phase modulation (c), and the corresponding BGS (d). t denotes the ratio of the intensity of the first sidebands to the carrier wave.
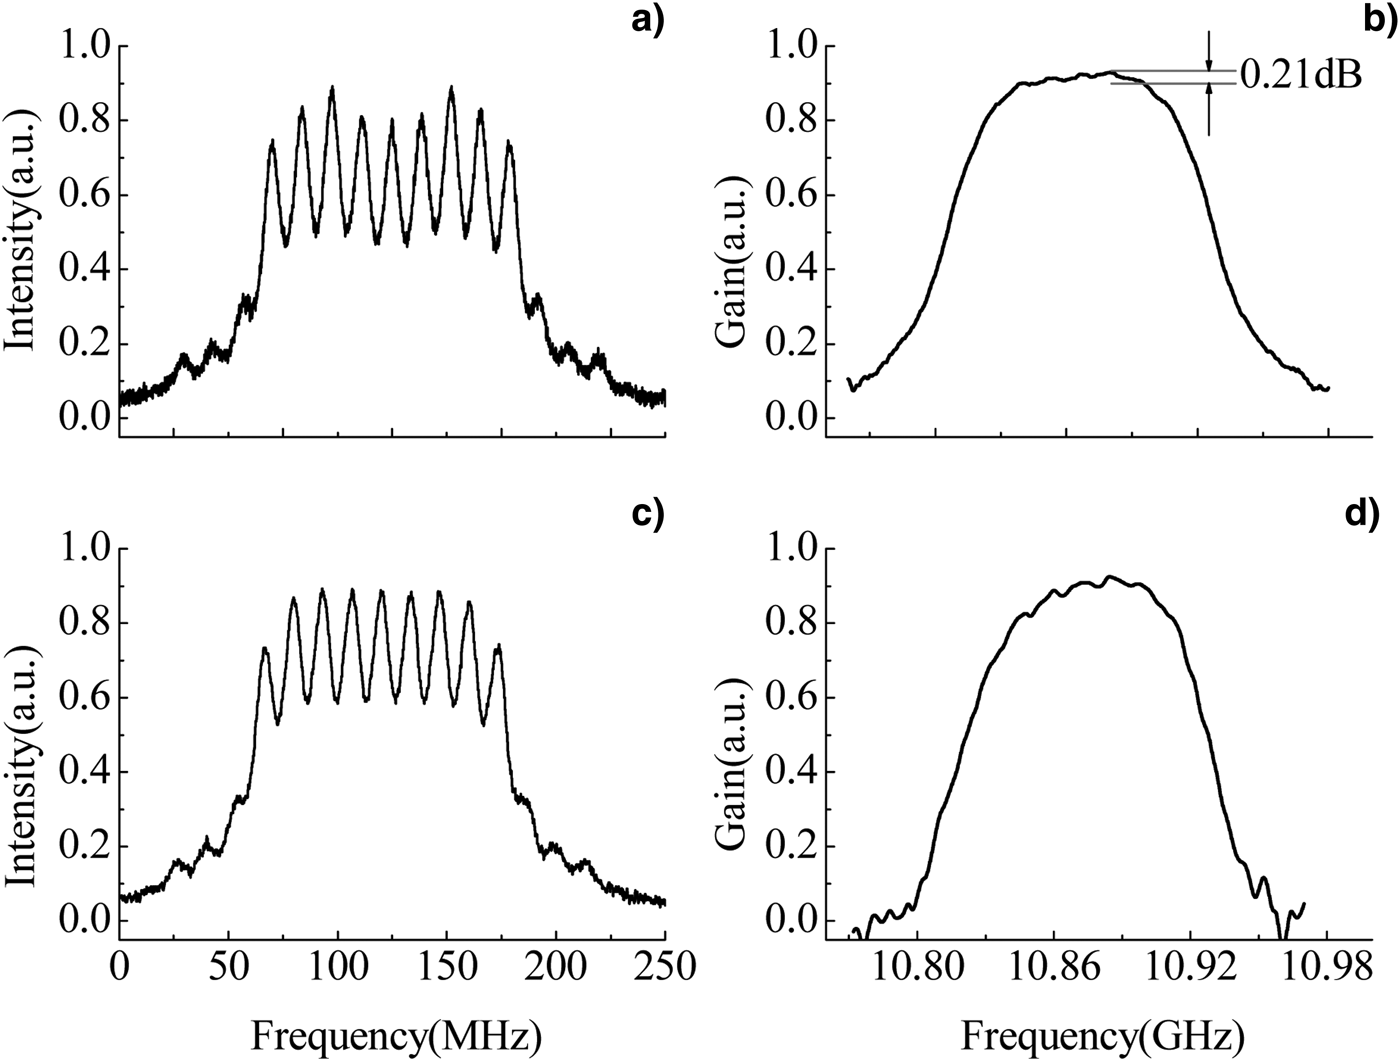
Figure 6 shows the experimental results of multi-frequency phase modulation. Here the modulation signal includes the fundamental frequency and the third harmonic wave with the above calculated modulation indices and initial phases (Section 2). By using the required modulation signal, we obtained nine unequal-amplitude spectral lines shown in Figure 6a, and seven equal-amplitude spectral lines shown in Figure 6c. Their corresponding BGS are depicted in Figures 6(b) and 6(d), respectively. In experiment, the pump power was 85 mW, and v m was set as 14 MHz. It can be seen that a flat-top gain with the fluctuation of 0.21 dB and a bandwidth of 125 MHz is achieved. It is evident that the experiment results agree very well with simulations. If one wants to realize a wider bandwidth BGS, the modulation signals including more high order harmonics waves are necessary. Moreover, the flat-top BGS with low fluctuation can be obtained by carefully controlling the modulation parameters.
Spectrum of nine unequal-amplitude pump lines of multi-frequency modulation (a), and the corresponding BGS (b); spectrum of seven equal-amplitude pump lines of multi-frequency modulation (c), and the corresponding BGS (d).
Based on the pump phase modulation mentioned above, we preformed low distortion Brillouin amplification experiment from two aspects of time domain and frequency domain. The experimental setup is also sketched in Figure 3. The Stokes shifted probe signal can be obtained using an IM1 driven by a sinusoidal wave with the Brillouin frequency and a narrowband FBG, then amplified and changed into sinc-shaped 20 ns (FWHM) pulse by the elements in the dashed box consisting of an EDFA2, an IM2 and a pulse generator. In low distortion experiment, these components are inserted into the position A.
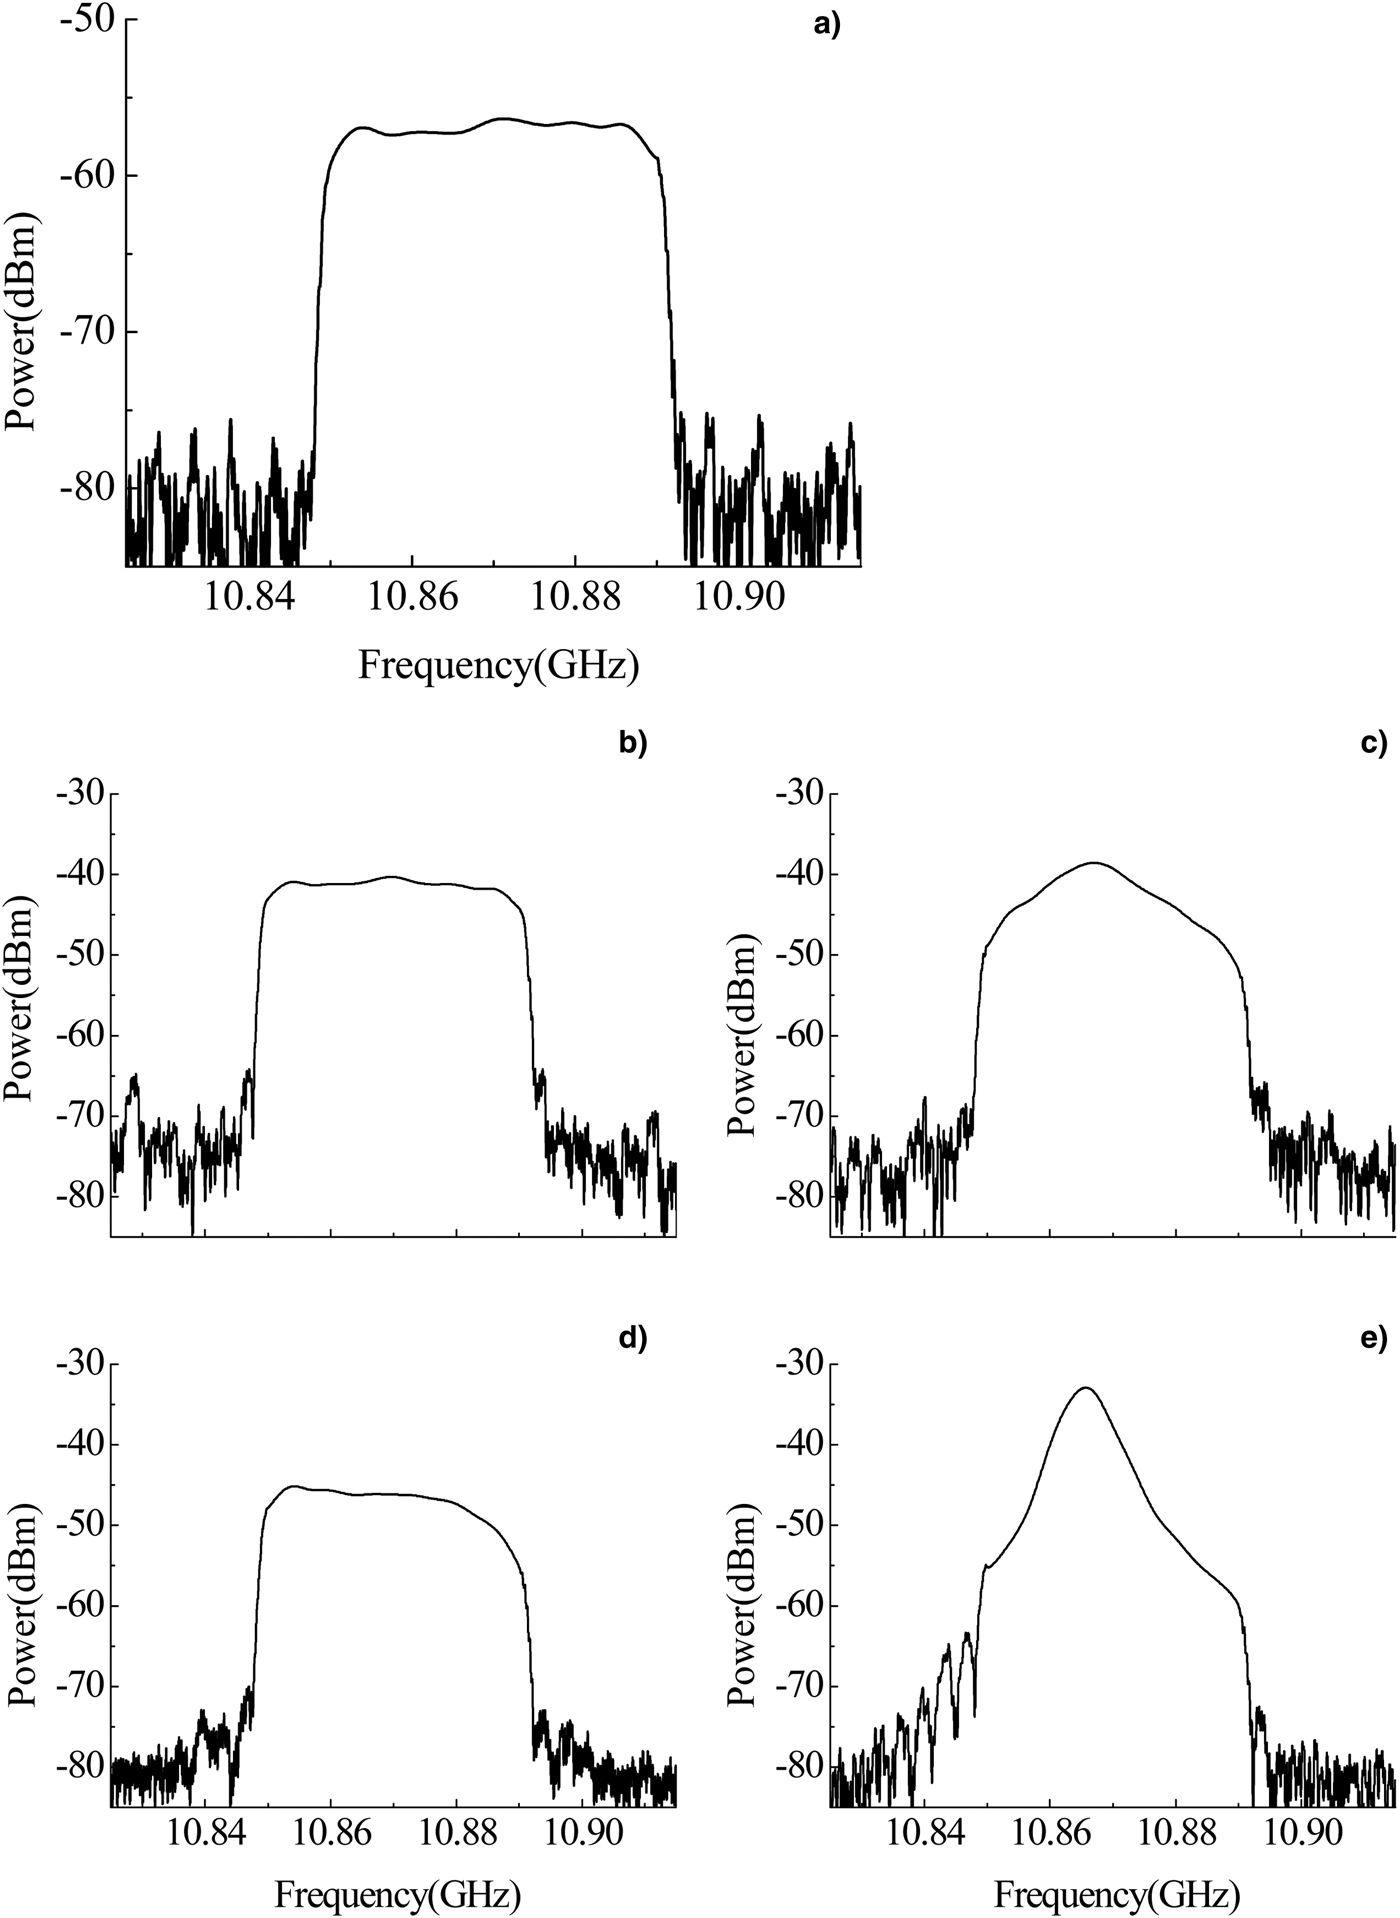
Figure 7 shows that the comparison of the probe input and its amplified output pulses at the different pump conditions. We control the pump powers to obtain the Brillouin gain of 20 dB in these cases. It should be noted that the shape and width of the probe output pulses are almost consistent with those of the input pulse for both nine unequal-amplitude (Figs. 6a, and 6b) and seven equal-amplitude spectral lines (Figs. 6c, and 6d). The probe pulse is slightly broadened and distorted under the condition of three unequal-amplitude spectral lines (Figs. 5a and 5b). More serious broadening and distortion occur when the pump wave is not modulated.
(Color online) Comparison of the probe input and its amplified output pulses at the different pump conditions.
We also measured the probe input and output spectra using a heterodyne detection technique. In the experimental setup (see Fig. 3), the output end (position B) of the probe pulse was connected with one of the input ends (end point C from the dotted box) of the heterodyne detection system comprising a 50:50 coupler, a high speed PIN detector (PD, Newport 1454) and an electrical spectrum analyzer (ESA, Agilent N9010A). A fraction of DFB laser extracted using a 5:95 coupler was launched into another input end of the heterodyne detection system to provide the local oscillator.
Figure 8 shows the spectrum profile of the probe input and output pulses aforementioned. It can be seen that the probe input pulse has a rectangle spectrum with a bandwidth of 40 MHz (see Fig. 8a). When the pump beam is modulated as nine unequal-amplitude spectral lines to generate the flat BGS with the 42 MHz wide top shown in Figure 6b, the probe signal spectrum is amplified with no distortion, as shown in Figure 8b. However, the noise outside the signal frequency region is also amplified due to the wider gain bandwidth (FWHM, 125 MHz). Figure 8c corresponds to the probe output spectrum for seven equal-amplitude spectral lines. We see that the top of the amplified output spectrum presents clear distortion due to the bell-shaped BGS shown in Figure 6d, even if the difference between the output and input pulse waveforms is difficult to be recognized (see Fig. 7). Figure 8d shows the probe output spectrum for three unequal-amplitude spectral lines. At this time, the BGS bandwidth is the same as the frequency span of the probe signal. Nevertheless, the output spectrum has slight distortion in profile because of narrow flat-top width (20 MHz). If there is no pump modulation, the Lorenzian-shaped BGS will result in serious distortion in output spectrum, as shown in Figure 8e. In addition, to suppress the noise amplification outside the probe signal spectrum, we can achieve a flat-top steep-cutoff BGS via combining this phase modulation with the polarization pulling or inhomogeneous Brillouin gain saturation of the amplified signal wave (Wise et al., Reference Wise, Tur and Zadok2011; Wiatrek et al., Reference Wiatrek, Preubler, Jamshidi and Schneider2012).
Spectrum profiles of the probe input pulse (a) and amplified output pulses at the different pump conditions: (b) nine unequal-amplitude spectral lines; (c) seven equal-amplitude spectral lines; (d) three unequal-amplitude spectral lines; (e) no pump modulation.
4. CONCLUSIONS
We theoretically analyze and experimentally verify the conditions for achieving flat-top narrowband gain spectrum based on pump phase modulation. On this basis, low distortion Brillouin amplification of a probe signal pulse and its spectrum is experimentally studied. Results show that the flat-top narrowband BGS with low fluctuation can be achieved by synthetically controlling the modulation index and the modulation frequency. The flat-top BGS with the bandwidth of about 40 MHz and the top fluctuation of 0.11 dB is experimentally obtained for the single-frequency phase modulation. For the number of spectral lines by multi-frequency modulation less than 20, the flat-top gain spectrum can be achieved by adjusting the intensity of each order sidebands using suitable modulation signals. Low distortion pulse and spectrum amplification can be simultaneously realized only when the flat-top width of the BGS is equal or slightly greater than the probe signal bandwidth.
ACKNOWLEDGEMENT
This work is supported by the National Natural Science Foundation of China (Grant No. 61078004), the China Postdoctoral Science Foundation (Grant Nos. 20100481017, 2012T50372) and Technology of Education the Bureau of Heilongjiang Province, China (Grant No. 11521048).