Introduction
Metal corrosion causes economic losses and waste of resources in the modern metallic industry [Reference Thompson, Yunovich and Dunmire1]. Reports showed that the global economic losses and metallic waste caused by metal corrosion were about 900 millions/year and 100 million tons/year, respectively. To solve this problem, many materials including organic [Reference Lee, Kato and Usuki2], inorganic [Reference Nwaogu, Blawert, Scharnagl, Dietzel and Kainer3, Reference Usuki, Hasegawa, Kato and Kobayashi4] and polymeric coatings [Reference Mahato and Cho5, Reference Chang, Huang, Peng, Yeh, Lu, Hung, Weng, Yang and Yeh6, Reference Yu, Lin, Lin, Chan and Huang7, Reference Krishnamoorthy, Jeyasubramanian, Premanathan, Subbiah, Shin and Sang8] were investigated. Lightweight graphene/GO with chemical stability, antibacterial activity, outstanding barrier property, and excellent thermal and electrical properties was reported to be a promising material on the protection of metal from corrosive environment [Reference Chen, Qiu, Cui, Qin, Yan, Zhao, Wang and Xue9, Reference Ci, Cai, Wen and Li10, Reference Mogera, Kurra, Radhakrishnan, Narayana and Kulkarni11, Reference He, Qiu, Li, Zhao and Xue12].
Graphene grown by the chemical vapor deposition (CVD) method has been applied in the metal substrates earlier [Reference Dong, Liu, Zhou, Dong, Liu and Zhou13, Reference Mišković-Stanković, Jevremović, Jung and Rhee14]. The CVD method could obtain a large area of graphene film directly on the metal surface which was used as a protective coating. Chen et al. firstly studied the oxidation resistance of the graphene films grown on the surface of Cu and Cu/Ni alloy by the CVD method [Reference Chen, Brown, Levendorf, Cai, Ju, Edgeworth, Li, Magnuson, Velamakanni and Piner15]. Results showed that the surface of metal substrate was passivated due to the impermeability and chemical resistance of graphene which could prevent diffusion of ions and keep stability in oxidizing environment. However, the corrosion resistance of the graphene would be decreased due to the oxidation reaction occurring at defects and grain boundaries of graphene films [Reference Kyhl, Nielsen, Čabo, Cassidy, Miwa and Hornekær16]. Similarly, Singh Raman et al. found that the anodic and cathodic current densities of the Cu coated with graphene were nearly 1–2 orders of magnitude smaller than the pure Cu and the graphene could obviously improve the corrosion resistance of uncoated Cu nearly 100 times [Reference Raman, Banerjee, Lobo, Gullapalli, Sumandasa, Kumar, Choudhary, Tkacz, Ajayan and Majumder17]. They also further proved that the impermeability of graphene could significantly improve the corrosion resistance of metals. Nonetheless, the growth temperatures of the CVD method were more than 650 °C and the high temperatures were problematic when dealing with alloys and steels. Prasai et al. found that the graphene films could be applied on any metal surface by the mechanical transfer method [Reference Prasai, Tuberquia, Harl, Jennings, Rogers and Bolotin18]. Results indicated that the corrosion rate of copper and nickel coated with graphene grown via CVD was 7 times and 20 times slower than those without coating, respectively, while the corrosion rate of the nickel surfaces coated with mechanically transferred graphene layers was four times slower than nickel without coating. In addition, graphene films prepared by CVD could provide the metal surface with good corrosion resistance and chemical stability.
Incorporating graphene into polymer matrix would be an economical and workable way to prepare graphene corrosion resistance coating compared with CVD method. Liu et al. incorporated graphene in ecological waterborne epoxy resin coatings as an inhibitor [Reference Liu, Gu, Zhao, Chen and Yu19]. The composites coating displayed outstanding barrier properties against H2O, and electrochemical tests showed that the corrosion rate of epoxy resin incorporated with 0.5 wt% graphene was decreased an order of magnitude lower than epoxy resin without grapheme incorporation. Krishamoorthy et al. developed a multifunctional GO nanopaint with incorporating GO sheets in an alkyd resin (AR) by ball mixing. The GO nanopaint coatings effectively inhibited the bacterial growth on its surface and possessed a corrosion protection efficiency of about 76% in salt water in the linear polarization studies [Reference Krishnamoorthy, Jeyasubramanian, Premanathan, Subbiah, Shin and Sang8]. Singh et al. fabricated a robust graphene-reinforced composite coating by aqueous cathodic electrophoretic deposition which endowed an excellent corrosion resistance [Reference Singh, Nayak, Nanda, Jena, Bhattacharjee and Besra20]. Ramezanzadeh et al. synthesized a nanometric sol–gel-based silane composite film filled with functionalized GO to improve the corrosion resistance performance and cathodic delamination resistance of epoxy coating on the steel substrate [Reference Ramezanzadeh, Niroumandrad, Ahmadi, Mahdavian and Moghadam21, Reference Ramezanzadeh, Ahmadi and Mahdavian22]. They also added an amino-functionalized graphene oxide (FGO) prepared by wet transfer method into the epoxy coating which was applied on mild steel. The FGO could noticeably enhance the corrosion resistance by improving its ionic resistance as well as barrier properties, and 0.1 wt% of FGO nanosheets could well be dispersed in the epoxy coating. Results showed that the polymer/GO coatings revealed stable thermal and chemical properties, synergistic barrier properties, good engineering-desired properties, and low electrical percolation threshold which were helpful for the superior corrosion resistance performances [Reference Zhang, Liu and Choi23, Reference Hayatgheib, Ramezanzadeh, Kardar and Mahdavian24, Reference Tang, Wan, Yan, Pei, Zhao, Li, Wu, Jiang and Lai25, Reference Chang, Hsu, Lu, Lai, Liu, Hsu, Ji, Chuang, Wei and Yeh26, Reference Zhao, Xie and Zhang27].
Reports showed that the inertness, electrochemical properties, and barrier properties of GO had dramatic impacts on the corrosion resistance properties which were closely related to the microstructure and electric properties of GO. Then, how does the multiscale (flake size and oxidation degree) GO affect the metal corrosion resistance properties of polymer/GO composite coatings? In our work, the nontoxic waterborne AR was chosen as the polymer matrix and the effects of the flake size and the oxidation degree of GO in ecological waterborne AR [Reference Krishnamoorthy, Jeyasubramanian, Premanathan, Subbiah, Shin and Sang8] on metal corrosion resistance are investigated in detail. And the microstructure and electrochemical properties are well characterized.
Results and discussion
Characterization of different flake sizes of GO
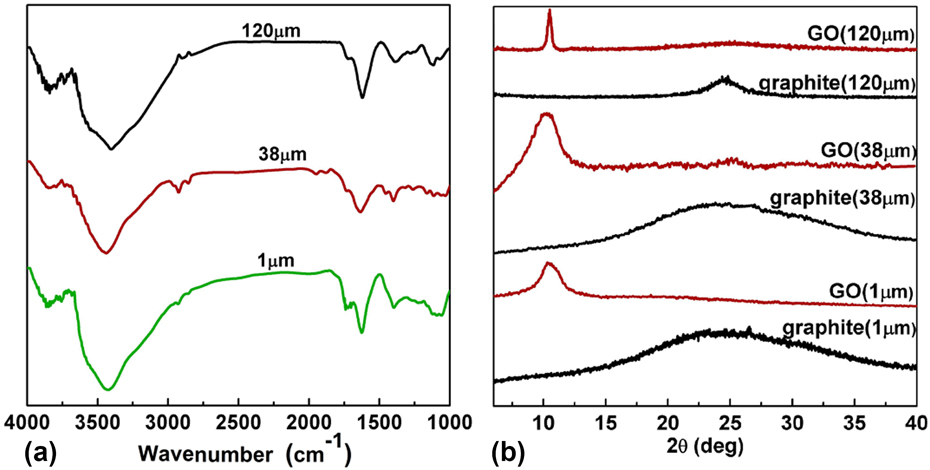
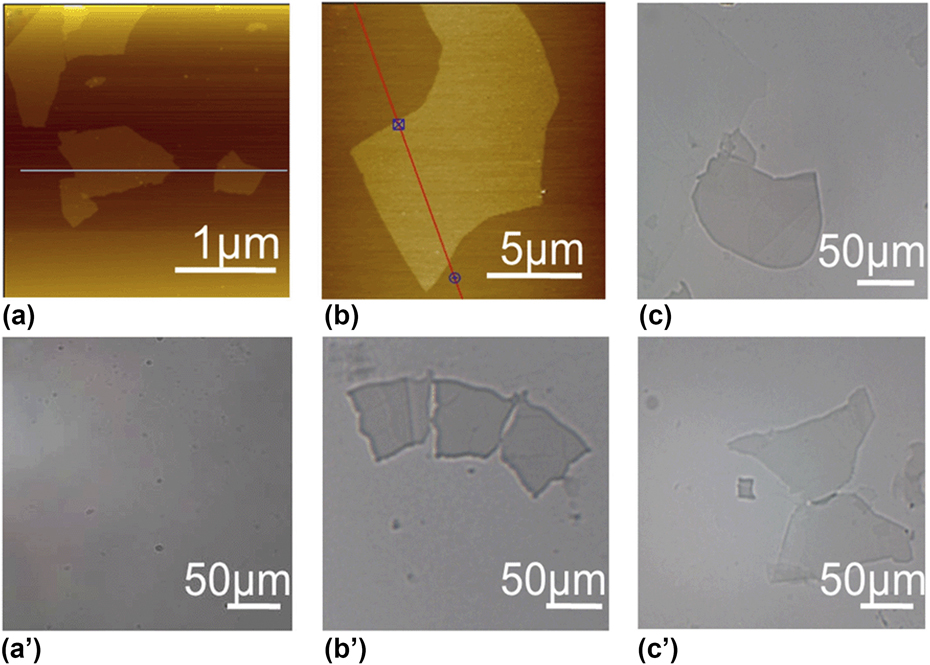
The FTIR spectra of GO (sp 2/sp 3 = 2.61) with different flake sizes are shown in Fig. 1(a). As seen in the three curves, the peak at 1120 cm−1 is attributed to the vibrations of C–O–C, the peak of at 1725 cm−1 is ascribed to the stretching vibration of C=O, and the peak at 3410 cm−1 is related to the stretching vibration of –OH; results indicate that GO with different flake sizes is successfully prepared. The distance between the graphene interlayer and the exfoliation of the graphene sheets in the composites is measured by XRD. Figure 1(b) shows the XRD patterns of graphite and GO. A sharp peak appears at = θ = 26.5° which corresponds to a d-spacing of 0.34 nm in the graphite. The new diffraction peaks appear at = θ = 11.0° which are attributed to the diffraction peaks of GO, while the peak of graphite at = θ = 26.5° disappears after the oxidation, which indicates the functional groups introduced by the modified Hummers method. The d-spacing of GO is increased due to the presence of absorbed water and the oxygen-containing groups [Reference Shen, Hu, Shi, Lu, Qin, Li and Ye29]. The AFM and POM images of GO sheets are shown in Fig. 2. Results reveal that some folded regions at the edges are present in the sheet-like GO. The GO sheets observed by AFM suggest that graphene oxide (GO) sheets are fully exfoliated and the flake size of graphene sheets is about 1 μm [Fig. 2(a)], 38 μm [Fig. 2(b)] and 120 μm [Fig. 2(c)], respectively.
(a) FTIR spectra of GO with different flake sizes and (b) X-ray diffraction spectra of GO and graphite.

Microscopic images of oxide graphene with (a, a′) small flake size, (b, b′) middle flake size, and (c, c′) large flake size, respectively.

Characterization of GO with different oxide degrees
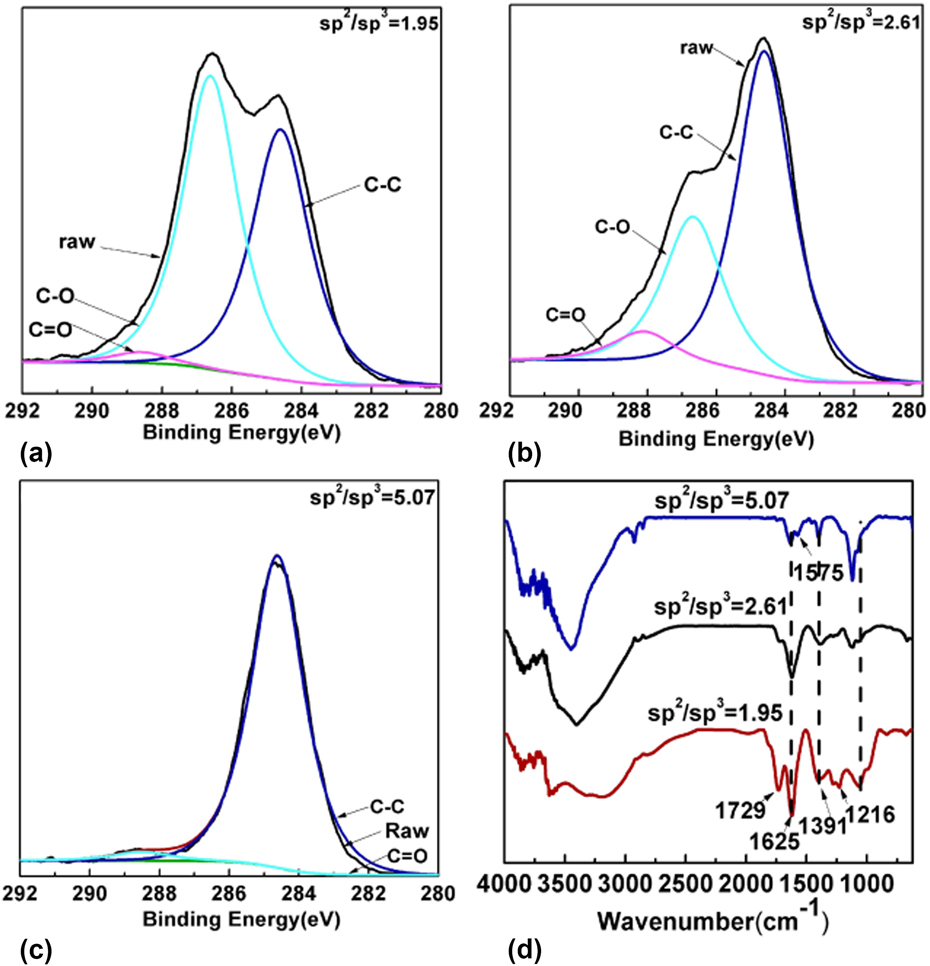
XPS spectra of GO with different oxidation degrees are shown in Figs. 3(a)–3(c). Results show that the C 1s peak of GO could be differentiated into three peaks at the binding energy of 284 eV, 286 eV, and 288 eV, which belong to the C–C, C–O, C=O, respectively [Reference Stankovich, Dikin, Piner, Kohlhaas, Kleinhammes, Jia, Wu, Nguyen and Ruoff30]. The intensities of C–C, C–O, C=O groups are changed at different oxidation levels, the intensity of the C–C peak due to the sp 2 carbon bond decreases, while the intensities of C–O, C=O peaks corresponding to sp 3 carbon bond increase with the increasing oxidation level [Reference Shukla and Saxena31, Reference Liaros, Tucek, Dimos, Bakandritsos, Andrikopoulos, Gournis, Zboril and Couris32]. In our work, the sp 2/sp 3 ratios measured from the XPS spectra are 1.95, 2.61, and 5.07 [shown in Figs. 3(a)–3(c)] with the modification of 25 g KMnO4, 18 g KMnO4, and 2 mL N2H4, respectively. Results suggest that the sp 2/sp 3 ratio increased with the decreasing oxidation level which is in accordance with the previous work [Reference Hontoria-Lucas, López-Peinado, López-González, Rojas-Cervantes and Martín-Aranda33]. The FTIR spectra of GO with different sp 2/sp 3 ratios are shown in Fig. 3(d). The FTIR spectrum of GO sample (sp 2/sp 3 = 1.95) reveals the characteristic peaks of C=O (1729 cm−1), C–O (1051 cm−1), C–O–C (1216 cm−1), and C–OH (1391 cm−1). The peak that appears at 1625 cm−1 is a resonance peak that can be attributed to the C–C stretching and hydroxyl groups in the GO [Reference Venugopal, Krishnamoorthy, Mohan and Kim34]. With further decrease in the oxidation level, the peak intensities of oxygenated functional groups are weakened and a new peak at 1575 cm−1 (sp 2/sp 3 = 5.07) is attributed to the N–H. The sp 2/sp 3 ratio increases with the decreasing oxidation level and is matched well with the XPS results and FTIR results.
(a)–(c) C 1s XPS spectra of GO with different oxidation degree ratios: the amount of KMnO4 of (a) sample is 18 g, the amount of KMnO4 of (b) sample is 25 g, and the (c) sample is reduced by N2H4 (2 mL); (d) histogram of GO with different C:O ratios.

Structure of AR/GO coatings
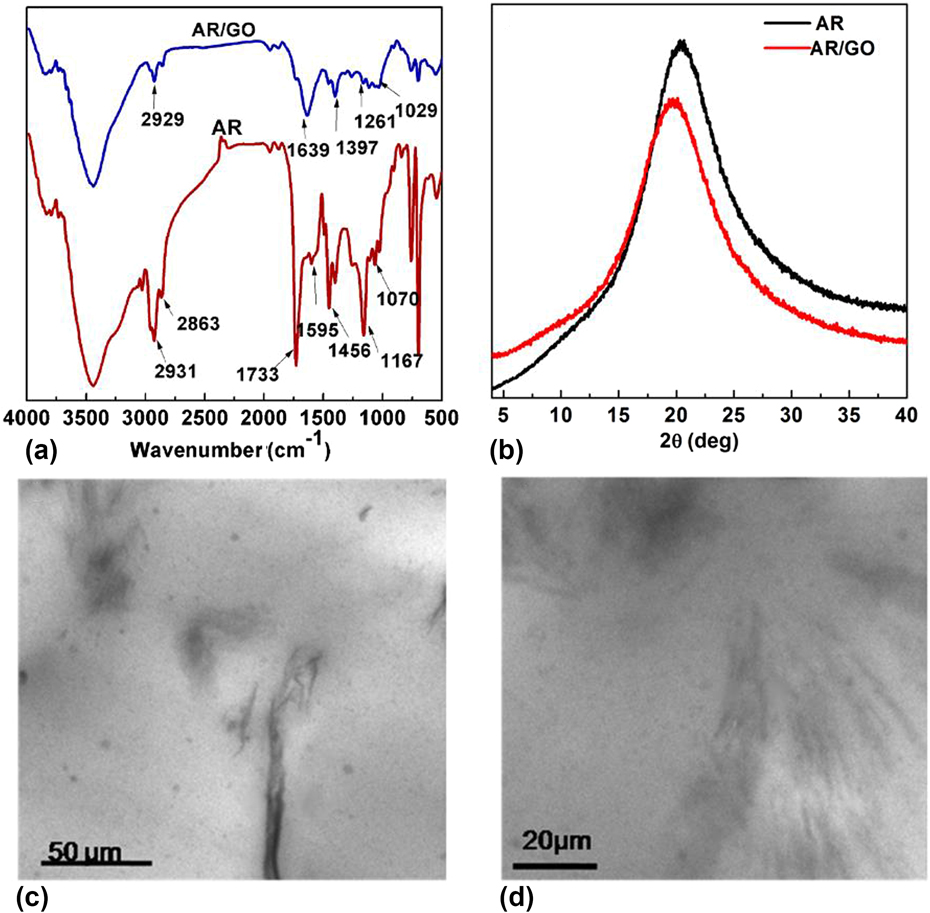
The FT-IR spectra of the AR and AR/GO are shown in Fig. 4(a). The characteristic peaks of AR are at 1058 cm−1 (C–O), 1261 cm−1 (C–O–C), 1733 cm−1 (C=O), 1639 cm−1 (C–C), 2800–3000 cm−1 (C–H vibrations in methyl and methylene groups), respectively. For the AR/GO coatings, the characteristic peaks of C–H group and C=O group in the AR decrease in AR/GO, and the change of carbonyl groups may be attributed to the esterification reaction that occurred between GO and AR or the electrostatic interactions and/or hydrogen bonding between the waterborne AR and the GO sheets.
(a) FTIR, (b) XRD of AR and AR/GO composites, (c) and (d) TEM of AR/GO composites (the flake size of GO was 120 μm).

XRD patterns of AR and AR/GO are shown in Fig. 4(b). In the XRD pattern of AR/GO, the characteristic peak of GO (2θ = 11°) is dispersed and the characteristic peak of AR at (2θ = 20.5°) is weakened, suggesting that the GO dispersed in the AR matrix, which may affect the aggregation structure of AR. TEM is utilized to understand the morphology of the AR/GO (120 μm, 1.5 wt%) composites. Figures 4(c) and 4(d) show that there is no obvious agglomeration in the AR. The hydrophilic graphene with oxygen-containing group could improve the compatibility between GO and resin matrix, and further keep the stable dispersion and exfoliation of GO flake in waterborne AR.
Anticorrosion properties of AR/GO coatings
The anticorrosion properties of AR/GO coatings are studied by corrosion potential (E corr), corrosion current (I corr), and the protection efficiency (PE). It is well known that a higher voltage along with a lower current means a better corrosion resistance of coatings. The Tafel analysis plot is composed of log I versus log E constructing for a potential range of −60 mV to +60 mV versus OCP at the scan rate of 0.002 mV/s.
The protection efficiency (PE) is calculated by the following formula (1) [Reference Bellezze and Fratesi35]; the higher the PE value, and the better the anticorrosion properties.
 $${\rm{PE}} = {{{I_{{\rm{corr,o}}}} - {I_{{\rm{corr,i}}}}} \over {{I_{{\rm{corr,o}}}}}} \times 100\% \quad ,$$
where I corr,o is the corrosion current density of pure carbon steel (A/cm2) and I corr,i is the corrosion current density of coated sample (A/cm2).
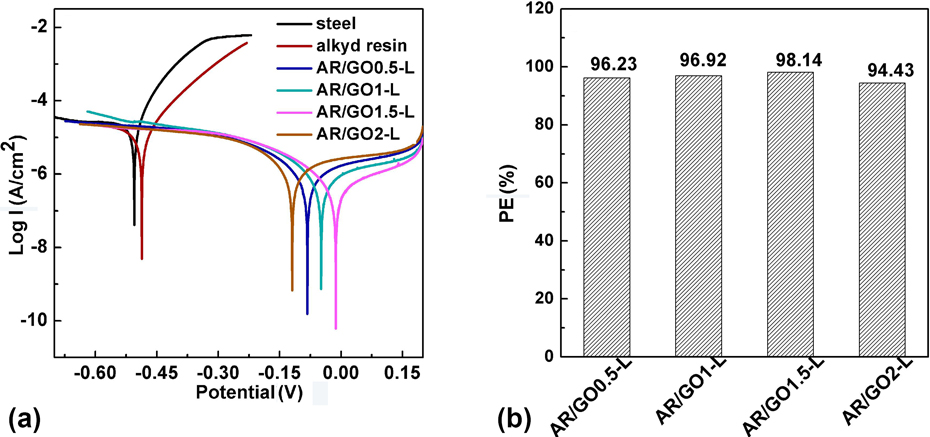
The corrosion resistance of AR/GO-L (120 μm, sp 2/sp 3 = 2.61) with different contents is compared (Fig. 5). The E corr values of steel, AR, AR/GO0.5-L, AR/GO1-L, AR/GO1.5-L, and AR/GO2-L are −539.77 mV, −486.35 mV, −81.15 mV, −40.44 mV, −8.34 mV, and −110.25 mV, respectively. And the I corr values of steel, AR, AR/GO0.5-L, AR/GO1-L, AR/GO1.5-L, and AR/GO2-L are 2.40 × 10⁻⁵ A/cm2, 1.36 × 10⁻⁵ A/cm2, 9.04 × 10⁻⁷ A/cm2, 7.39 × 10⁻⁷ A/cm2, 4.47 × 10⁻⁷ A/cm2, and 1.33 × 10⁻⁶ A/cm2, respectively. Generally, the higher E corr values suggest that the corrosion needs a higher driving force. And the lower current density indicates slower electronic movement speed. As seen in the Tafel curves, waterborne AR could weakly enhance the corrosion resistance ability of steel and the GO-based coatings can effectively improve the corrosion resistance. The corrosion resistance of AR coatings increased with the increase in the GO amount until the amount reached 2%. Results suggest that small amount of GO could not achieve the desired shielding effect and the anticorrosion effect is weakened. The anticorrosion effect is enhanced with the increasing GO content until the high content of GO forms a conductive path from the metal surface to the outermost edge of the coating which may accelerate corrosion of metals [Reference Liu, Gu, Zhao, Chen and Yu19, Reference Ramezanzadeh, Niroumandrad, Ahmadi, Mahdavian and Moghadam21].
Tafel plots of steel, AR, AR/GO-L (sp 2/sp 3 = 2.61) with different contents (0.5 wt%, 1 wt%, 1.5 wt%, 2 wt%) of GO in 3.5 wt% NaCl solution (a); the computed valued of protection efficiencies of AR/GO-L with different contents (0.5 wt%, 1 wt%, 1.5 wt%, 2 wt%) in 3.5 wt% NaCl aqueous (b).

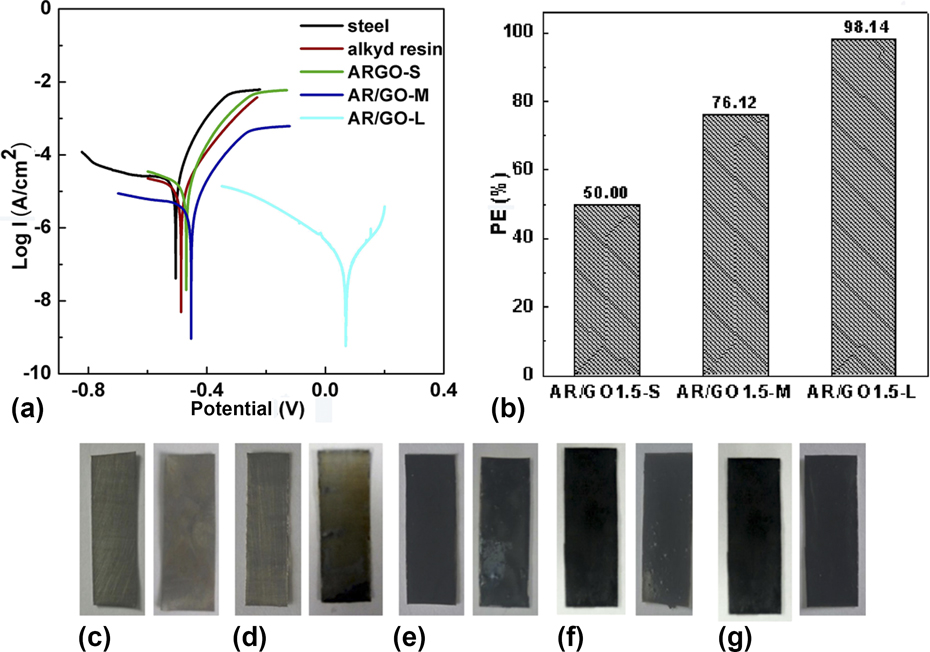
At the same time, the AR/GO1.5-S (S: 1 μm), AR/GO1.5-M (M: 38 μm), and AR/GO1.5-L (L: 120 μm) composites under same oxide degree (sp 2/sp 3 = 2.61) are shown in Fig. 6(a). The E corr values of steel, AR, AR/GO1.5-S, AR/GO1.5-M, and AR/GO1.5-L composites are −539.77 mV, −486.35 mV, −465.31 mV, −455.24 mV, and −8.34 mV, respectively. And the I corr values of steel, AR, AR/GO1.5-S, AR/GO1.5-M, and AR/GO1.5-L are 2.40 × 10⁻⁵ A/cm2, 1.36 × 10⁻⁵ A/cm2, 1.12 × 10⁻⁵ A/cm2, 5.73 × 10⁻⁶ A/cm2, and 4.47 × 10⁻⁷ A/cm2, respectively. For AR/GO1.5 coatings with three different flake sizes, the E corr values of AR/GO1.5-L dramatically increased while the I corr values sharply decreased, which suggests that the AR/GO1.5 composites with largest flake size of GO had the best corrosion resistance, because the larger flake size structure of GO makes it more difficult for the corrosive medium to diffuse into the coatings surface [Reference Chang, Huang, Peng, Yeh, Lu, Hung, Weng, Yang and Yeh6, Reference Krishnamoorthy, Veerapandian, Yun and Kim36, Reference Sun, Wang, Wu, Pan and Liu37]. The protection efficiencies of AR/GO1.5 coatings with different flake sizes are shown in Fig. 6(b). In these samples, AR/GO1.5 (120 μm) coatings have the best corrosion resistance (the protection efficiency: 98.14%) among the three coatings, because the large flake size could possess enough long path of corrosion media on the metal substrate. After immersing in 3.5 wt% NaCl aqueous for 48 h, steel and AR coatings corroded highly [Figs. 6(c) and 6(d)]. Small exfoliation appears on the surface of AR/GO1-S [Fig. 6(e)] coating, and some bubbles emerge on the AR/GO1.5-M [Fig. 6(f)] coating. Among these samples, the surface of AR/GO1.5-L [Fig. 6(g)] coating keeps smooth and unchanged. Results suggest that the AR/GO1.5-L coatings have better corrosion resistance, which is matched well with the electrochemical tests results.
(a) Tafel plots of steel, AR, AR/GO1-S (small flake, 1 wt%), AR/GO1-M (middle flake, 1 wt%), and AR/GO2-L (large flake, 1 wt%) in 3.5 wt% NaCl solution; (b) the computed values of protection efficiency of AR/GO with different contents (0.5 wt%, 1 wt%, 1.5 wt%, 2 wt%) in 3.5 wt% NaCl aqueous, (c)–(g) the photos of steel, AR, AR/GO1-S, AR/GO1-M, AR/GO1-L before and after immersing in 3.5 wt% NaCl aqueous.

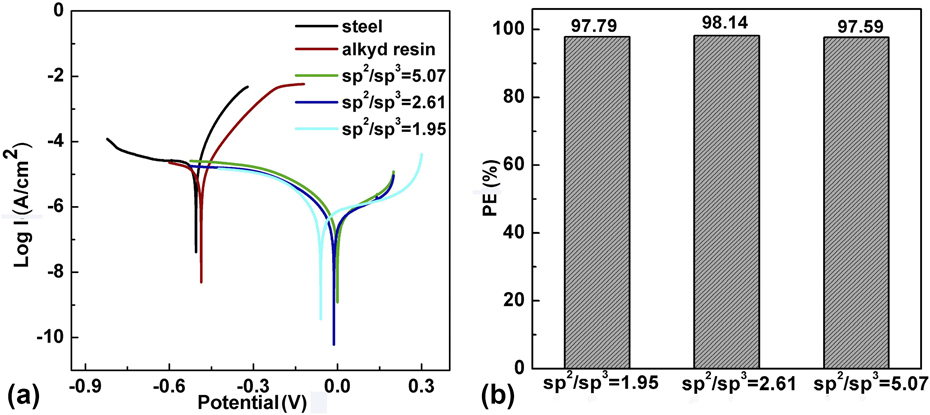
The oxide degree of GO also has huge impact on the anticorrosion property of AR/GO, and electrochemical performance of AR/GO (120 μm, 1.5 wt%) coatings with different oxidation degrees of GO are investigated in Fig. 7(a). Results show that values of the steel, AR, AR/GO1.5-L (sp 2/sp 3 = 5.07), AR/GO1.5-L (sp 2/sp 3 = 2.61), and AR/GO1.5-L (sp 2/sp 3 = 1.95) coatings are −539.77 mV, −486.35 mV, −20.45 mV, −8.34 mV, and −47.83 mV, respectively. And the I corr values of steel, AR, AR/GO (sp 2/sp 3 = 5.07), AR/GO (sp 2/sp 3 = 2.61), and AR/GO (sp 2/sp 3 = 1.95) are 2.40 × 10⁻⁵ A/cm2, 1.36 × 10⁻⁵ A/cm2, 5.29 × 10⁻⁷ A/cm2, 4.47 × 10⁻⁷ A/cm2, and 5.78 × 10⁻⁷ A/cm2, respectively. Results show that the AR/GO1.5-L (sp 2/sp 3 = 2.61) has the best corrosion resistance and also retains the highest protection efficiency (98.14%) among the three systems [Fig. 7(b)]. Results suggest that the polar groups (C=O, C–O–C, –OH) on the surface of GO could highly influence the corrosion resistance of coatings. Because the functional groups may influence the inertness, thermal stability, electrical conductivity, and mechanical properties of GO. The lower oxidation may increase the aromaticity and inter layer π–π interaction and lead the nonuniform dispersion of GO which would decrease the shielding effect of GO to the corrosive medium [Reference Venugopal, Krishnamoorthy, Mohan and Kim34, Reference Sun, Wang, Wu, Pan and Liu37, Reference Chao, Shu, Weng, Wei and Liu38]. However, the surface structure of GO may be destructed with the increasing oxidation levels which would reduce the electrical properties and mechanical properties of GO coatings [Reference Sun, Wang, Wu, Pan and Liu37]. Furthermore, the PE of AR/GO1.5-L (sp 2/sp 3 = 2.61) is still higher than other polymer/graphene coatings; even the protection efficiency of waterborne resin is lower than some oil paints (Table I).
(a) Tafel polts of steel, AR, AR/GO (large flake size, 1.5 wt%) with different oxidation degrees of GO in 3.5 wt% NaCl aqueous. (b) The computed values of protection efficiency of AR/GO (large flake size, 1.5 wt%) with different oxidation degrees in 3.5 wt% NaCl aqueous.

PE values of different polymer/GO coating.

Conclusion
In our work, the multiscale effects of GO on the corrosion resistance properties of AR coatings are studied. We find that the well-dispersed GOs with larger flake sizes and appropriate oxidation degrees can effectively enhance the anticorrosion performance of ecological AR coatings. Furthermore, the PE value of AR/GO1.5%-L (sp 2/sp 3 = 2.61) is 98.14%, which can compare with some pure oil paints [Reference Krishnamoorthy, Jeyasubramanian, Premanathan, Subbiah, Shin and Sang8, Reference Rahman, Kashif and Ahmad42]. It is believed that this work provides the theoretical and experimental basis for the application of GO in the anticorrosion fields and has significant potential for the development of environmental protection coating.
Experimental section
Raw materials
Graphite powder (the size of graphite was 1 μm, 38 μm, and 120 μm, respectively) was purchased from Qingdao Graphene Co., Ltd. (Qingdao, China). Waterborne AR was provided from Hebei CREE Paint Manufacturing Co., Ltd. (Hebei, China). Ethanol, acetone, sulfuric acid (H2SO4), sodium nitrate (NaNO3), potassium permanganate (KMnO4), and hydrogen peroxide (H2O2) were obtained from Chengdu Kelong Company (Chengdu, China).
Preparation of GO with different sizes
GOs with different flake sizes were synthesized by a modified Hummers method [Reference Hummers and Offeman28]. Graphite powder (5 g) with three different sizes was taken in a 250-mL flask with NaNO3 (3 g) at 0 °C, respectively. Then, concentrated H2SO4 (138 mL) was added slowly into the flask under stirring for 0.5 h. In this process, the temperature of mixture was kept under 10 °C. Subsequently, KMnO4 was added dropwise into the flask with continuous stirring for 2 h. Then, the reaction temperature was increased to 35 ± 3 °C and maintained for 2 h under agitation. Lastly, 276 mL of deionized water was slowly added into the solution under vigorous stirring with the temperature being kept at around 98 °C, and a dark brown suspension was obtained. The suspension was further treated by adding 84 mL of H2O2 (5%) to convert the residual permanganate and MnO2 into soluble MnSO4 and the target system turned bright yellow. The GO aqueous suspension was washed with deionized water until it was neutral.
Preparation of GO with different oxidation degrees
GO with different oxidation degrees was prepared by regulating the amount of KMnO4 (18 g or 25 g); the other parameters in the reaction were kept constant. GO with the highest oxidation degree was reduced by N2H4 (2 mL) under 80 °C for 4 h to prepare the reduced GO.
Preparation of waterborne alkyd resin/GO (AR/GO) coatings
Waterborne AR, solution (water/ethanol), and GO with different weigh ratios were blended under the ultrasound (35 °C) for 0.5 h to form a homogeneous suspension. Subsequently, the solution of coatings was stirred at 800 rpm for 20 min and defoamed at vacuum state. A tinplate was polished with 280, 400, and 800 mesh of sandpaper in sequence. Then it was washed with water and acetone and air-dried. The coatings solution was coated on the tinplate and dried at room temperature, and the thickness of the coatings was about 90 μm. The coatings incorporated with 0.5 wt%, 1 wt%, 1.5 wt%, and 2 wt% of GO were noted as AR/GO0.5, AR/GO1, AR/GO1.5, and AR/GO2, respectively.
Characterization and instruments
The infrared absorption peaks of materials were obtained by a Fourier transforms infrared spectroscopy (FTIR: Vertex 70 FTIR spectrometer, Bruker, Dusiburg, Germany). The crystallization of samples was analyzed by an X-ray diffraction (XRD: SmartLab, Rigaku Co., Tokyo, Japan). The morphology of samples were examined using anatomic force microscopy (AFM: NanowizardII, JPK instrument AG, Berlin, Germany), polarizing optical microscope (POM: Eclipse E600, Nikon, Tokyo, Japan), and transmission electron microscope (TEM: Tecnai G2F20, FEI Company, Hillsboro, OR). The chemical composition and the state of elements were investigated using X-ray photoelectron spectroscopy (XPS: AXIS Ultra, Kratos Company, Manchester, UK). Electrochemical corrosion tests were carried out using an electrochemical workstation (Autolab PGSTAT302N, Metrohm Autolab, Utrecht, Netherlands), and three-electron chemical cell (a platinum electrode, a Saturated calomel electrode, and a working electrode) were used in these experiments. All the samples were cut into squares with dimensions of 1 cm × 1 cm and tested in 3.5 wt% NaCl solution under a stable open circuit potential (OCP).
Acknowledgment
The authors would like to acknowledge the financial support by the National Natural Science Foundation of China (Grant No. 51303116).