


Introduction
The early postpartum period is a time of intense metabolic and physiological stress as the mother recovers from pregnancy, and lactation commences to support the newborn infant. Maternal healthcare, primarily within high income but also low-to-middle income countries, is undergoing a shift in focus from mortality prevention towards promoting longer-term health and wellbeing, particularly in terms of chronic and non-communicable disease (NCD) prevention of obesity, type 2 diabetes (T2DM) and cardiovascular disease (CVD).(Reference Firoz, McCaw-Binns and Filippi1) The burden NCDs are placing on women’s health and the poorer outcomes experienced by them is recognised globally,(Reference Aggarwal, Patel and Mehta2) for example in western Europe the CVD mortality rates are 8.1% higher in women compared to men.(3) Enhancing healthcare beyond the antenatal period offers a unique window of opportunity to shape and improve women’s longer-term health and wellbeing.
The WHO classifies the postpartum period as the initial 6–8 weeks after birth,(4) yet the extent of data collected on women’s health after hospital discharge is limited. Little information is collected on maternal metabolic, physical and mental health following hospital discharge within primary care as the focus is on post-birth physical recovery and assessing postnatal depression at the routine 6-week postpartum checks in general practice common for high income countries. There is increasing awareness that more needs to be done to reduce NCD development during the early postpartum period and initiatives like the FIGO Pregnancy Passport support women to monitor their CVD risk and help them to initiate health behaviour and dietary changes to reduce future risks.(Reference Nguyen-Hoang, Smith and Bergman5)
Two established health behaviours are known to reduce maternal CVD risk, namely breastfeeding and diet quality. Meta-analyses have shown breastfeeding(Reference Tschiderer, Seekircher and Kunutsor6) and diet quality(Reference Taylor, Haslam and Herbert7) to reduce CVD risk and mortality by 11–17%. The cardiometabolic impact of breastfeeding can also be seen on T2DM following gestational diabetes mellitus (GDM) with a similar level of impact.(Reference Reichental, O’Brien and O’Reilly8) Breastfeeding is linked with more favourable longer-term mental health and also markers of cardiometabolic health.(Reference McNestry, Killeen and Crowley9) There is a lack of T2DM risk awareness in women with previous gestational diabetes, a population that are also at increased risk of poor breastfeeding outcomes,(Reference Bever Babendure, Reifsnider and Mendias10) meaning that they are consequently missing out on the cardiovascular health benefits.(Reference Dunne, Sherry and O’Reilly11) Poor diet quality and its associated gastrointestinal symptoms, such as constipation, are common in the postpartum period,(Reference Derbyshire, Davies and Costarelli12) and can impact on a woman’s quality of life.(Reference Kaplan, Mazor and Prott13) The potential to improve both cardiometabolic and gastrointestinal health in breastfeeding women is important for their shorter term quality of life but also their longer term health. Breastfeeding rates are sub-optimal across the globe but certain countries, such as Ireland, have particularly low rates due to the predominance of a formula feeding culture.(14) The most common reason cited for breastfeeding cessation is low milk supply(Reference Huang, Liu and Yu15) but it is clear that true milk insufficiency is rare and building a woman’s confidence that she has adequate supply is a potentially more impactful. Mastitis, marked by elevated concentrations of proinflammatory cytokines, such as IL-1β,(Reference Castro-Navarro, Pace and Williams16) is another primary reason for breastfeeding cessation.(Reference Brown, Dodds and Legge17)
Research into the health of postpartum females is lacking, as the focus of care shifts to the infant. Nonetheless, there is potential for nutrition treatments to improve health and wellbeing in this under-served population. Yeast β-glucan is a postbiotic polysaccharide with a β 1,3/1,6 glucan structure extracted from cell wall of Saccharomyces cerevisiae, and has been shown to have beneficial effects on immunomodulatory, cardiometabolic and gut health in animal models and human randomised controlled trials (RCTs).(Reference Talbott and Talbott18–Reference Sweeney, Collins and Reilly24) Recent elegant mouse studies have found β-glucans to act as functional ‘immuno-nutrients’, which remodel innate immunity, with the mucosal/bone-marrow axis implicated.(Reference Ledwith, Prendeville and Johnston25)
Bovine casein hydrolysates have wide-ranging bioactive properties such as anti-microbial and anti-inflammatory activity in-vitro and ex-vivo(Reference Mukhopadhya and Sweeney26–Reference Mukhopadhya, Noronha and Bahar28) and may be source of bioaccessible bioactive peptides with a role in glucose regulation.(Reference Rooney, Gibney and Feeney29) Beneficial effects on immune and glycaemic health have been observed in human cohorts,(Reference Drummond, Flynn and Whelan30) a while systematic review of human RCTs found supplementation with β-glucans are well-tolerated, with modulation of the immune system likely implicated in observed health manifestations.(Reference Vlassopoulou, Yannakoulia and Pletsa31) Furthermore, animal studies have shown increased efficacy on health outcomes when a yeast β-glucan fermentate and casein hydrolysate have been tested in combination.(Reference Mukhopadhya, O’Doherty and Sweeney32, Reference Conway, O’Doherty and Mukhopadhya33) However, this supplement combination has not yet been considered in humans. This study aims to investigate the effect of a combined casein hydrolysate and yeast β-glucan supplement on immune, cardiometabolic and gastrointestinal health relative to a maltodextrin control in early postpartum lactating women.
Methods
Study design
The WellFed study was a pilot 4-week, parallel-arm RCT. Participants were randomly allocated to receive either the test supplement or placebo. Randomisation was performed using computer-based number generator in a 1:1 ratio without any restrictions, and conducted by an independent researcher with no involvement in the study. The study was double blinded and the study code was only broken after the final analysis was complete. This study was conducted according to the guidelines laid down in the Declaration of Helsinki and all procedures involving human subjects/patients were approved by the University College Dublin (UCD) Human Research Ethics Committee (LS-23-07-OSullivan) and the National Maternity Hospital Research Ethics Committee (EC06.2023). Written informed consent was obtained from all subjects. The study was registered at ClinicalTrials.gov (https://clinicaltrials.gov/), under identification number NCT05924633.
Participants
Women were recruited to the WellFed study during their third trimester of pregnancy and up to 4-weeks postpartum through in-person antenatal clinics at the National Maternity Hospital, Holles St, Dublin, poster advertising in the community and online posts. A total of n 878 women were screened via a two-phase screening process and n 58 mother and baby dyads were randomised between June 2023 and April 2024. The CONSORT(Reference Hopewell, Chan and Collins34) diagram outlining the participant flow through the WellFed study is presented in Figure 1. Inclusion criteria were: postpartum females aged 18–49 years, who were multiparous with one previously breastfed child; a term birth on the most recent pregnancy; and the established carer for that child. Participants also had to be free of breast or nipple infections, willing to avoid taking breast milk supplements targeted at impacting breast milk production, such as galactagogues, for the trial duration, not taking medications impacting lactation, and no baseline abnormality in their child that would impact their ability to breastfeed. Exclusion criteria were smoking, not free-living, inability to read, write or understand English, following a prescribed or therapeutic diet, cow’s milk protein allergy in either mother or child, and being in a very high-risk group for COVID-19.
Flow of participants through the study protocol as per CONSORT guidelines.(Reference Hopewell, Chan and Collins34) The Control was 500 mg maltodextrin. The Intervention was 250 mg of the milk protein hydrolysate, LFC16, and 250 mg of a yeast β-glucan, Wellmune®. The intervention period was 4-weeks.

Figure 1. Long description
The flowchart details the process of participant enrollment, allocation, follow-up, and analysis in a study. Initially, 878 participants were assessed for eligibility. At phase one, 791 participants were excluded for various reasons such as not meeting inclusion criteria, declining to participate, or being lost to follow-up. At phase two, 29 more participants were excluded for similar reasons. This left 58 participants who were randomized into two groups: Control and Intervention. In the Control group, 28 participants were allocated treatment, but 4 did not receive it due to personal reasons or no longer meeting inclusion criteria. In the Intervention group, 30 participants were allocated treatment, but 3 did not receive it due to personal reasons. During follow-up, 2 participants in the Control group and 1 in the Intervention group discontinued treatment due to personal reasons or being lost to follow-up. Finally, 22 participants in the Control group and 26 in the Intervention group were analyzed for the primary outcome.
Test supplements
Intervention powders were provided in opaque capsules, which were identical in taste and appearance, and supplied in weekly pill boxes at the initial visit. The intervention capsule contained 250 mg of bovine casein hydrolysate (LFC16) and 250 mg of β-glucan (Wellmune®), while the placebo capsule contained 500 mg maltodextrin. LFC16 was manufactured at Teagasc Food Research Centre Moorepark, Fermoy Co. Cork, Ireland, as described elsewhere.(Reference Mukhopadhya, Noronha and Bahar28) Wellmune® and maltodextrin were supplied by Kerry Food Ingredients, Listowel, Ireland. Participants were advised to take one capsule daily for four weeks, with weekly phone call reminders. Compliance was measured by counting returned capsules at the end of intervention.
Study visits
Mother and baby dyads were visited at home for pre- and post-intervention appointments by a registered research midwife and a study researcher. The pre-intervention visit (Week 0) was conducted between 2 weeks and 4 weeks plus 6 days postpartum, depending on the time of recruitment, maternal availability and preference. The post-intervention visit was conducted 4 weeks later. All participants had an International Board-Certified Lactation Consultant (IBCLC) consultation either prior to the first study visit or shortly afterwards. A breastfeeding observation assessment tool (BOAT) was completed at the initial consultation to assess breastfeeding status,(35) all participants were evaluated as ‘effective’ and deemed suitable to continue on the study.
Measurements
Anthropometry
Anthropometry was assessed pre- and post-intervention. Maternal height (Leicester portable height measures, Chasmores Ltd., UK), weight (SECA 803 weighing scales, Hamburg Germany), waist and hip circumference (non-stretch SECA 201 tape) were measured by trained researchers, while wearing light clothing, without shoes or belts and with empty pockets. Infant head circumference (non-stretch SECA 212 tape), length (SECA 233 measuring rod) and weight (Seca Scales 376) was measured. Infants were fully dressed for their head circumference measurement, wore only their vest for their length measurement and wore only a clean and dry nappy for their weight check. All measurements were taken in duplicate unless there was a discrepancy of 0.5 cm or more in which case a third measurement was taken. An average of all measures taken was used to determine anthropometry.
Biological samples
Biological samples were collected pre- and post-intervention and included breastmilk, blood and stool from the mother and stool and urine from the infant. Mothers were provided with a sterilised electronic breast pump (Elvie, Chiaro Technology Ltd., London, UK) two days before their study visit to collect milk from a full breast expression. While the study aimed to collect information on breastmilk production volume, i.e., mL of breast milk measured from a full breast expression, this proved challenging for participants and limited data was collected and is not included in the analysis. Participants were asked to take a 5–10 ml aliquot from the full breast expression and transfer this to a study-provided specimen container. The remaining breastmilk was returned to the infant by cup or bottle. All biological samples were collected in the 24-hours prior to the study visit and stored in the fridge (breastmilk) or freezer (urine and stool), until transportation to UCD on ice, by study researchers. A 10 ml fasting blood sample (mother only) was taken by a trained phlebotomist at the study visit. Blood samples were stored at −80°C in UCD until batch analysis. Lipids, glucose and C-reactive protein (CRP) were analysed in serum samples on a HORIBA Pentra C400 (Randox, Antrim, Northern Ireland) using corresponding reagent kits and according to manufacturer’s instructions. Quality and accuracy were monitored using internal quality controls in line with manufacturer’s guidelines with inter- and intra-assay CVs < 4.5%. LDL cholesterol was calculated using the Friedewald equation: LDL-cholesterol = (total cholesterol – HDL-cholesterol) – (triglycerides / 2.17) mmol/l.(Reference Friedewald, Levy and Fredrickson36)
Peripheral blood mononuclear cell (PBMC) and plasma isolation
Fresh blood (8 ml) was collected in 8 ml Lithium Heparin vacutainers P/N 455084 (Greiner Bio-One GmbH, Kremsmuenster, Austria). Histopaque - 1077 (Sigma, Saint Louis, Missouri, USA) was equilibrated to room temperature and 3 ml was added to 12 ml sterile LeucoSEP™ tubes (2 tubes per sample), P/N 163290, (Greiner). Each LeucoSEP™ tube was centrifuged 275 g for 2 min on a Rotanta 460R centrifuge, (Hettich, GmbH). Fresh anti-coagulated whole blood (4 ml) was pipetted slowly into the upper chamber of each of the LeucoSEP™ tubes (2 tubes per sample). The LeucoSEP™ tubes were centrifuged 1200 g for 20–25 minutes with a slow deceleration, (Brake 4) prior to stopping, with care taken not to disrupt the layers formed.
Initially the plasma layer was removed using a sterile Pasteur pipette, aliquoted and stored at −80°C. The ‘buffy layer’ containing the PBMCs, immediately below the plasma layer, was then aspirated down to the frit to make sure all mononuclear cells were collected and transferred to a new sterile tube. The PBMCs derived from the same blood sample, were then combined into the one sterile 15 ml conical tube (Sarstedt, Nümbrecht, Germany). The volume was adjusted to 10 ml with Hanks Balanced Salt Solution (HBSS) P/N H8264 (Sigma, Saint Louis, MO, USA) and centrifuged at 630 g for 6 minutes. Most of the supernatant was removed and the pellet resuspended to 6 ml with HBSS. This was re-centrifuged at 630 g for 6 minutes. The supernatant was removed completely without disrupting the pellet which was resuspended in 1 ml Tri Reagent (Sigma, Saint Louis, MO, USA) and stored at −80°C prior to further purification.
RNA purification
The PBMCs were lysed in the Tri Reagent (Sigma) by vigorously and manually shaking a 5 mm steel bead P.N. 69989 (Qiagen, Hilden, Germany) within the suspension until the cells were no longer visible. This suspension was incubated for 5 minutes at room temperature. Chloroform 200 µl (Sigma) was added to the homogenate, and shaken vigorously for 15 s and incubated at room temperature for 10 minutes. The samples were centrifuged at 12,000 g for 15 minutes in a pre-cooled micro-centrifuge (4°C). The upper aqueous layer (approx. 500 µl) was transferred into a fresh tube and 500 µl isopropanol (Sigma) was added and vortexed. Following 10 minutes at room temperature the mixture was centrifuged at 4°C at 12,000 g for 15 minutes. The supernatant was poured off onto tissue paper and the remaining translucent pellet resuspended in Molecular Grade water (100 µl). Further purification was performed using GenElute™ Total RNA purification Kit (Sigma) initiated by adding Lysis solution/ β-Mercaptoethanol (2-ME) (350 µl), performed according to the manufacturer’s instructions. RNA was eluted in a final volume of 50 µl elution buffer. The RNA was quantified and assessed for purity using the NanoDrop® Spectrophotometer ND1000 (Thermo Scientific, Wilmington DE, USA).
cDNA synthesis and quantitative PCR (qPCR)
cDNA synthesis was performed using High-Capacity cDNA Reverse Transcription Kit (Applied Biosystems, Foster City, CA, USA) with 500 ng of total RNA according to the manufacturer’s instructions. The final 20 µl volume was then adjusted to 250 µl with RNAse free water.
Primer sets for each target were designed using Primer Express™ (Applied Biosystems, Foster City, CA, USA) and synthesised by Eurofins Genomics (Valiant Way, Wolverhampton, UK) as shown in Supplemental Table 1. Specificity of the targets was assessed initially in BLAST- Basic Local Alignment Search Tool(Reference Ye, Coulouris and Zaretskaya37) and confirmed experimentally thorough examination of the dissociation curves. Assays achieving 90–110% efficiency were considered acceptable. The targets included inflammatory mediators and cytokines: IL10, IL1A, IL6, CXCL8, INFG, TNF and reference genes, Glyceraldehyde-3-phosphate dehydrogenase and Peptidylprolyl isomerase A. qPCR was performed in duplicate using the ABI PRISM 7300 sequence detection system (Applied Biosystems, Foster City, CA, USA). Each 20 µl reaction contained, 1.2 µl forward and reverse primers (300 nM), 10 µl SYBR™ Green Universal Master Mix (Applied Biosystems, Foster City, CA, USA), 3.8 µl of molecular grade water and 5 µl of cDNA. The cycling conditions were as follows: 95°C for 10 minutes for 1 cycle, followed by 95°C for 15 s and 60°C for 1 minute for 40 cycles. Normalised relative quantities were generated in qBase™ Plus software (BioGazelle, Ghent, Belgium) where the relative gene expression of the target genes was calculated using a modified delta-Ct method which adjusts for PCR efficiency and uses multiple reference genes for normalisation.(Reference Hellemans, Mortier and De Paepe38) The normalised relative quantities were used for all subsequent analysis.
Questionnaires/health information
Gastrointestinal symptoms were assessed by the ‘Structured Assessment of Gastro-Intestinal Symptoms’ (SAGIS)(Reference Koloski, Jones and Hammer39) administered weekly using SurveyMonkey (San Mateo, California, U.S.A). SAGIS is a 22-item questionnaire based on a Likert scale approach, with a scoring system of no problem (0), mild (1), moderate (2), severe (3) and very severe (4).(Reference Koloski, Jones and Hammer39) Domain scores relating to total symptom burden score, global impact score, epigastric pain score, diarrhoea and discomfort score, reflux score, nausea/vomiting score, and constipation score can be calculated.(Reference Koloski, Jones and Hammer39) Information on maternal and infant health, medication and supplement intake, problems with breastfeeding, infant feeding, infant gastrointestinal symptoms and general infant behaviour and wellbeing was collected via a weekly diary. A health questionnaire, administered pre- and post-intervention, collected demographic information, and included the Stanford brief activity survey(Reference Taylor-Piliae, Fair and Haskell40) to assess physical activity levels and the Warwick–Edinburgh mental well-being scale(Reference Tennant, Hiller and Fishwick41) to assess mental wellbeing. Dietary information was collected pre-and post-intervention via three 24-hour dietary recalls, each spaced 48 hours apart, using FoodBook24.(Reference Evans, Hennessy and Walton42–Reference Timon, Evans and Kehoe44) The contribution of diet to nutrient intake, serum and breastmilk vitamin concentrations of this cohort is published elsewhere.(Reference Ali, O’Dwyer and Murphy45)
Statistical analysis
Statistical analysis was performed with SPSS version 29.0.2 for Mac (SPSS Inc., Chicago, IL). Descriptive analysis was performed on demographic, anthropometric, questionnaire, dietary, and clinical chemistry data for the total population and by intervention group. Data were examined for normality of distribution, and log transformed if not normally distributed. Delta (Δ) values were calculated by subtracting the pre-intervention from the post-intervention values. Differences in response across categorical variables were assessed using χ 2 testing. Differences in continuous variables were assessed by repeated measures ANCOVA or one-way ANCOVA with Bonferroni correction. Clinical chemistry variables were adjusted for maternal age and BMI. The scores of each SAGIS domain are reported as the arithmetic mean of the scores of the symptoms composing the domain in each subject. While skewed distributions are sometimes described in terms of percentiles, for SAGIS measures in this study the distribution includes sufficient zero counts that the median is insensitive to small-to-moderate changes in distributions. Hence, mean ± SD are reported here, an approach taken by the authors of the original SAGIS validation study(Reference Koloski, Shah and Kaan46–Reference Jones, Shah and Ben-Jacob47) and others.(Reference Noviello, Costantino and Muscatello48)
Within the SAGIS questionnaire domains, responders were classified as those with ≥30 % response compared to baseline, an approach based on US Food and Drug Administration clinical evaluation of products for IBS treatment(49) and applied to SAGIS data elsewhere,(Reference Staudacher, Nevin and Duff50,Reference Eswaran, Chey and Han-Markey51) however within this study this was an exploratory analysis. An improvement within each individual question was classed as a greater increase in those scoring ‘no problem’ compared to ‘severe-very severe problem’ at Week 4 (Visit 2) compared to Week 0 (Visit 1).
The primary outcome for the WellFed RCT was expression of inflammatory cytokines in blood in response to 4-week intervention. Secondary outcomes included digestive health (SAGIS),(Reference Koloski, Jones and Hammer39) markers of metabolic health including cholesterol, triacylglycerol, glucose and insulin, secretory IgA in breastmilk and breastmilk production volume. The sample size was estimated using data from previously published studies examining the effect of the β-glucan supplement in different cohorts (athletes, older adults and stressed females).(Reference Talbott and Talbott18,Reference Talbott, Talbott and Talbott19,Reference Fuller, Moore and Lewith21) The outcome measures included upper respiratory tract infections, inflammatory markers (e.g. IL-2, IL-4, IL-5, CCL2/MCP-1) and subjective feelings (e.g. mood, energy). A series of power calculations were performed using α = 0.05 and β = 0.20 resulting in expected groups sizes of n 12–81. Using the mean n 50 and allowing for a 40% drop out rate, a sample size of 70 participants was set for each study group.
Results
Participant cohort
The flow of participants through the study protocol is presented in Figure 1, in line with CONSORT recommendations.(Reference Hopewell, Chan and Collins34) Of n 878 women screened for inclusion in the study, n 791 (90.1%) were excluded at phase one and n 29 (3.3%) were excluded at phase two. Primary reasons for not meeting inclusion criteria were screening incompletion (22.8%), first time mum (36.4%), not planning to exclusively breastfeed (5.8%), limited breastfeeding experience (2.5%) or being outside the recruitment window (16.3%). A further n 19 (2.2%) declined to participate and n 42 (4.8%) were lost to follow-up. A total of n 58 were randomised and allocated to a treatment arm, of these n 7 did not receive treatment owing to personal reasons (n 6) or no longer meeting recruitment criteria (n 1). A total of n 48 mother-baby dyads completed the intervention, n 22 in the control group and n 26 in the intervention group.
Participant demographics, anthropometry and breastfeeding
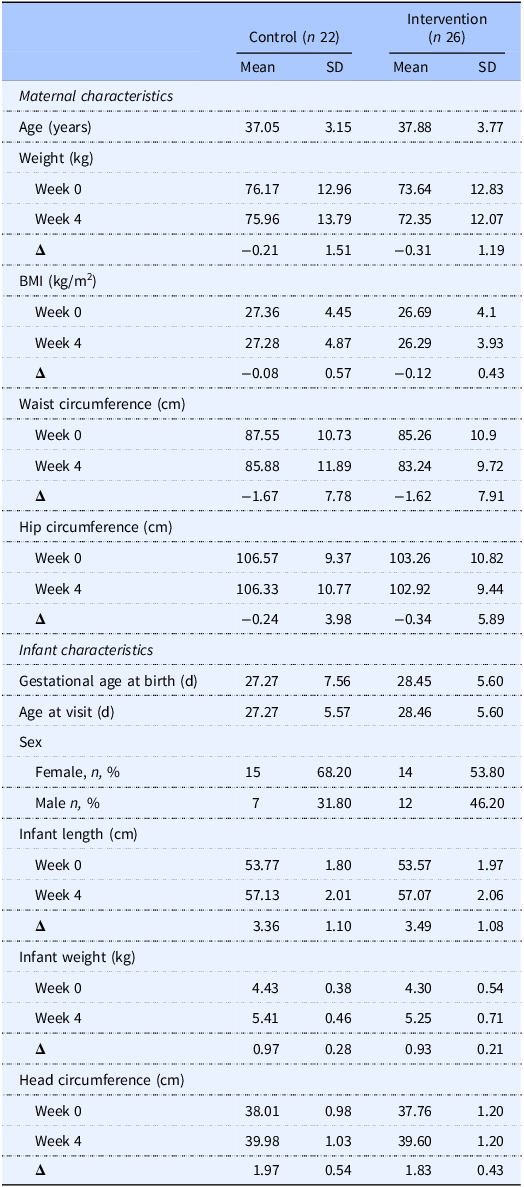
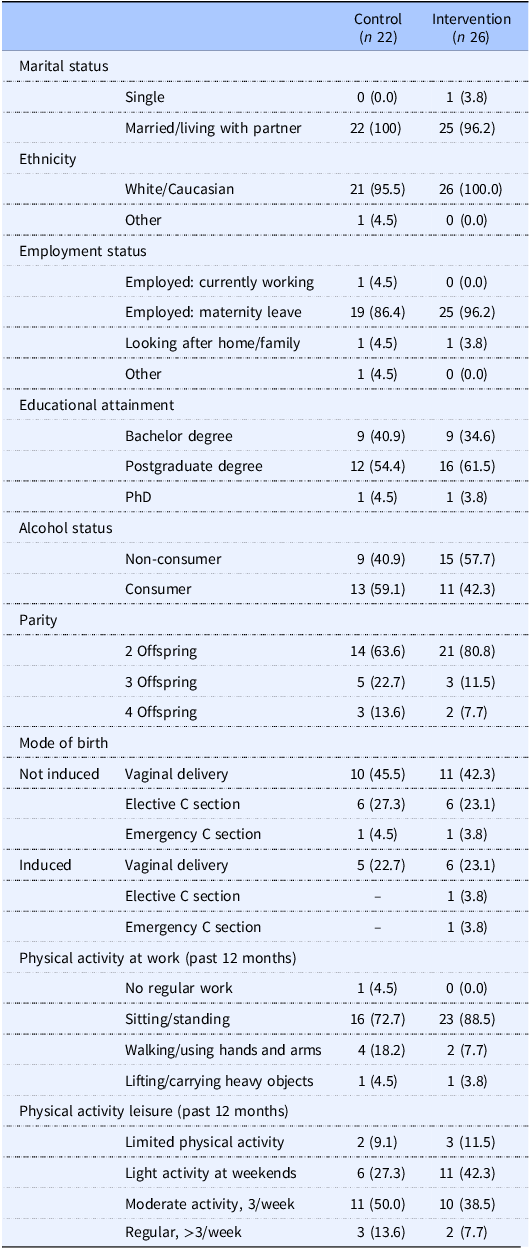
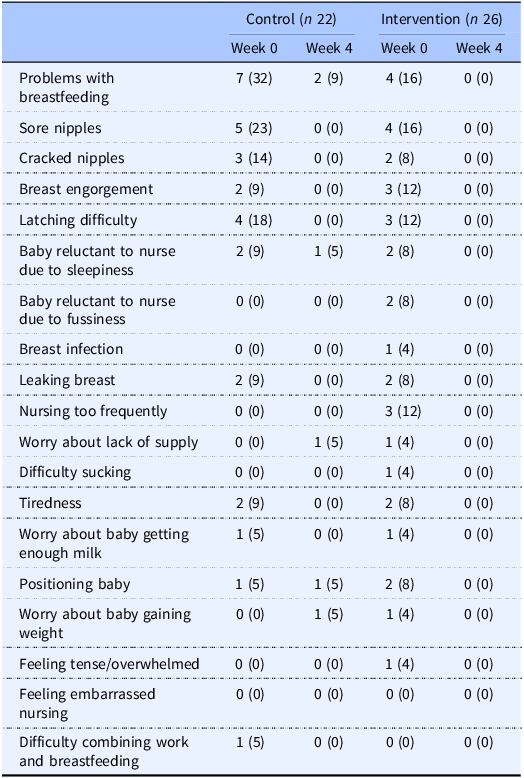
Mothers were 37.5 ± 3.5 years with a mean BMI of 27.0 ± 4.2 kg/m2. Mean infant age at the start of intervention was 27.9 ± 5.5 days. Infant length, weight and head circumference were 53.7 ± 1.9 cm, 4.4 ± 0.5 kg and 37.9 ± 1.1 cm, respectively (Table 1). Vaginal birth (n 32, 66.7%) was the most common birth mode, followed by elective (n 13, 27.1%) and emergency (n 3, 6.3%) caesarean section, while n 13 (27.1%) labours were induced, and n 35 (72.9%) labours were not induced (Table 2). All mothers were exclusively breastfeeding at the start and end of the study period. The mean ± SD number of feeds per day was 10.0 ± 2.4 at Week 0, when the infant was ∼4 weeks old, and 9.0 ± 1.8 feeds per day at Week 4, when the baby was ∼8 weeks old. Self-reported problems related to breastfeeding are presented in Table 3. At Week 0, n 11 (22.9%) of mothers reported having a ‘problem with breastfeeding’, while by Week 4, n 2 (9.1%) in the Control group reported a problem compared to n 0 (0%) in the Intervention group. While the number of mothers reporting ‘problems with breastfeeding’ is fewer than the number of reports for specific issues, this highlights the interpretation of ‘problems with breastfeeding’ amongst mothers and how they may need to be probed for answers to specific questions related to their personal health and breastfeeding experience. Supplement compliance was assessed as 96% throughout the study.
Maternal and infant characteristics across the study period, stratified by group (n 48)

Table 1. Long description
A table comparing maternal and infant characteristics across a study period, stratified by control and intervention groups. The table has 22 rows and 6 columns. Column headers are Control (n 22) Mean, Control (n 22) SD, Intervention (n 26) Mean, Intervention (n 26) SD. Row labels include Maternal characteristics and Infant characteristics. Maternal characteristics include Age (years), Weight (kg) at Week 0 and Week 4, BMI (kg/m^2) at Week 0 and Week 4, Waist circumference (cm) at Week 0 and Week 4, and Hip circumference (cm) at Week 0 and Week 4. Infant characteristics include Gestational age at birth (d), Age at visit (d), Sex (Female, n, %, Male, n, %), Infant length (cm) at Week 0 and Week 4, Infant weight (kg) at Week 0 and Week 4, and Head circumference (cm) at Week 0 and Week 4. Notable trends include changes in weight, BMI, waist circumference, and hip circumference for mothers, and changes in length, weight, and head circumference for infants over the study period.
Data presented as mean, SD or n (%). The Control was 500 mg maltodextrin. The Intervention was 250 mg of the milk protein milk protein hydrolysate, LFC16, and 250 mg of a yeast β-glucan, Wellmune®.
Differences across continuous anthropometric variables assessed by one-factor ANOVA or Mann–Whitney U non-parametric ANOVA where appropriate. Differences across categorical variables assessed by Pearson χ 2 test. P < 0.05 considered significant.
Demographic information of study cohort at week 0 (n 48)

Table 2. Long description
The table presents demographic information of study participants in control and intervention groups. It has 12 rows and 4 columns. The columns are labeled ‘Marital status’, ‘Control (n 22)’, and ‘Intervention (n 26)’. The rows are labeled with various demographic categories and their respective values. Row 1: Single, Control 0 (0.0), Intervention 1 (3.8). Row 2: Married/living with partner, Control 22 (100), Intervention 25 (96.2). Row 3: White/Caucasian, Control 21 (95.5), Intervention 26 (100.0). Row 4: Other, Control 1 (4.5), Intervention 0 (0.0). Row 5: Employed: currently working, Control 1 (4.5), Intervention 0 (0.0). Row 6: Employed: maternity leave, Control 19 (86.4), Intervention 25 (96.2). Row 7: Looking after home/family, Control 1 (4.5), Intervention 1 (3.8). Row 8: Other, Control 1 (4.5), Intervention 0 (0.0). Row 9: Bachelor degree, Control 9 (40.9), Intervention 9 (34.6). Row 10: Postgraduate degree, Control 12 (54.4), Intervention 16 (61.5). Row 11: PhD, Control 1 (4.5), Intervention 1 (3.8). Row 12: Non-consumer, Control 9 (40.9), Intervention 15 (57.7). Row 13: Consumer, Control 13 (59.1), Intervention 11 (42.3). Row 14: 2 Offspring, Control 14 (63.6), Intervention 21 (80.8). Row 15: 3 Offspring, Control 5 (22.7), Intervention 3 (11.5). Row 16: 4 Offspring, Control 3 (13.6), Intervention 2 (7.7). Row 17: Not induced Vaginal delivery, Control 10 (45.5), Intervention 11 (42.3). Row 18: Elective C section, Control 6 (27.3), Intervention 6 (23.1). Row 19: Emergency C section, Control 1 (4.5), Intervention 1 (3.8). Row 20: Induced Vaginal delivery, Control 5 (22.7), Intervention 6 (23.1). Row 21: Elective C section, Control 0 (0.0), Intervention 1 (3.8). Row 22: Emergency C section, Control 0 (0.0), Intervention 1 (3.8). Row 23: No regular work, Control 1 (4.5), Intervention 0 (0.0). Row 24: Sitting/standing, Control 16 (72.7), Intervention 23 (88.5). Row 25: Walking/using hands and arms, Control 4 (18.2), Intervention 2 (7.7). Row 26: Lifting/carrying heavy objects, Control 1 (4.5), Intervention 1 (3.8). Row 27: Limited physical activity, Control 2 (9.1), Intervention 3 (11.5). Row 28: Light activity at weekends, Control 6 (27.3), Intervention 11 (42.3). Row 29: Moderate activity, 3/week, Control 11 (50.0), Intervention 10 (38.5). Row 30: Regular, >3/week, Control 3 (13.6), Intervention 2 (7.7).
Data presented as n (%).
The Control was 500 mg maltodextrin. The Intervention was 250 mg of casein hydrolysate, LFC16, and 250 mg of a yeast β-glucan, Wellmune®.
Differences between groups at Week 0 assessed by Pearson Chi-square test. P < 0.05 considered significant.
Self-reported problems with breastfeeding across treatment groups at the pre (week 0) and post (week 4) intervention stage of the WellFed study (n 48)

Table 3. Long description
A table comparing breastfeeding problems across control and intervention groups over four weeks. The table has 22 rows and 6 columns. The columns are labeled Control (n 22) Week 0, Control (n 22) Week 4, Intervention (n 26) Week 0, and Intervention (n 26) Week 4. The rows are labeled with various breastfeeding problems and their corresponding values. Row 1: Problems with breastfeeding, 7 (32), 2 (9), 4 (16), 0 (0). Row 2: Sore nipples, 5 (23), 0 (0), 4 (16), 0 (0). Row 3: Cracked nipples, 3 (14), 0 (0), 2 (8), 0 (0). Row 4: Breast engorgement, 2 (9), 0 (0), 3 (12), 0 (0). Row 5: Latching difficulty, 4 (18), 0 (0), 3 (12), 0 (0). Row 6: Baby reluctant to nurse due to sleepiness, 2 (9), 1 (5), 2 (8), 0 (0). Row 7: Baby reluctant to nurse due to fussiness, 0 (0), 0 (0), 2 (8), 0 (0). Row 8: Breast infection, 0 (0), 0 (0), 1 (4), 0 (0). Row 9: Leaking breast, 2 (9), 0 (0), 2 (8), 0 (0). Row 10: Nursing too frequently, 0 (0), 0 (0), 3 (12), 0 (0). Row 11: Worry about lack of supply, 0 (0), 1 (5), 1 (4), 0 (0). Row 12: Difficulty sucking, 0 (0), 0 (0), 1 (4), 0 (0). Row 13: Tiredness, 2 (9), 0 (0), 2 (8), 0 (0). Row 14: Worry about baby getting enough milk, 1 (5), 0 (0), 1 (4), 0 (0). Row 15: Positioning baby, 1 (5), 1 (5), 2 (8), 0 (0). Row 16: Worry about baby gaining weight, 0 (0), 1 (5), 1 (4), 0 (0). Row 17: Feeling tense/overwhelmed, 0 (0), 0 (0), 1 (4), 0 (0). Row 18: Feeling embarrassed nursing, 0 (0), 0 (0), 0 (0), 0 (0). Row 19: Difficulty combining work and breastfeeding, 1 (5), 0 (0), 0 (0), 0 (0).
Data reported as n (%).The Control was 500 mg Maltodextrin. The intervention was 250 mg of the milk protein milk protein hydrolysate, LFC16, and 250 mg of a yeast β-glucan, Wellmune®. While the number of mothers reporting ‘problems with breastfeeding’ is fewer than the number of reports for specific issues, this highlights the interpretation of ‘problems with breastfeeding’ amongst mothers and how they may need to be probed for answer to specific questions related to their personal health and breastfeeding experience.
Expression of inflammatory cytokine genes in PBMCs
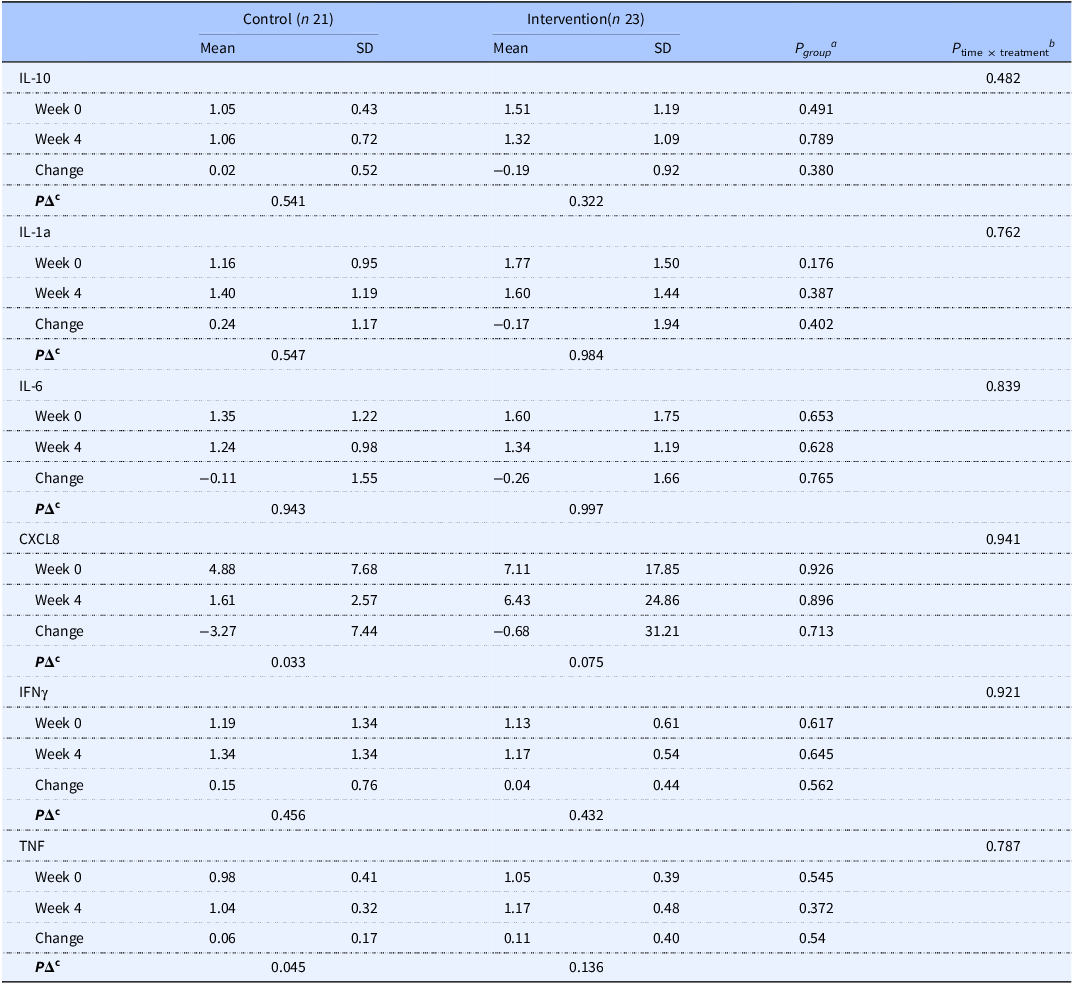
Cytokine expression data is available for n 44 mothers and presented in Table 4. No time × treatment interactions in PBMC expression of IL-10, IL-1a, IL-6, CXCL8, INFγ or TNF were observed. For CXCL8, samples from n 8 participants were >10 at either Week 0 or Week 4. When the analysis was tested without these outliers, mean reductions were −0.06 ± 0.76 within the Control group and −1.17 ± 3.48 within the Intervention group (P = 0.284, data not shown). Distribution of participants for the expression of each cytokine gene at each timepoint is shown in Figure 2.
Cytokine PMBC expression at week 0 and week 4. The Control was 500 mg maltodextrin. The Intervention was 250 mg of the milk protein hydrolysate, LFC16, and 250 mg of a yeast β-glucan, Wellmune®. No differences between groups were observed.

Cytokine expression across intervention groups and time (n 44)

Table 4. Long description
The table presents cytokine expression data for control and intervention groups over a period of four weeks. It includes measurements for IL-10, IL-1a, IL-6, CXCL8, IFNγ, and TNF. The table has 21 rows and 11 columns. Column headers include Control (n 21) with Mean and SD, Intervention (n 23) with Mean and SD, P group, and P time x treatment. Row labels include Week 0, Week 4, Change, and PΔ. Each cytokine has its own section with corresponding data for each week and the change over time. Notable trends and comparisons are indicated by P values for group and time x treatment interactions.
Data presented as mean ± SD. The Control was 500 mg Maltodextrin. The intervention was 250 mg of the milk protein milk protein hydrolysate, LFC16, and 250 mg of a yeast β-glucan, Wellmune®.
a P group Differences within groups assessed by one-way ANOVA.
b P time × treatment Differences between groups assessed by repeated measured ANCOVA adjusting for maternal age and BMI.
c PΔ Within group differences assessed by paired samples t-test.
Clinical biochemistry
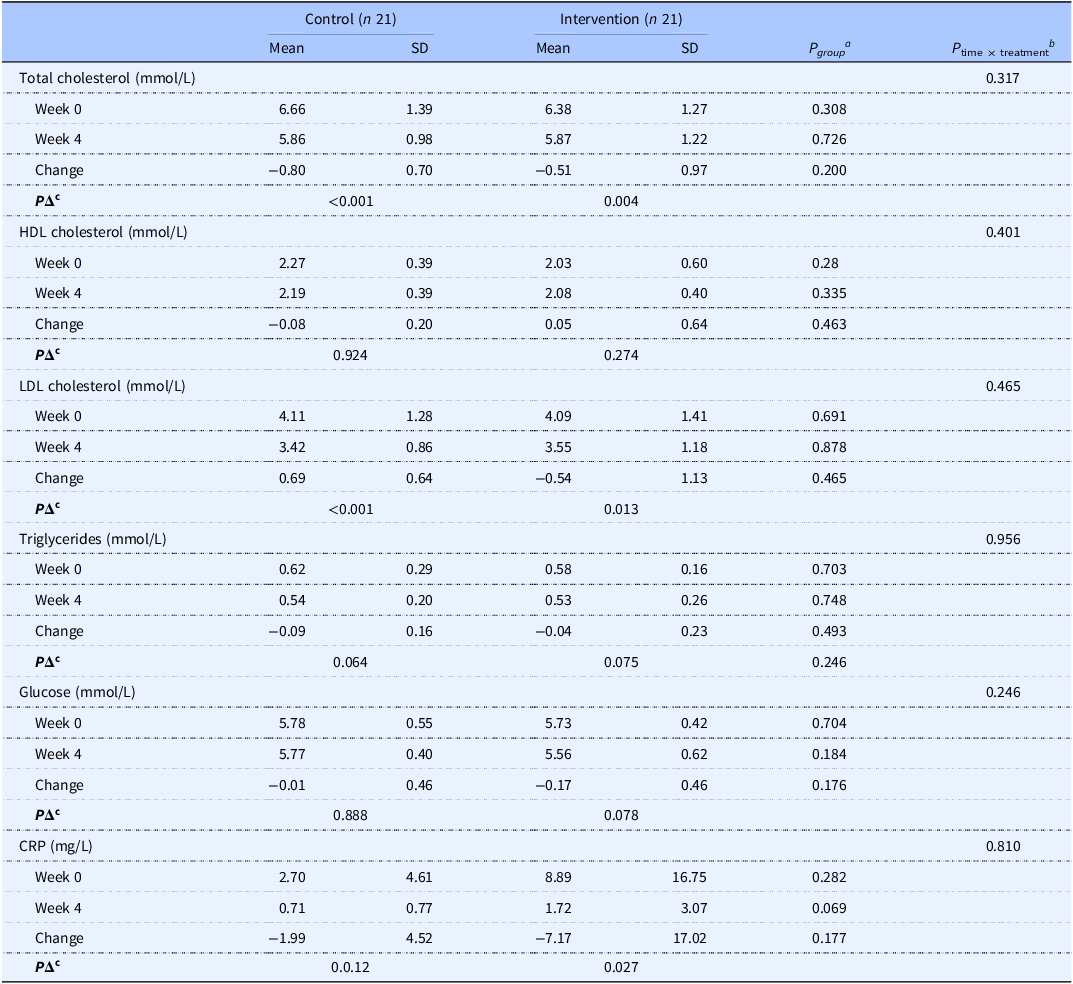
Serum samples were available for n 42 participants, n 21 in each group. Mean ± SD concentrations were 6.52 ± 1.32 mmol/L for total cholesterol and 4.10 ± 1.33 mmol/L for LDL cholesterol. Fasting glucose concentrations were 5.76 ± 0.48 mmol/L and CRP was 5.80 ± 12.5 mg/l. No time × treatment interactions for lipids, glucose or CRP were observed (Table 5).
Clinical biochemistry variables across intervention groups and time (n 42)

Table 5. Long description
A table comparing clinical biochemistry variables across control and intervention groups over time. The table has 8 rows and 9 columns. Column headers are Control (n 21), Mean, SD, Intervention (n 21), Mean, SD, P group, P time x treatment. Row labels are Total cholesterol (mmol/L), Week 0, Week 4, Change, PΔ, HDL cholesterol (mmol/L), Week 0, Week 4, Change, PΔ, LDL cholesterol (mmol/L), Week 0, Week 4, Change, PΔ, Triglycerides (mmol/L), Week 0, Week 4, Change, PΔ, Glucose (mmol/L), Week 0, Week 4, Change, PΔ, CRP (mg/L), Week 0, Week 4, Change, PΔ. Row 1: Control (n 21), Mean, 6.66, SD, 1.39, Intervention (n 21), Mean, 6.38, SD, 1.27, P group, 0.308, P time x treatment, 0.317. Row 2: Control (n 21), Mean, 5.86, SD, 0.98, Intervention (n 21), Mean, 5.87, SD, 1.22, P group, 0.726. Row 3: Control (n 21), Mean, -0.8, SD, 0.7, Intervention (n 21), Mean, -0.51, SD, 0.97, P group, 0.200. Row 4: PΔ, <0.001, PΔ, 0.004. Row 5: Control (n 21), Mean, 2.27, SD, 0.39, Intervention (n 21), Mean, 2.03, SD, 0.6, P group, 0.28, P time x treatment, 0.401. Row 6: Control (n 21), Mean, 2.19, SD, 0.39, Intervention (n 21), Mean, 2.08, SD, 0.4, P group, 0.335. Row 7: Control (n 21), Mean, -0.08, SD, 0.2, Intervention (n 21), Mean, 0.05, SD, 0.64, P group, 0.463. Row 8: PΔ, 0.924, PΔ, 0.274. Row 9: Control (n 21), Mean, 4.11, SD, 1.28, Intervention (n 21), Mean, 4.09, SD, 1.41, P group, 0.691, P time x treatment, 0.465. Row 10: Control (n 21), Mean, 3.42, SD, 0.86, Intervention (n 21), Mean, 3.55, SD, 1.18, P group, 0.878. Row 11: Control (n 21), Mean, 0.69, SD, 0.64, Intervention (n 21), Mean, -0.54, SD, 1.13, P group, 0.465. Row 12: PΔ, <0.001, PΔ, 0.013. Row 13: Control (n 21), Mean, 0.62, SD, 0.29, Intervention (n 21), Mean, 0.58, SD, 0.16, P group, 0.703, P time x treatment, 0.956. Row 14: Control (n 21), Mean, 0.54, SD, 0.2, Intervention (n 21), Mean, 0.53, SD, 0.26, P group, 0.748. Row 15: Control (n 21), Mean, -0.09, SD, 0.16, Intervention (n 21), Mean, -0.04, SD, 0.23, P group, 0.493. Row 16: PΔ, 0.064, PΔ, 0.246. Row 17: Control (n 21), Mean, 5.78, SD, 0.55, Intervention (n 21), Mean, 5.73, SD, 0.42, P group, 0.704, P time x treatment, 0.246. Row 18: Control (n 21), Mean, 5.77, SD, 0.4, Intervention (n 21), Mean, 5.56, SD, 0.62, P group, 0.184. Row 19: Control (n 21), Mean, -0.01, SD, 0.46, Intervention (n 21), Mean, -0.17, SD, 0.46, P group, 0.176. Row 20: PΔ, 0.888, PΔ, 0.078. Row 21: Control (n 21), Mean, 2.7, SD, 4.61, Intervention (n 21), Mean, 8.89, SD, 16.75, P group, 0.282, P time x treatment, 0.81. Row 22: Control (n 21), Mean, 0.71, SD, 0.77, Intervention (n 21), Mean, 1.72, SD, 3.07, P group, 0.069. Row 23: Control (n 21), Mean, -1.99, SD, 4.52, Intervention (n 21), Mean, -7.17, SD, 17.02, P group. Row 24: PΔ, 0.012, PΔ, 0.027.
Data presented as mean ± SD. The Control was 500 mg maltodextrin. The Intervention was 250 mg of the milk protein milk protein hydrolysate, LFC16, and 250 mg of a yeast β-glucan, Wellmune®.
a P group Differences between groups assessed by repeated measures ANOVA adjusting for maternal age and baseline BMI, with Bonferroni correction.
b P time × treatment Differences between groups for delta (Δ) values (Week 4 minus Week 0 values) assessed by one-way ANOVA adjusting for maternal age and BMI with Bonferroni correction.
c PΔ Within group differences assessed by paired t-test.
Gastrointestinal symptoms
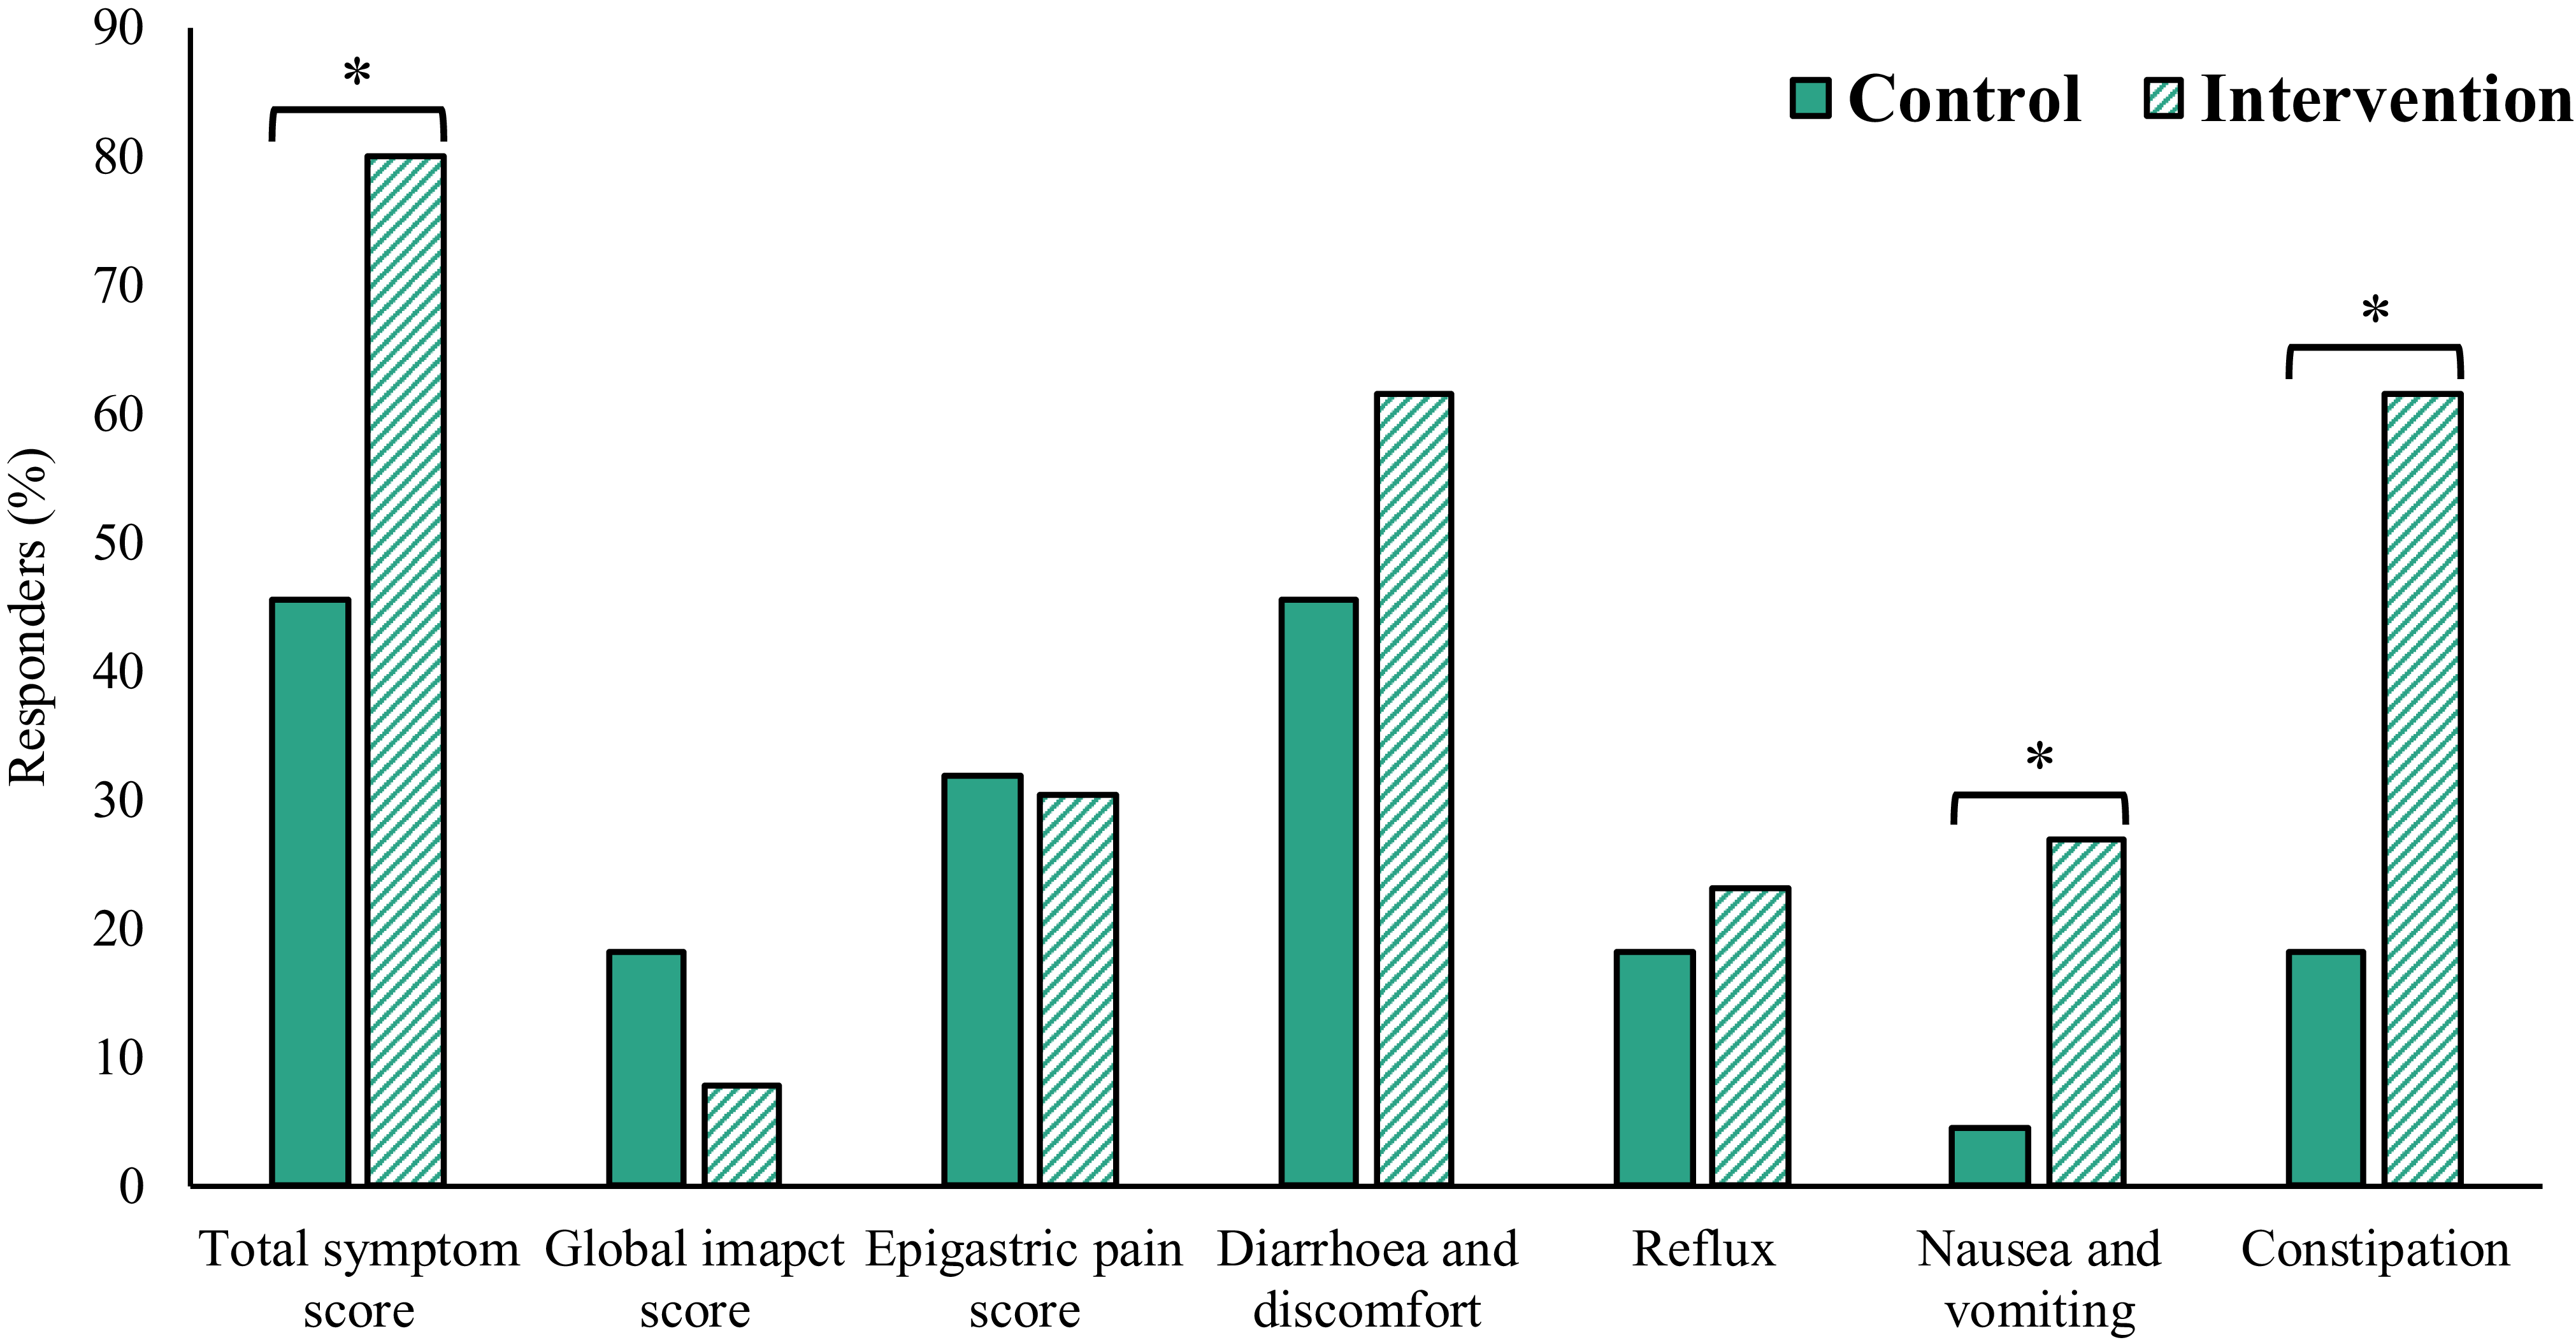
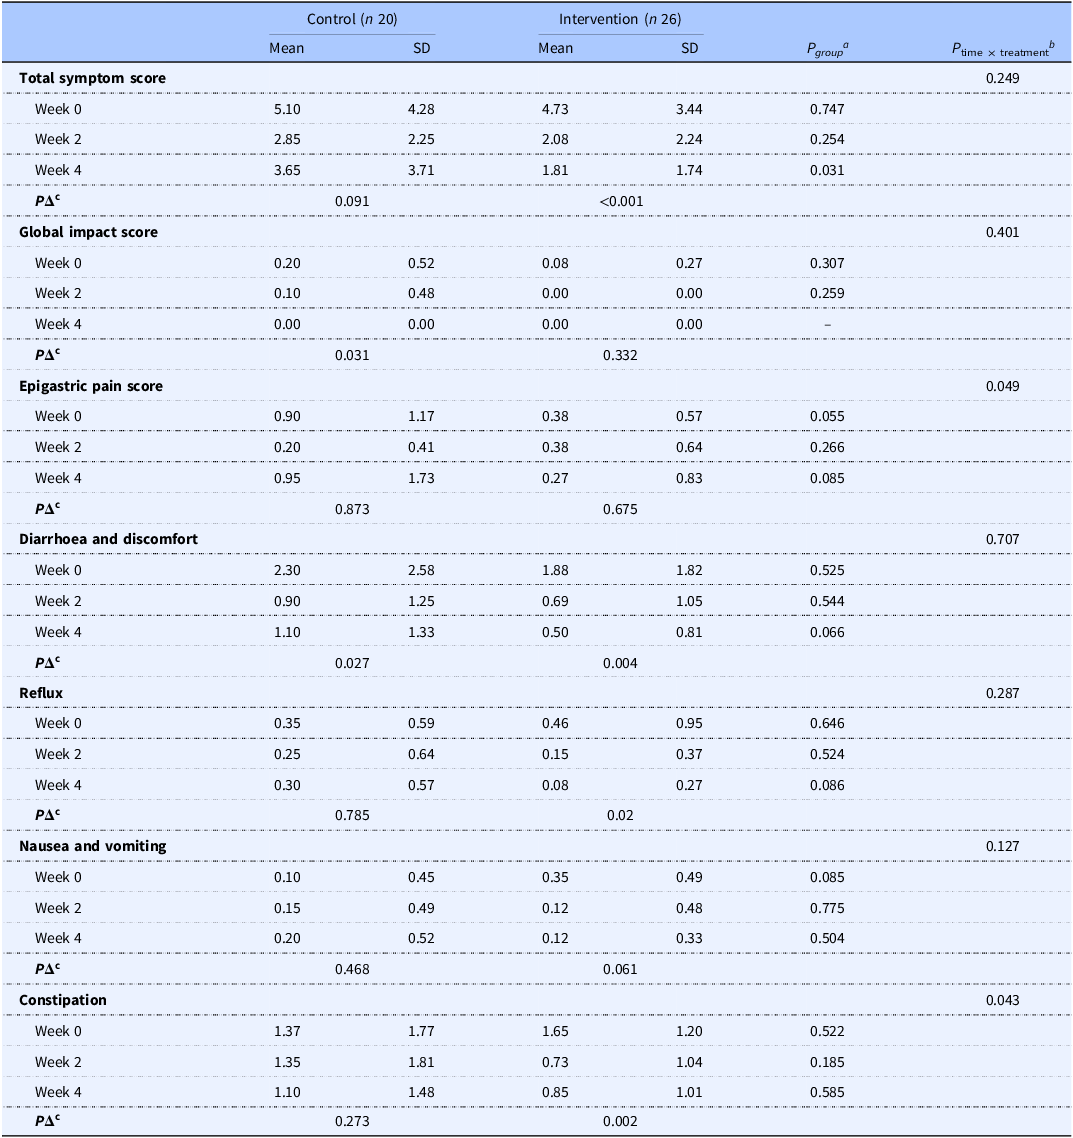
Complete SAGIS questionnaires were available at Weeks 0, 2 and 4 for n 46 mothers (control, n 20; intervention n 26). Domain scores are presented in Table 6. At Week 0, n 26 (56.5%) mothers reported an issue with constipation, and n 27 (58.7%) had difficulty with defaecation, while n 12 (26.1%) reported an urgency to defaecate and n 3 (6.7%) experienced diarrhoea. Time × treatment interactions were observed for epigastric pain score (P = 0.049) and constipation (P = 0.043). While no other time × treatment interactions were observed for other SAGIS domains, some within group and within time differences were observed, with greater improvements observed in the Intervention group (Table 6). Individual question responses (Supplementary Table 2) improved almost twice as much within those assigned to intervention (n 11/50.0%) compared to control (n 6/27.3%). A greater proportion of participants were classified as responders at Week 4 in the intervention compared to control group for total symptom score (n 21/80.0 % vs n 10/45.5 %, P = 0.011), nausea and vomiting (n 7/26.9 % vs n 1/4.5 %, P = 0.038) and constipation (n 16/61.5 % vs n 4/18.2 %, P = 0.002), as shown in Figure 3. At Week 2, there were more responders in the intervention relative to control group for nausea and vomiting (P = 0.029) and constipation (P = 0.010, data not shown). Stool consistency at Week 0 was reported as hard (n 12, 25%) or normal (n 34, 70.8%) and loose (n 2, 4.2%). Differences over time were observed within both the Control (P = 0.04) and Intervention (P = 0.003) groups, with a shift towards normal stool consistency (Figure 4).
The percentage of participants within the control (shaded bars) and intervention (hatched bars) groups classed as responders at week 4, for each of the SAGIS domain scores. (Reference Koloski, Jones and Hammer39) The Control was 500 mg maltodextrin. The Intervention was 250 mg of the milk protein hydrolysate, LFC16, and 250 mg of a yeast β-glucan, Wellmune®. Responders were those with ≥30% response at week 4 compared to week 0. More responders were observed within the Intervention relative to Control groups for total symptom score (P = 0.011), nausea and vomiting (P = 0.038) and constipation (P = 0.002). *P < 0.05, assessed by Chi square testing.

A and B. Bowel habits of study volunteers at week 0 and week 4 of the WellFed RCT. The Control was 500 mg maltodextrin. The Intervention was 250 mg of the milk protein hydrolysate, LFC16, and 250 mg of a yeast β-glucan, Wellmune®. Panel A, stool consistency as assessed by Bristol Stool Form Chart(Reference Lewis and Heaton63) and presented as hard (green shaded bars), normal (hatched bars) or loose (light grey shaded bars). There were no significant differences between groups at week 0 or week 4. Significant differences were noted within groups for both Control (P = 0.004) and Intervention (P = 0.003). Panel B, stool frequency presented as the frequency of bowel motions on a weekly (blue shaded and hatched bars) or daily basis (green shaded and hatched bars). There was a significant difference within the Intervention group only (P < 0.001).

Figure 4. Long description
Panel A: A bar graph shows stool consistency assessed by the Bristol Stool Form Chart. The x-axis represents time points (Week 0 and Week 4) for both Control and Intervention groups. The y-axis represents frequency in percent. The graph uses three types of bars: green shaded for hard stools, hatched for normal stools, and light grey shaded for loose stools. Significant differences within groups are noted for both Control (P = 0.004) and Intervention (P = 0.003). Panel B: Another bar graph shows stool frequency, presented as the frequency of bowel motions on a weekly (blue shaded and hatched bars) or daily basis (green shaded and hatched bars). The x-axis represents time points (Week 0 and Week 4) for both Control and Intervention groups. The y-axis represents frequency in percent. A significant difference within the Intervention group is noted (P < 0.001).
SAGIS domain scores across intervention groups and time (n 46)

Table 6. Long description
The table presents SAGIS domain scores for control (n 20) and intervention (n 26) groups at Weeks 0, 2, and 4. It includes mean and standard deviation (SD) values for total symptom score, global impact score, epigastric pain score, diarrhea and discomfort, reflux, nausea and vomiting, and constipation. Notable trends include time-treatment interactions for epigastric pain score (P 0.049) and constipation (P 0.043). The table also shows within-group and within-time differences, with greater improvements observed in the intervention group.
Data presented as mean ± SD. The Control was 500 mg maltodextrin. The Intervention was 250 mg of the milk protein milk protein hydrolysate, LFC16, and 250 mg of a yeast β-glucan, Wellmune®.
a P group Differences between groups assessed by repeated measures ANCOVA adjusting for maternal age and baseline BMI, with Bonferroni correction.
b P time × treatment Difference in ‘change’ variable between groups assessed by one-way ANCOVA adjusting for maternal age and BMI with Bonferroni correction.
c PΔ Within group differences assessed by paired t-test.
Diet
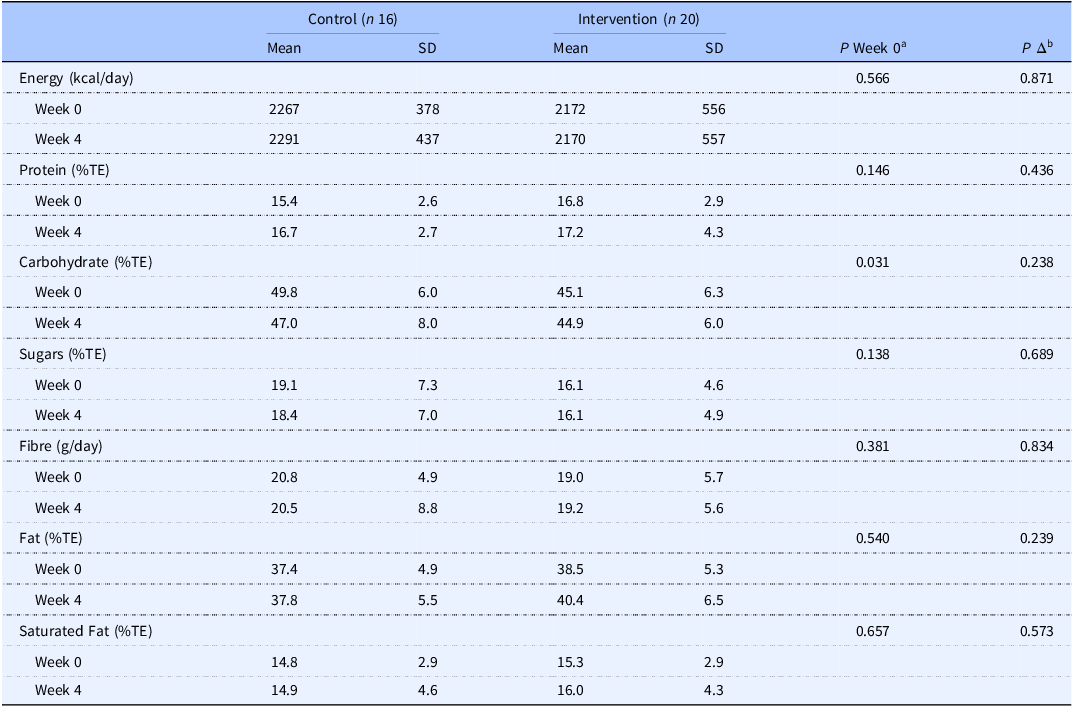
Dietary intake data was available for n 36 mothers. At Week 0, mean energy intake for the cohort as a whole was 2214 ± 481 kcal/day, with protein, carbohydrate and fat contributing 16.2 ± 2.9 %, 47.2 ± 6.5 % and 38.0 ± 5.1 % to total energy intakes, respectively (Table 7). Carbohydrate intake was 3.97 ± 1.86 %TE higher in the Control compared to the Intervention group at Week 0 (P = 0.031). Mean fibre intake was below recommendations of 30 g/day at 19.8 ± 5.4 g/day and remained unchanged throughout the study period. No changes in dietary intake were observed throughout the study protocol.
Dietary intake across the study period, stratified by group (n 36)

Table 7. Long description
The table presents dietary intake data for control and intervention groups over a study period. It has 12 rows and 10 columns. The columns are labeled as Control (n 16), Intervention (n 20), Mean, SD, P Week 0, and P Δ. The rows are labeled as Energy (kcal/day), Protein (%TE), Carbohydrate (%TE), Sugars (%TE), Fibre (g/day), Fat (%TE), and Saturated Fat (%TE). Each nutrient category is measured at Week 0 and Week 4. For example, Energy (kcal/day) shows values for Week 0 and Week 4 for both groups, with means and standard deviations provided. The table also includes P values for Week 0 and the change over the study period.
Data presented as mean ± standard deviation. The Control was 500 mg maltodextrin. The Intervention was 250 mg of the milk protein milk protein hydrolysate, LFC16, and 250 mg of a yeast β-glucan, Wellmune®. %TE, percentage of total energy intake; kcal, kilocalories.
a Differences across groups at Week 0 calculated with 1-factor ANOVA or Kruskal–Wallis nonparametric ANOVA where appropriate.
b Differences between groups for delta (Δ) values (Week 4 minus Week 0 values) calculated with 1-factor ANOVA or Kruskal–Wallis nonparametric ANOVA where appropriate.
Discussion
This analysis demonstrated that the metabolic fingerprint of pregnancy was still evident at 4- and 8-weeks postpartum, as evidenced by elevated clinical cardiometabolic markers and high prevalence of gastrointestinal symptoms. While the intervention findings point to a potential role of the supplement as a novel, dietary approach to improve maternal gastrointestinal health, namely constipation, in the early postpartum period, no effect on inflammation or cardiometabolic health was observed. This work builds on earlier cell and animal studies where the novel dietary supplement combination has been shown to ameliorate intestinal health, performance and inflammatory gene expression in post-weaned piglets.
Constipation is a common postpartum gastrointestinal symptom.(Reference Shin, Toto and Schey52–Reference Hierink, Brinkman and Malmberg54) Over half of mothers in the study at baseline reported having an issue with constipation with over one quarter experiencing urgency to defaecate. These findings are stark, and more marked than reports at 6-months(Reference Hierink, Brinkman and Malmberg54) and 1-year(Reference van Brummen, Bruinse and van de Pol55) postpartum. In the aforementioned in vitro and animal studies, combined casein hydrolysate and yeast β-glucan have been shown to improve intestinal health, particularly diarrhoea in post-weaning piglets, which is a common occurrence at this juncture.(Reference Mukhopadhya, O’Doherty and Sweeney32–Reference Venardou, O’Doherty and McDonnell56) Most interestingly, supplementation of sows improved faecal score and reduce incidence of diarrhoea in piglets in the 10-days post weaning.(Reference Conway, O’Doherty and Mukhopadhya33) The greatest impact was observed when piglets also received the supplement, while gut microbiome changes are thought to contribute to the effect.(Reference Conway, O’Doherty and Mukhopadhya33) Interestingly, in this human study improvements in constipation were observed, indicating that perhaps the local gastrointestinal tract is being influenced by the intervention. The inflammatory state of the gut has been shown to be influenced by the function of neurotransmitters,(Reference Lu, Zhao and Guan57) which may explain the effects on gut motility observed here. In a similar study in healthy adults with gastrointestinal discomfort and constipation, intervention with EpiCor, a yeast β-glucan fermentate, improved both quality of life and constipation in as little as two weeks with beneficial changes in the gut microbiome also reported,(Reference Pinheiro, Robinson and Verhelst58) although dairy fermentates have been shown to have limited effect.(Reference Rooney, Chonnacháin and Finnerty59) Given these findings and the current analysis, combining a milk protein hydrolysate and yeast β-glucan may offer an effective nutritional approach to manage gastrointestinal symptoms, particularly as a Cochrane review deemed there was insufficient evidence regarding the effectiveness and safety of laxatives for preventing postpartum constipation.(Reference Turawa, Musekiwa and Rohwer60) Consequently, there is a need for effective, alternative therapies in this under-served population group, although further mechanistic studies and human trials are warranted.
This study considered cytokine expression in PBMCs in a postpartum, lactating cohort, with no immune-modulatory effect observed. This is unexpected, given casein hydrolysate has been shown to suppress expression of inflammatory gene markers, independently of β-glucan supplementation, in the gastrointestinal tract of piglets following early and abrupt separation from the sow.(Reference Mukhopadhya, O’Doherty and Sweeney32) Expression of IL-1B and CXCL8 genes in duodenal tissue and CXCL8 and INFγ in colon tissue was suppressed, with the NFκB pathway thought to be implicated.(Reference Mukhopadhya, O’Doherty and Sweeney32) Such findings are also supported by in vitro and ex vivo experiments of a Caco-2 cell line, and a porcine colonic tissue explant system.(Reference Mukhopadhya, Noronha and Bahar27,Reference Mukhopadhya, Noronha and Bahar28) Analysis of a human study investigating n 50 females throughout pregnancy and 6-weeks and 6-months postpartum found serum TNF and INFγ, but not IL-12p70, IL-1B, IL-6 or CXCL8, to be influenced by pregnancy status.(Reference Kraus, Sperling and Engel61) The previously reported anti-inflammatory effects may not be as evident in the peripheral blood as they are in the gastrointestinal tract, something which cannot be established in human subjects. Given the promising cell and pre-clinical findings in this area, it is plausible a greater dose, longer duration or larger sample sizes are warranted to further investigate the health impacts of this novel nutrition intervention in humans. However, based on the values observed in the present study sample sizes of 98–660 would be required to detect a 20–50% change in PBMC cytokine expression.
The double-blind nature of this RCT is a key strength. Recruitment, however, was challenging and the target number of participants based on power calculations was not reached. However, post hoc power calculations on baseline data of the participants indicate the analysis was powered to detect a 17.5% change in total cholesterol, a 10% change in glucose, but not powered for other biochemical or gastrointestinal parameters. Although the findings are promising, given the lack of power, studies in larger sample sizes are warranted. Further, while the responder analysis is based on US Food and Drug Administration Guidance for Industry Irritable Bowel Syndrome - Clinical Evaluation of Drugs for Treatment,(49) this was exploratory and not part of the a priori analysis plan. Of interest is the BLOOM study, a multi-centre Australian trial investigating the effect of brewer’s yeast and β-glucans on maternal milk supply after preterm birth.(Reference Grzeskowiak, Rumbold and Williams62) The study protocol has been published, and future findings will help further inform on potential health effects of a novel food ingredient on maternal health and well-being and infant health and growth.(Reference Grzeskowiak, Rumbold and Williams62) In the present RCT, participants were drawn from a small geographical area, and as such results lack generalisability to wider populations. Whilst this study aimed to investigate the effect of a nutrition intervention on milk production volume, there were challenges with sample collection. Future studies should further consider more effective methods to assess milk production volume in lactating women.
The postpartum period poses a challenge to both the metabolism and gut health while recovering from pregnancy. Given the findings presented here, and the lack of evidence in the area, the need to investigate and report maternal postpartum health is highlighted. Public health policy must pay more attention to dietary recommendations, lifestyle interventions and food support. The intervention considered here, a combined casein hydrolysate, LFC16, and yeast β-glucan, Wellmune®, may offer an effective, well-tolerated, food-first approach to health, with a growing body of evidence in relation to maternal health, and health generally. Furthermore, the perceptions around problems with breastfeeding uncovers a need for greater education and public health campaigns around breastfeeding support, and well-designed studies that effectively explore this topic.
This study highlights the persistence of the fingerprint of pregnancy on maternal health at 4-weeks postpartum, with over half of mothers experiencing constipation and one quarter reporting an urgency to defaecate, alongside elevated markers of cardiometabolic health. Findings from this RCT indicate supplementation with a combined milk protein hydrolysate, LFC16, and yeast β-glucan, Wellmune®, was well tolerated and improved gastrointestinal symptoms, in particular constipation and general health, compared to a maltodextrin control. No effects on immune or cardiometabolic health were noted, although the sample size may have been underpowered to detect significant changes in these variables. Given the lack of research and effective public health policy in the maternal health landscape, further studies in this area are warranted to explore the role of a combined milk protein hydrolysate and yeast β-glucan in improving maternal health in the postpartum period.
Supplementary material
The supplementary material for this article can be found at https://doi.org/10.1017/jns.2026.10153.
Data availability statement
Data described in the manuscript, will not be made available, in line with current UCD HREC data storage and retention guidelines, the de-identified archived data are only accessible to study investigators and will not be accessible to others.
Acknowledgements
The authors wish to thank all the participants who participated in the studies included in the present analysis. The authors are grateful to Food for Health Ireland for funding the trial included in this study, and to Kerry Food Ingredients for supplying the test materials.
Author contributions
Conceptualisation, AOS, TS, SOR; data curation and formal analysis, MR, MA, AOS; investigation, MA, BM, FOD AR, MTR; methodology, AOS, TS, SOR; project administration, BM, AOS; supervision, AOS; funding acquisition, AOS, TS, SOR; visualisation, MR; writing of the original draft, MR, SOR, MTR, AOS. All authors reviewed and edited the final draft.
Financial support
This study was supported by Food for Health Ireland, from Enterprise Ireland (TC20180025 to AOS). Food for Health Ireland had no role in the design, analysis or writing of this article. Food for Health Ireland is a dairy technology centre part-financed by Enterprise Ireland and partly by dairy companies in Ireland.
Competing interests
The authors declare the following financial interests/personal relationships which may be considered as potential competing interests: This study was supported by Food for Health Ireland, from Enterprise Ireland (TC20180025 to AOS). The funders had no role in the analyses or interpretation of data, in the writing of the manuscript or in the decision to publish the findings. No other financial interests or personal relationships to declare.
Declaration of generative AI and AI-assisted technologies in the writing process
No generative AI or AI-assisted technologies were used in the writing process of this manuscript.





 Open access

